Maps
List of BC NGA maps showing distribution of specific geochemical parameters.
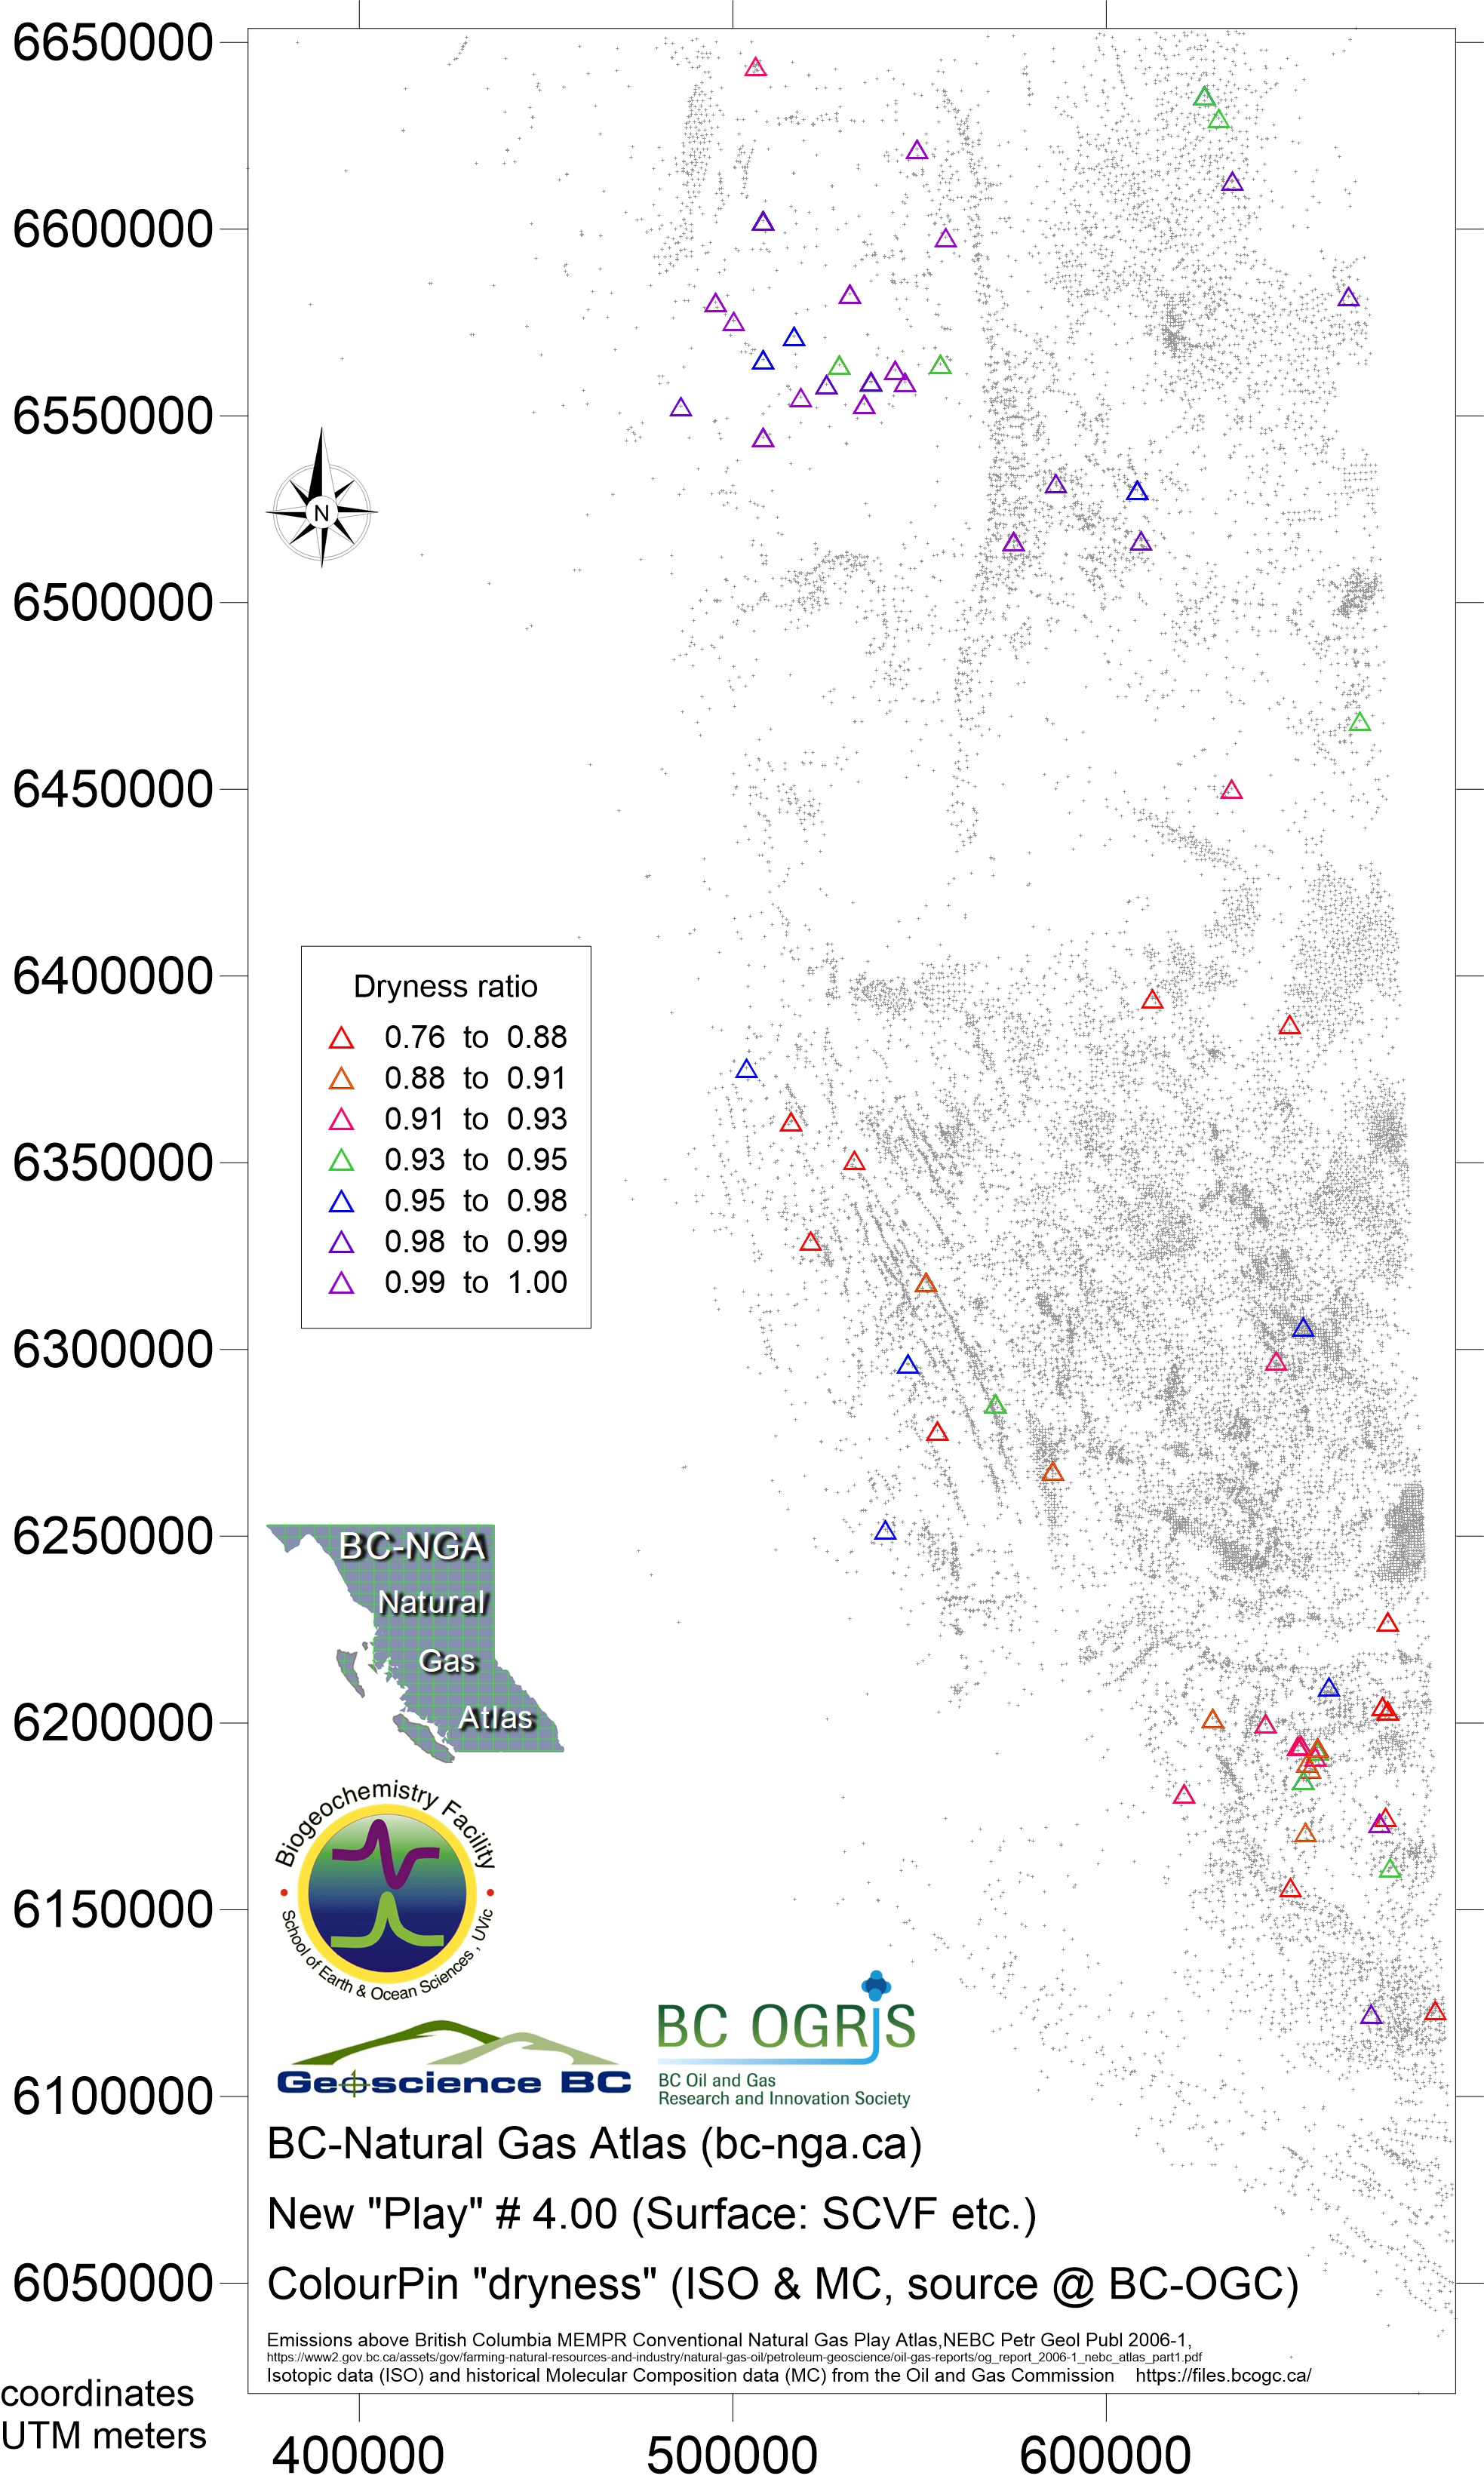
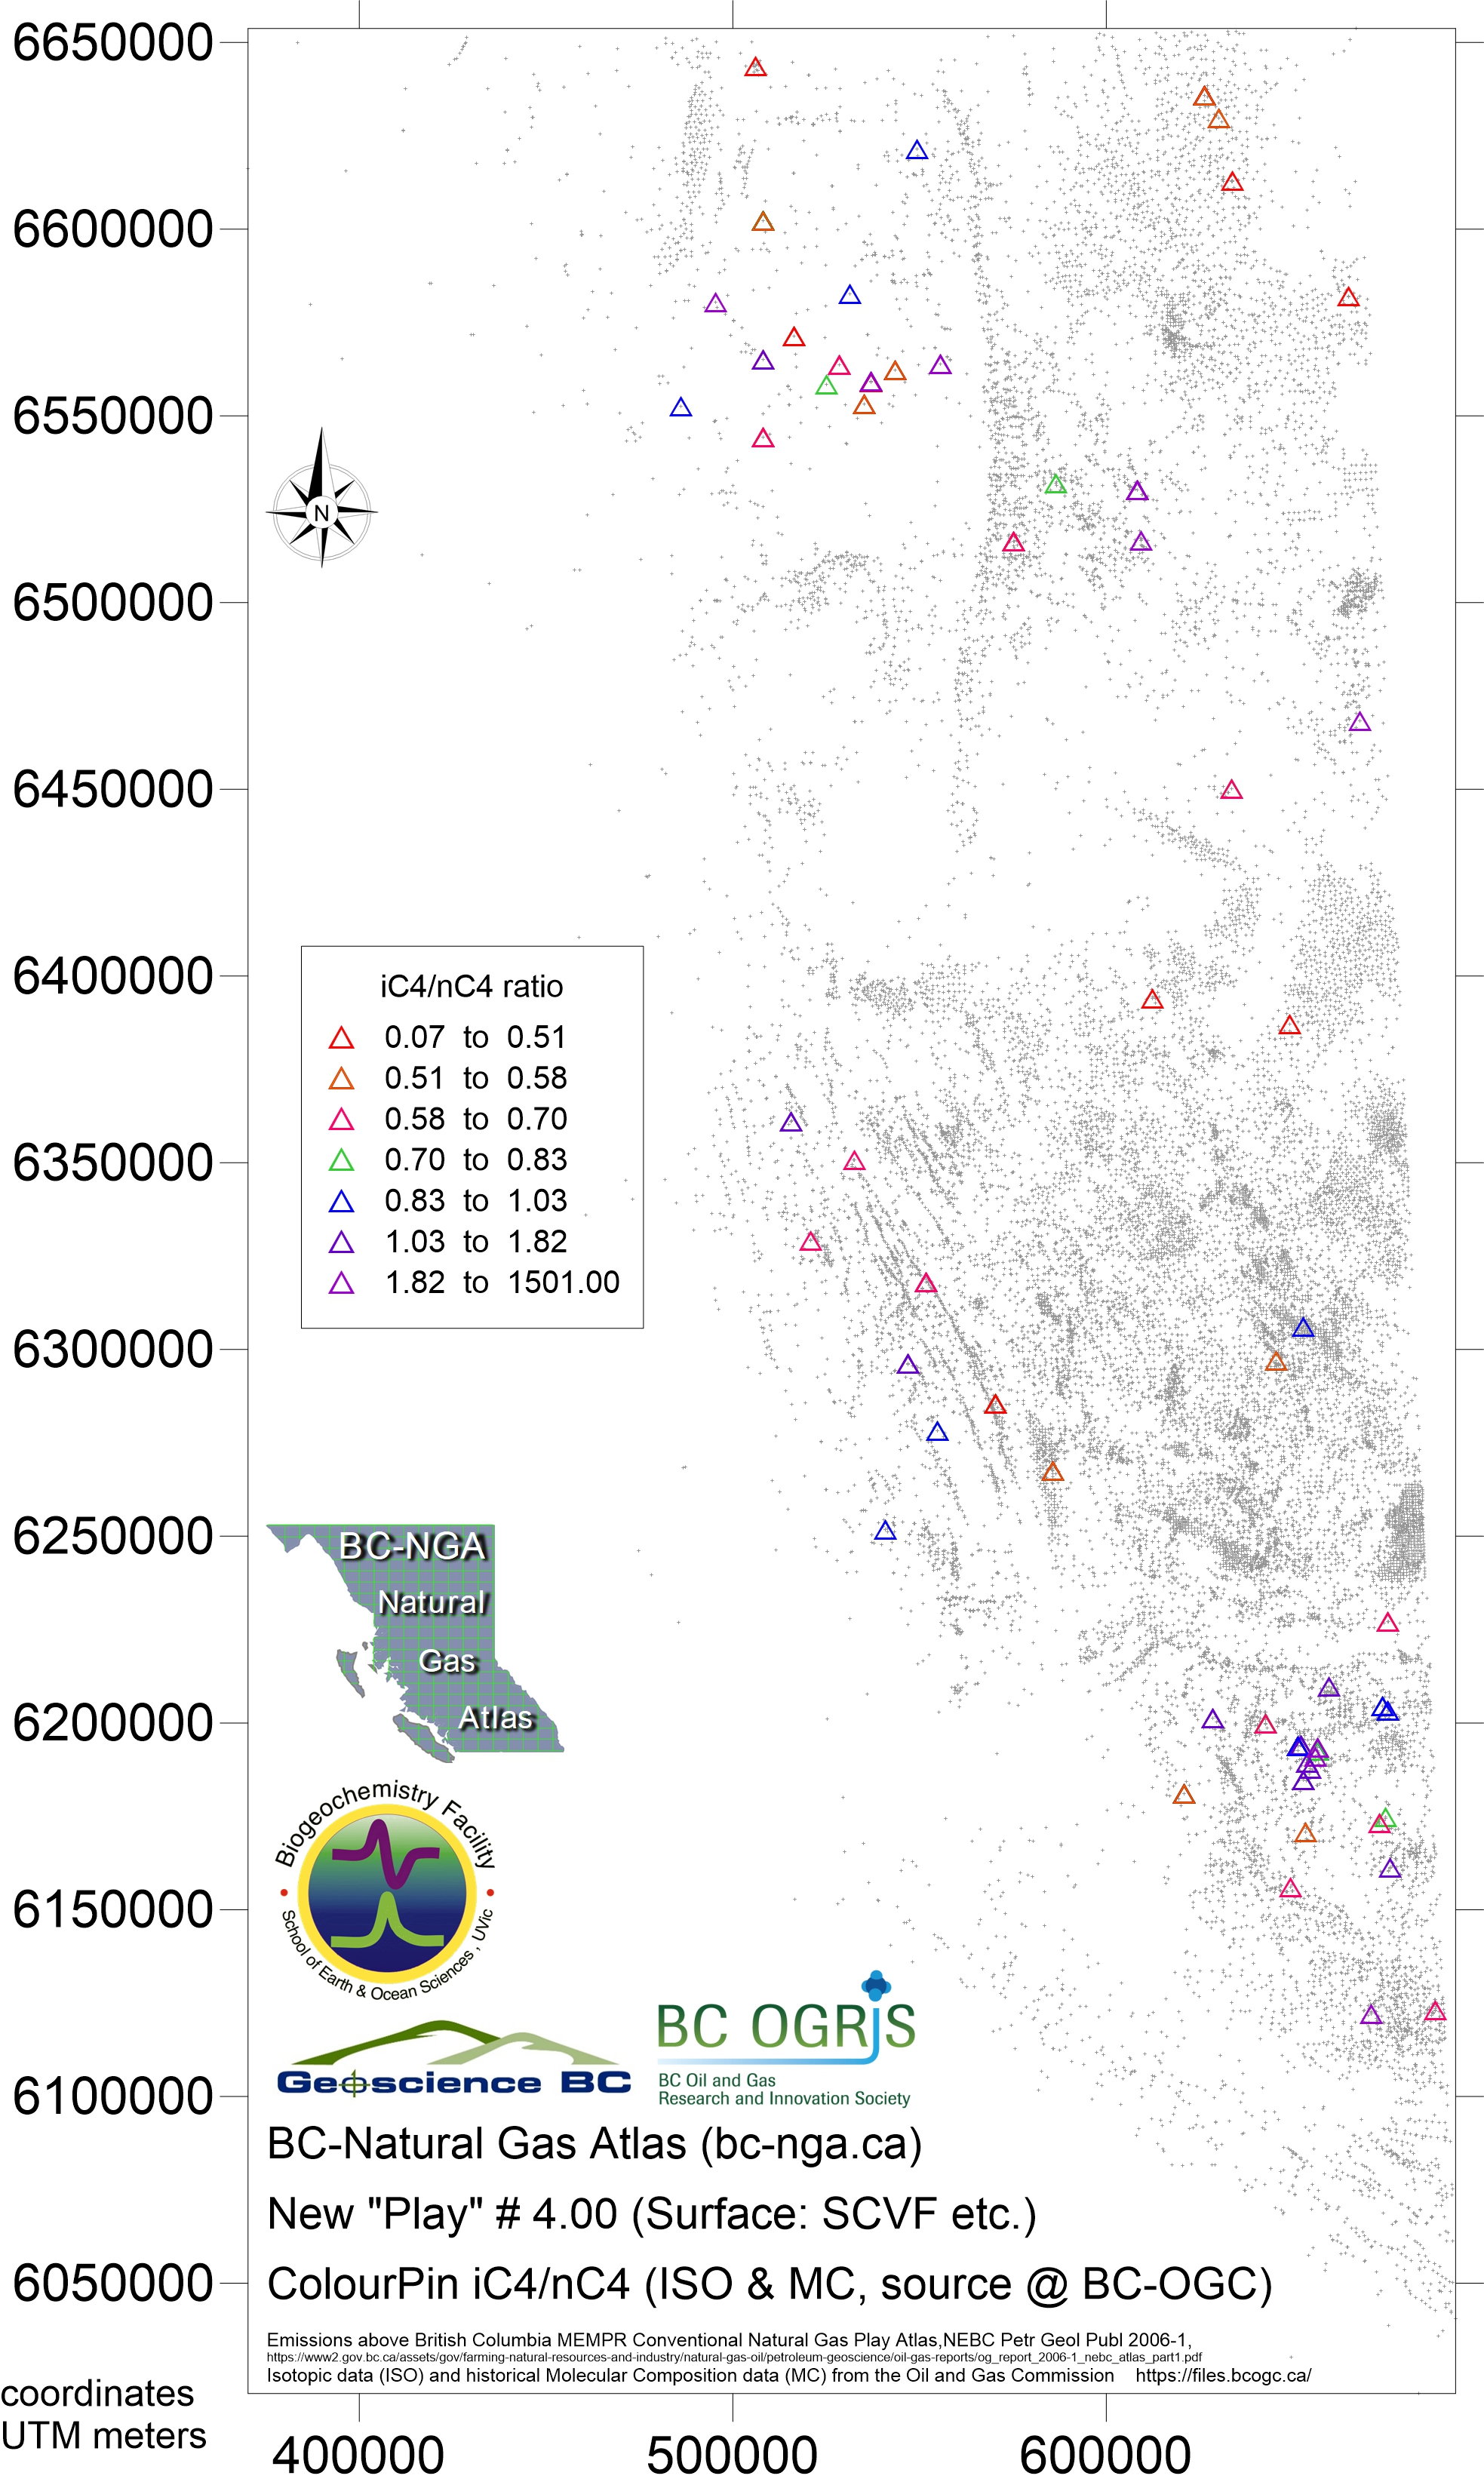
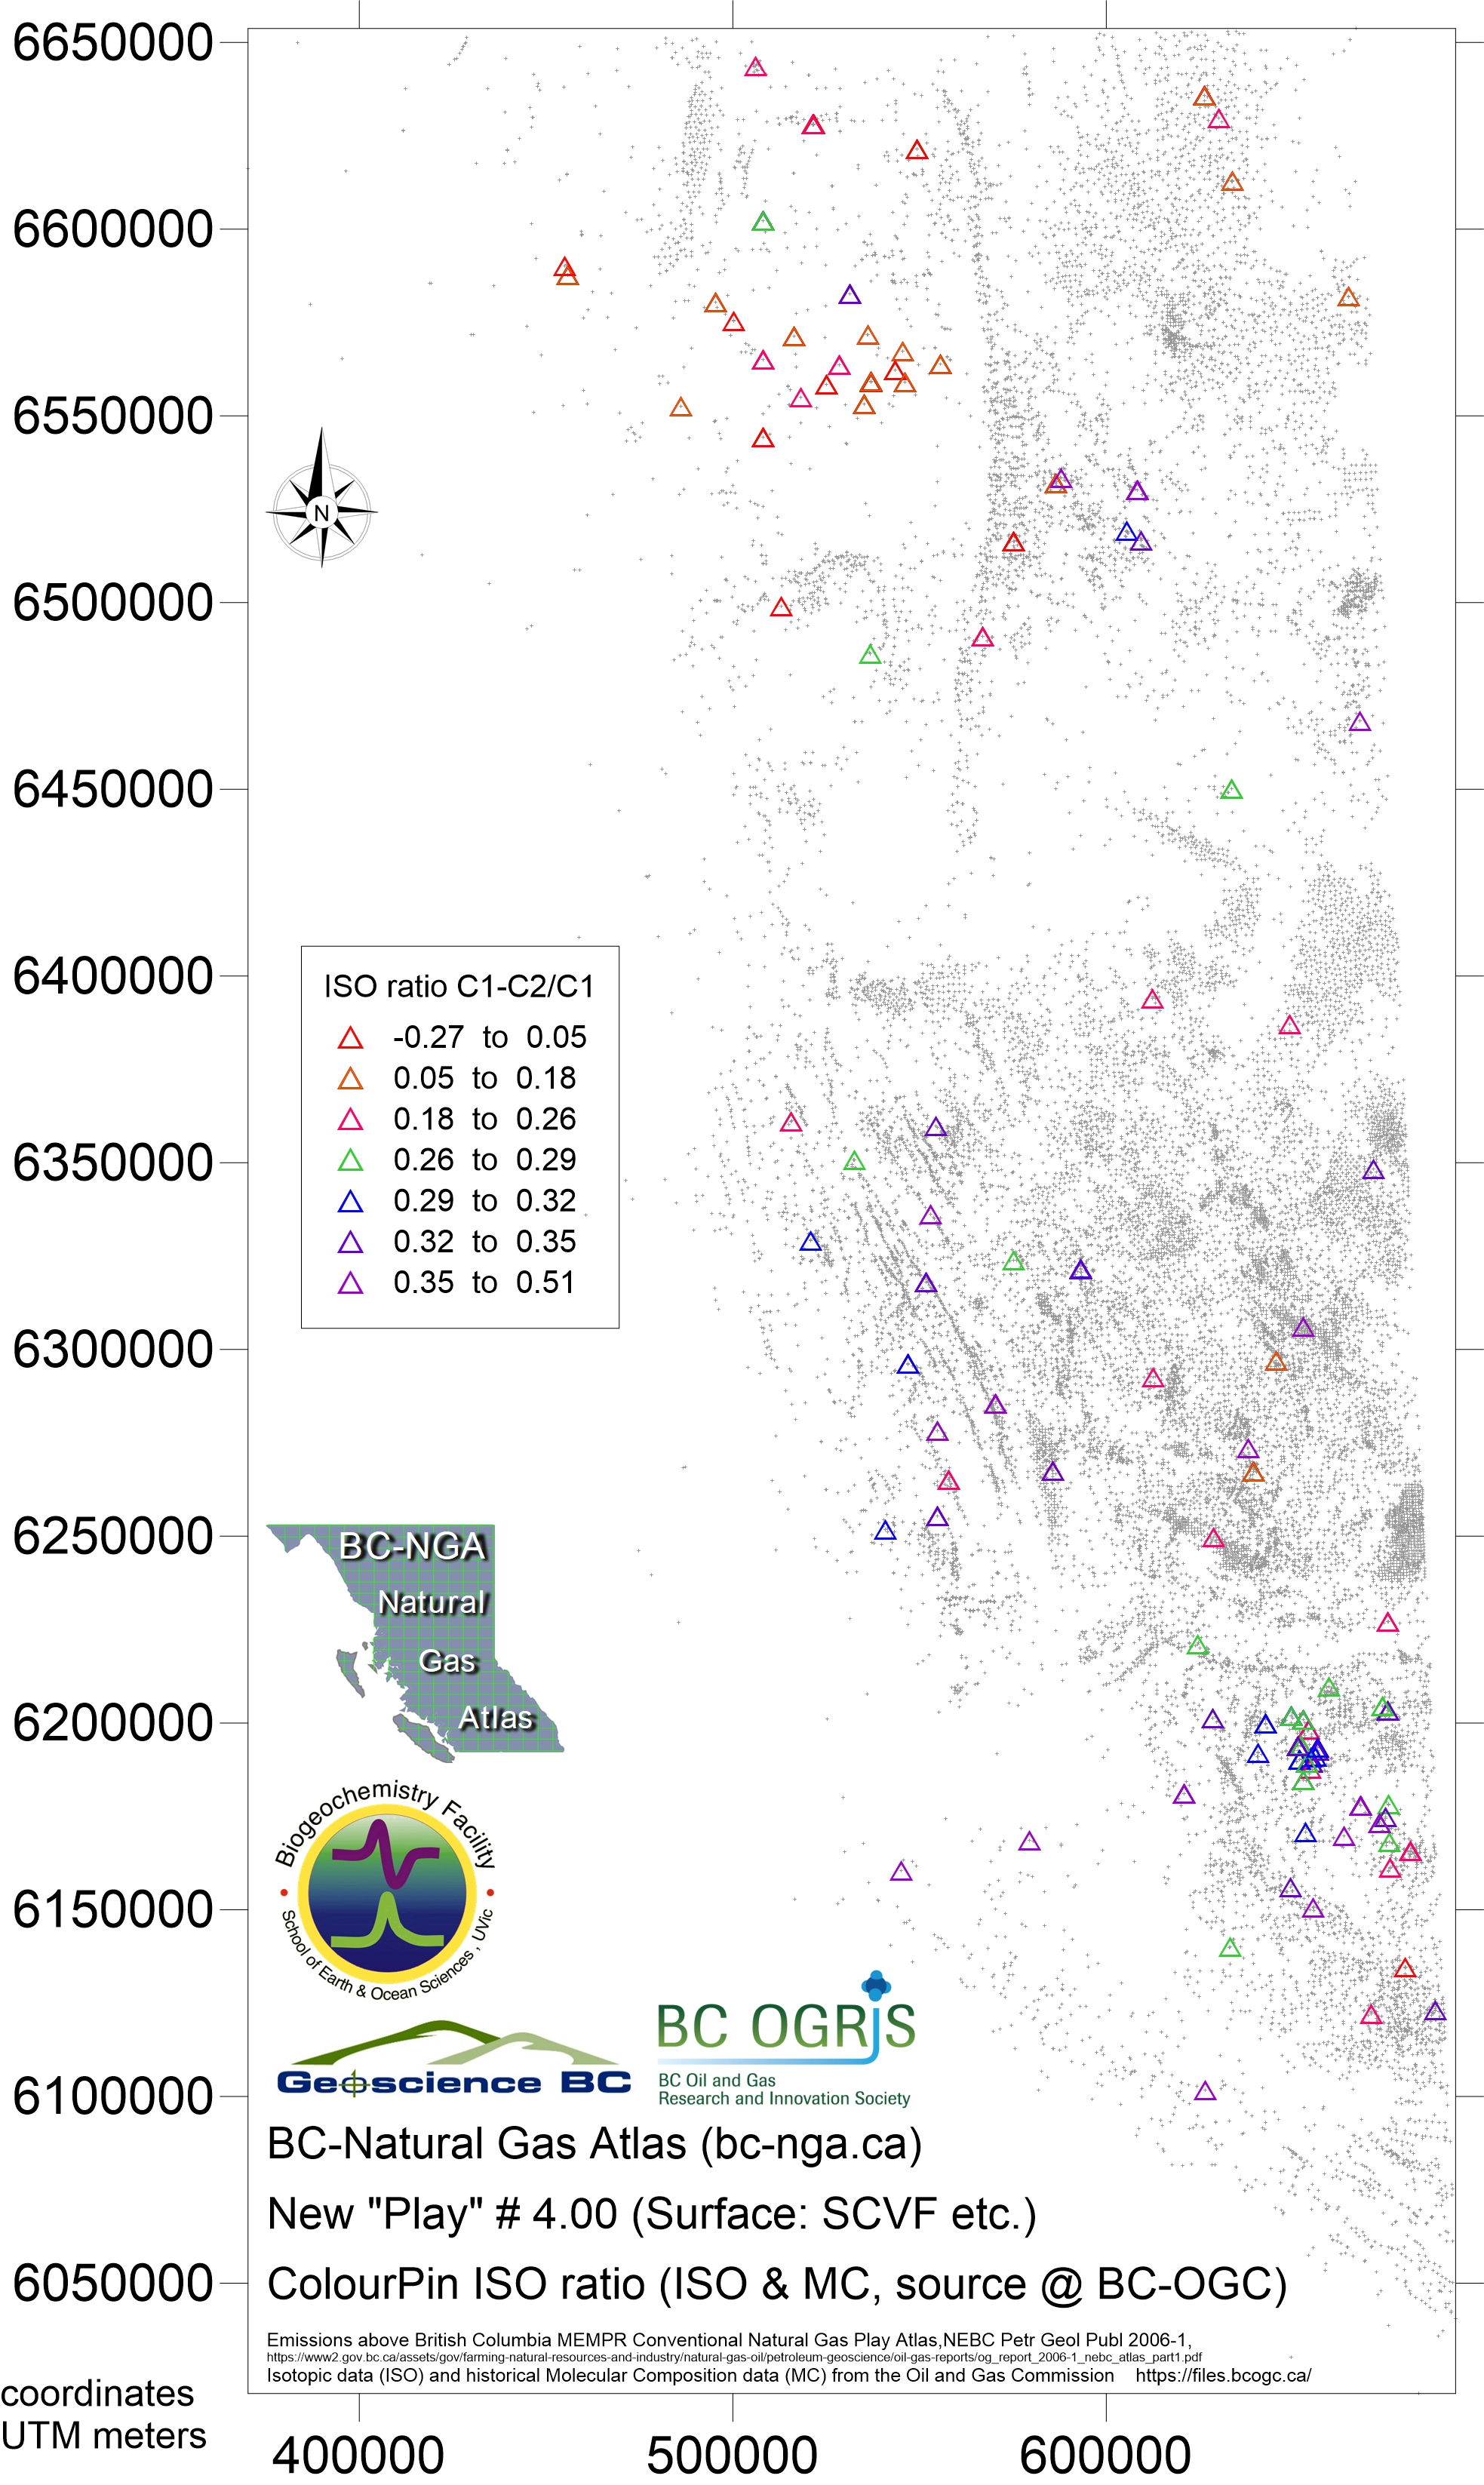
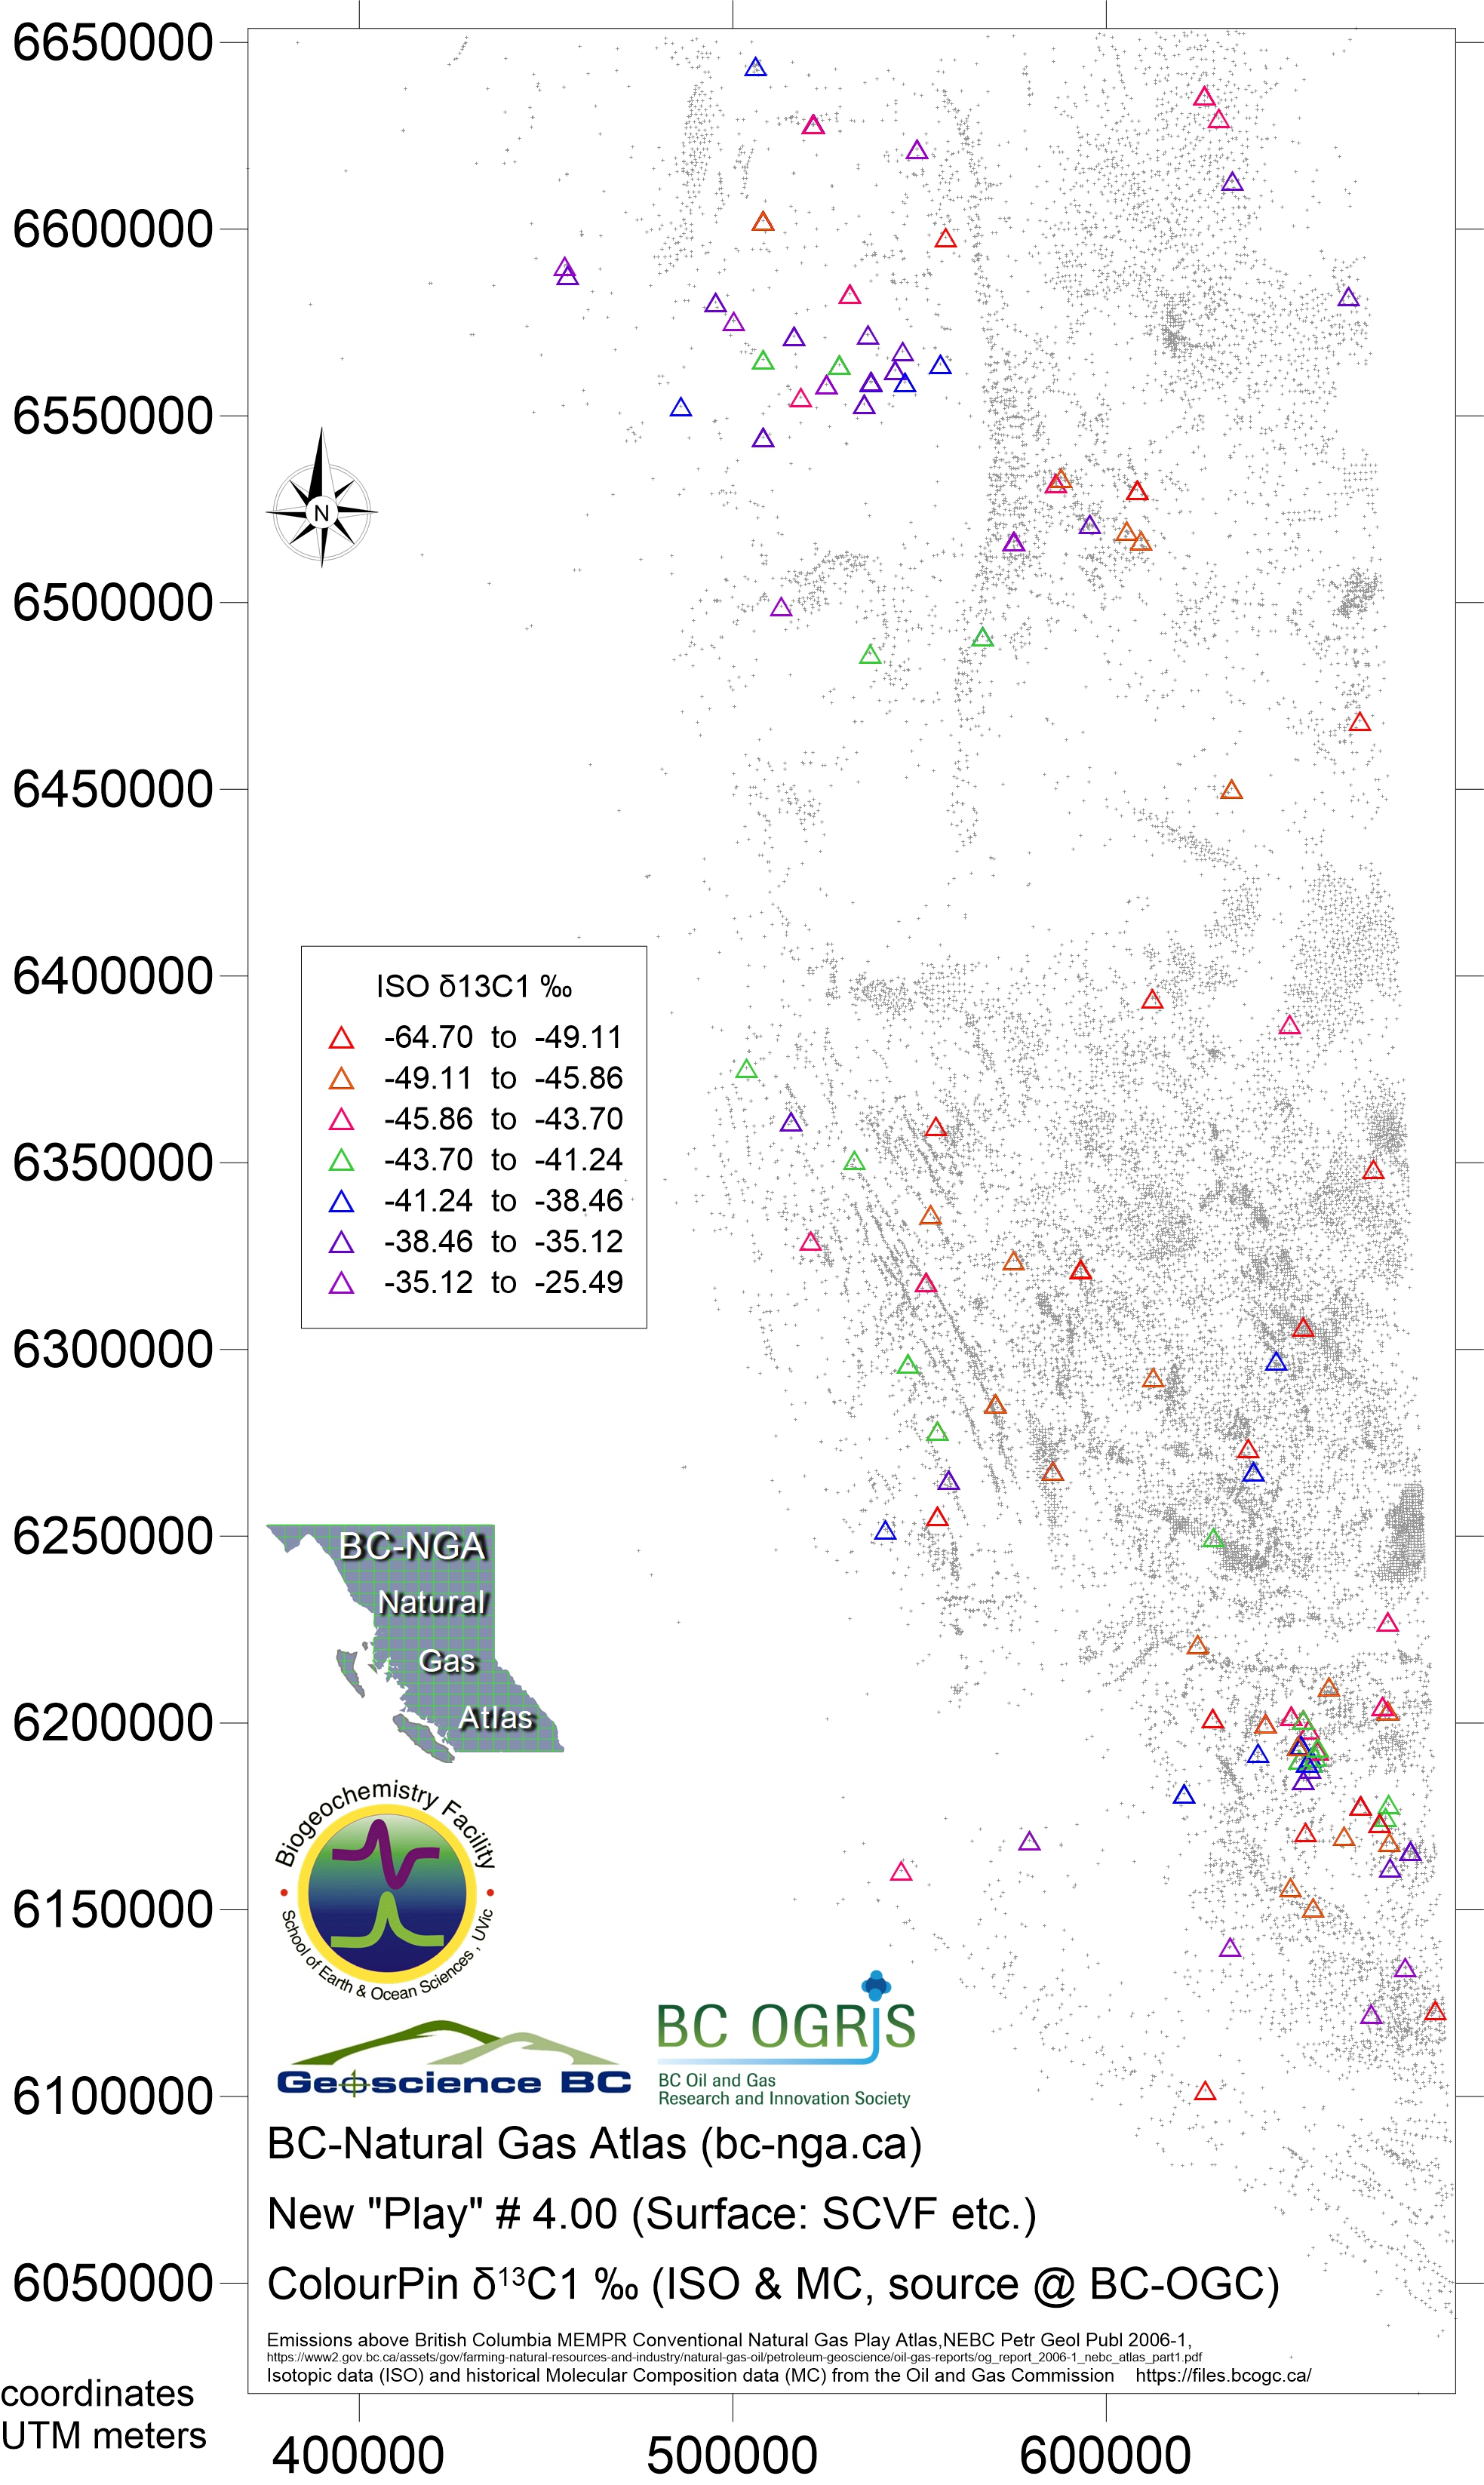
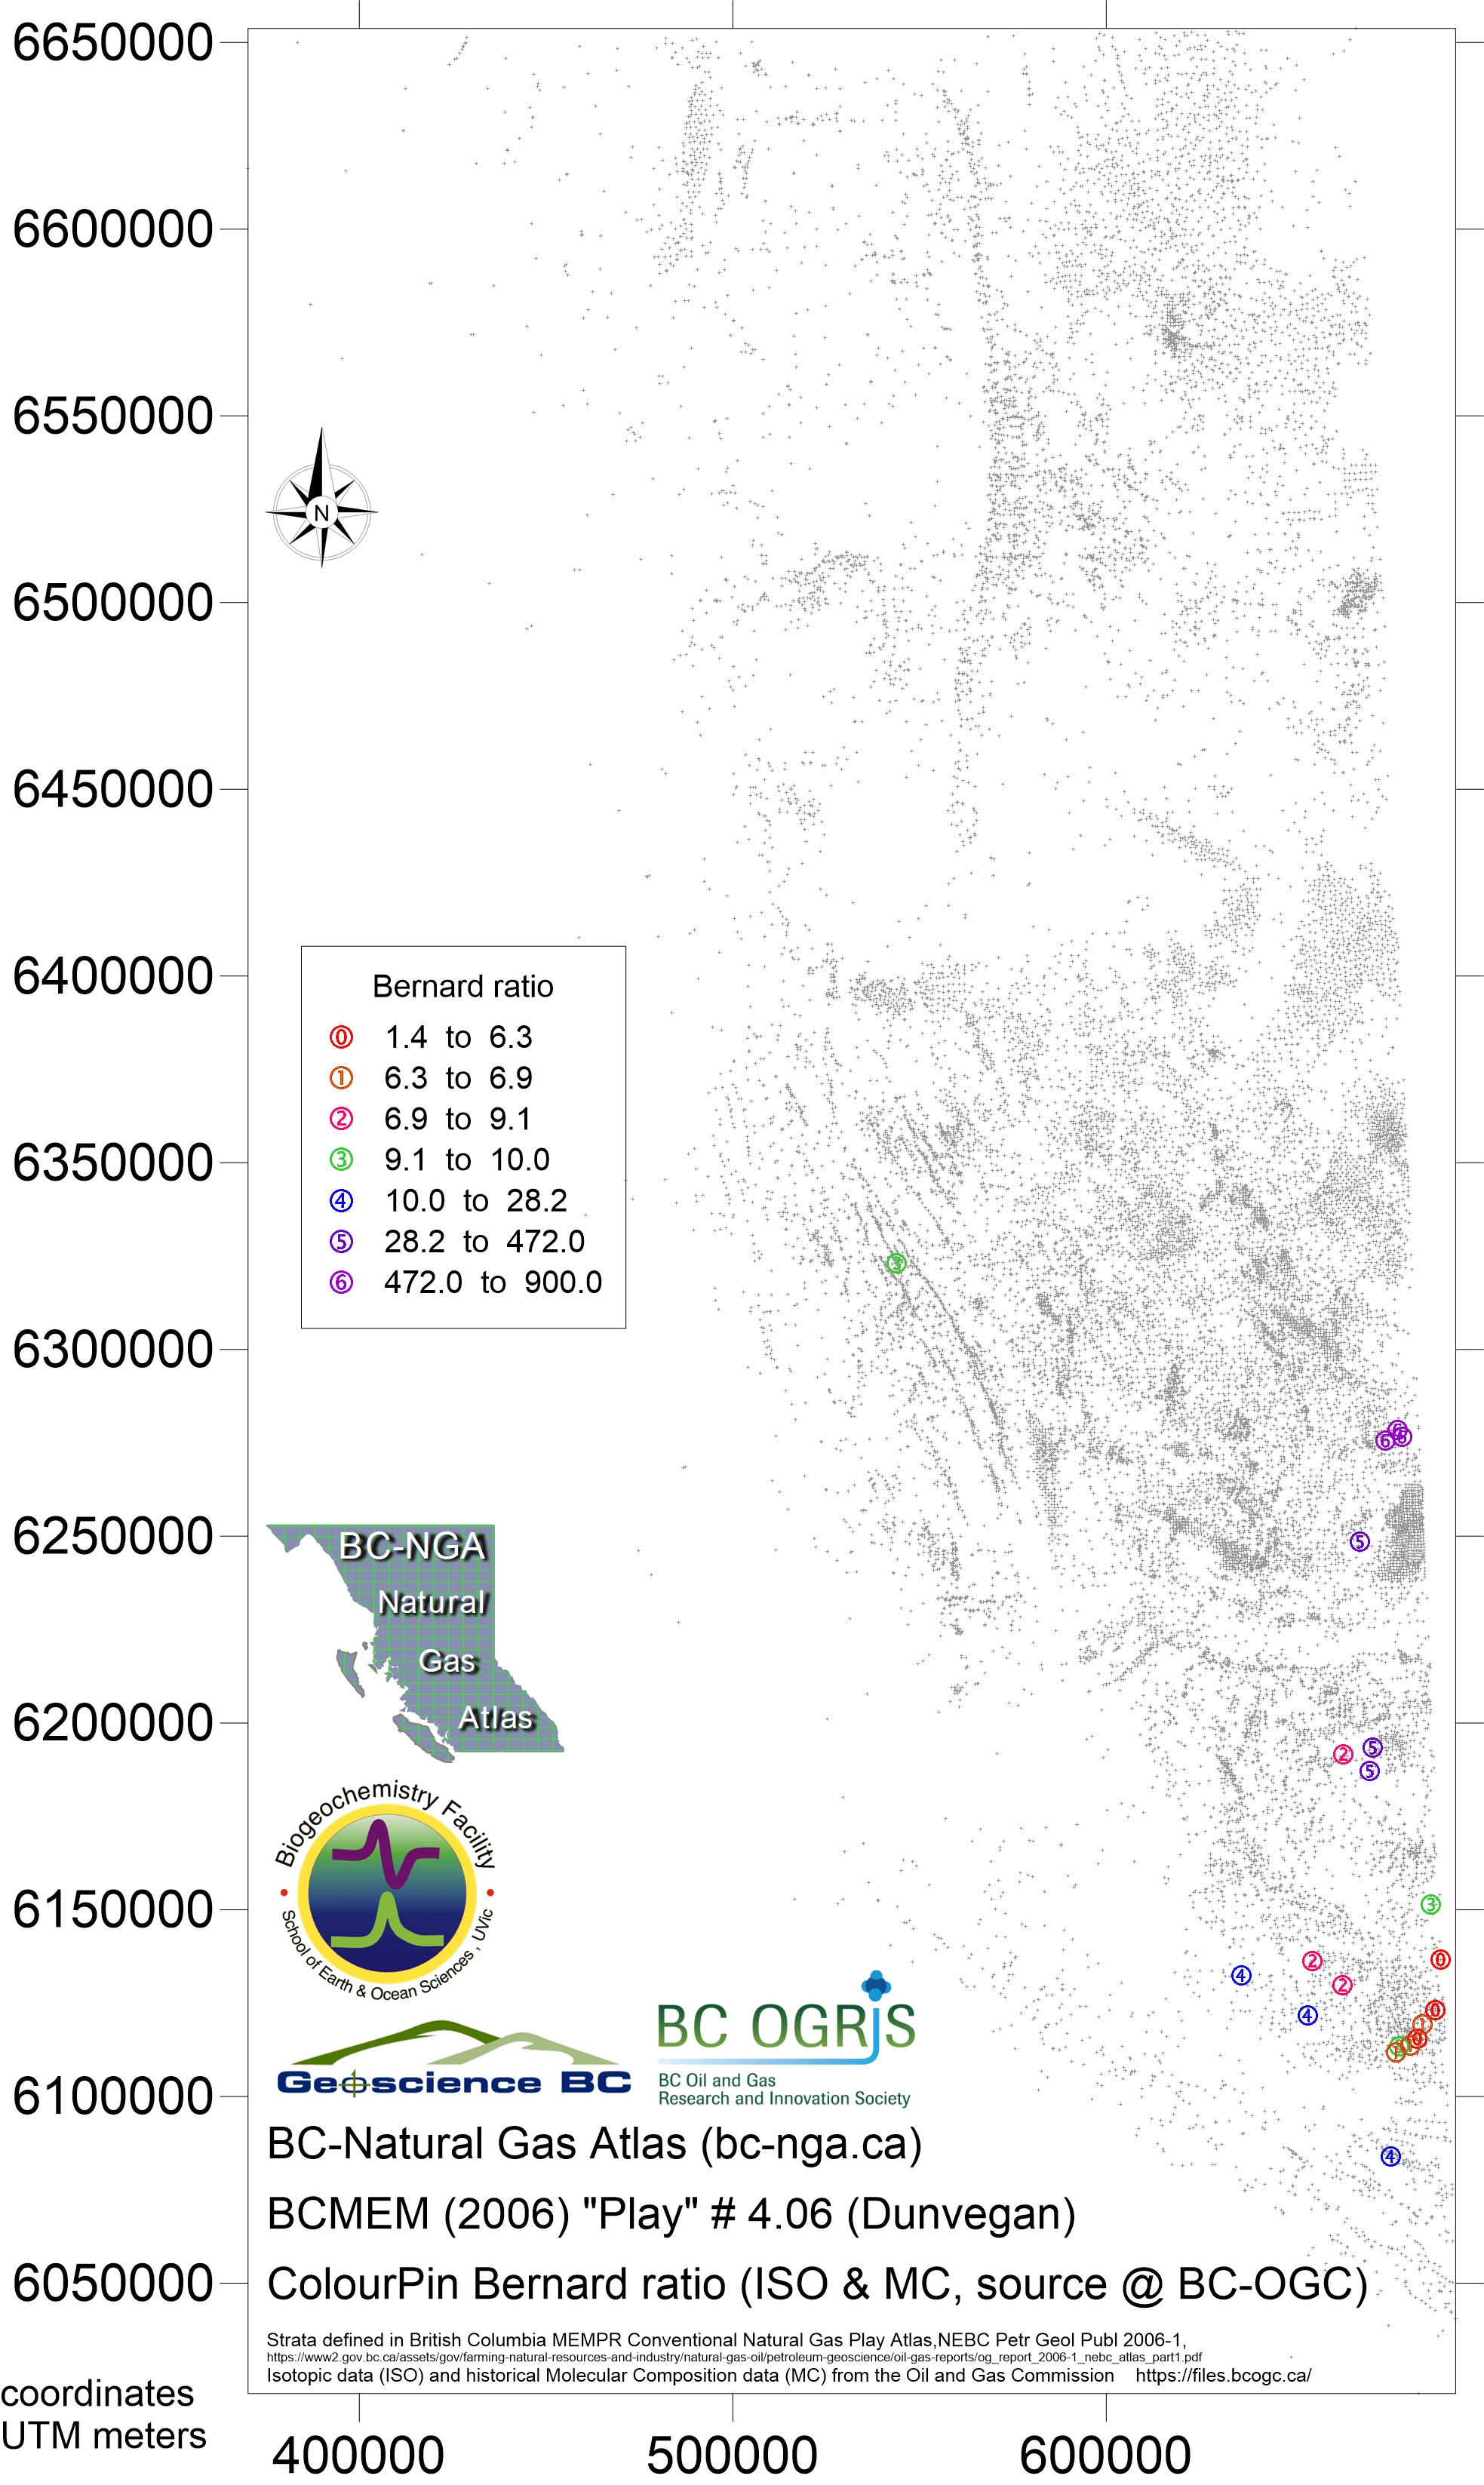
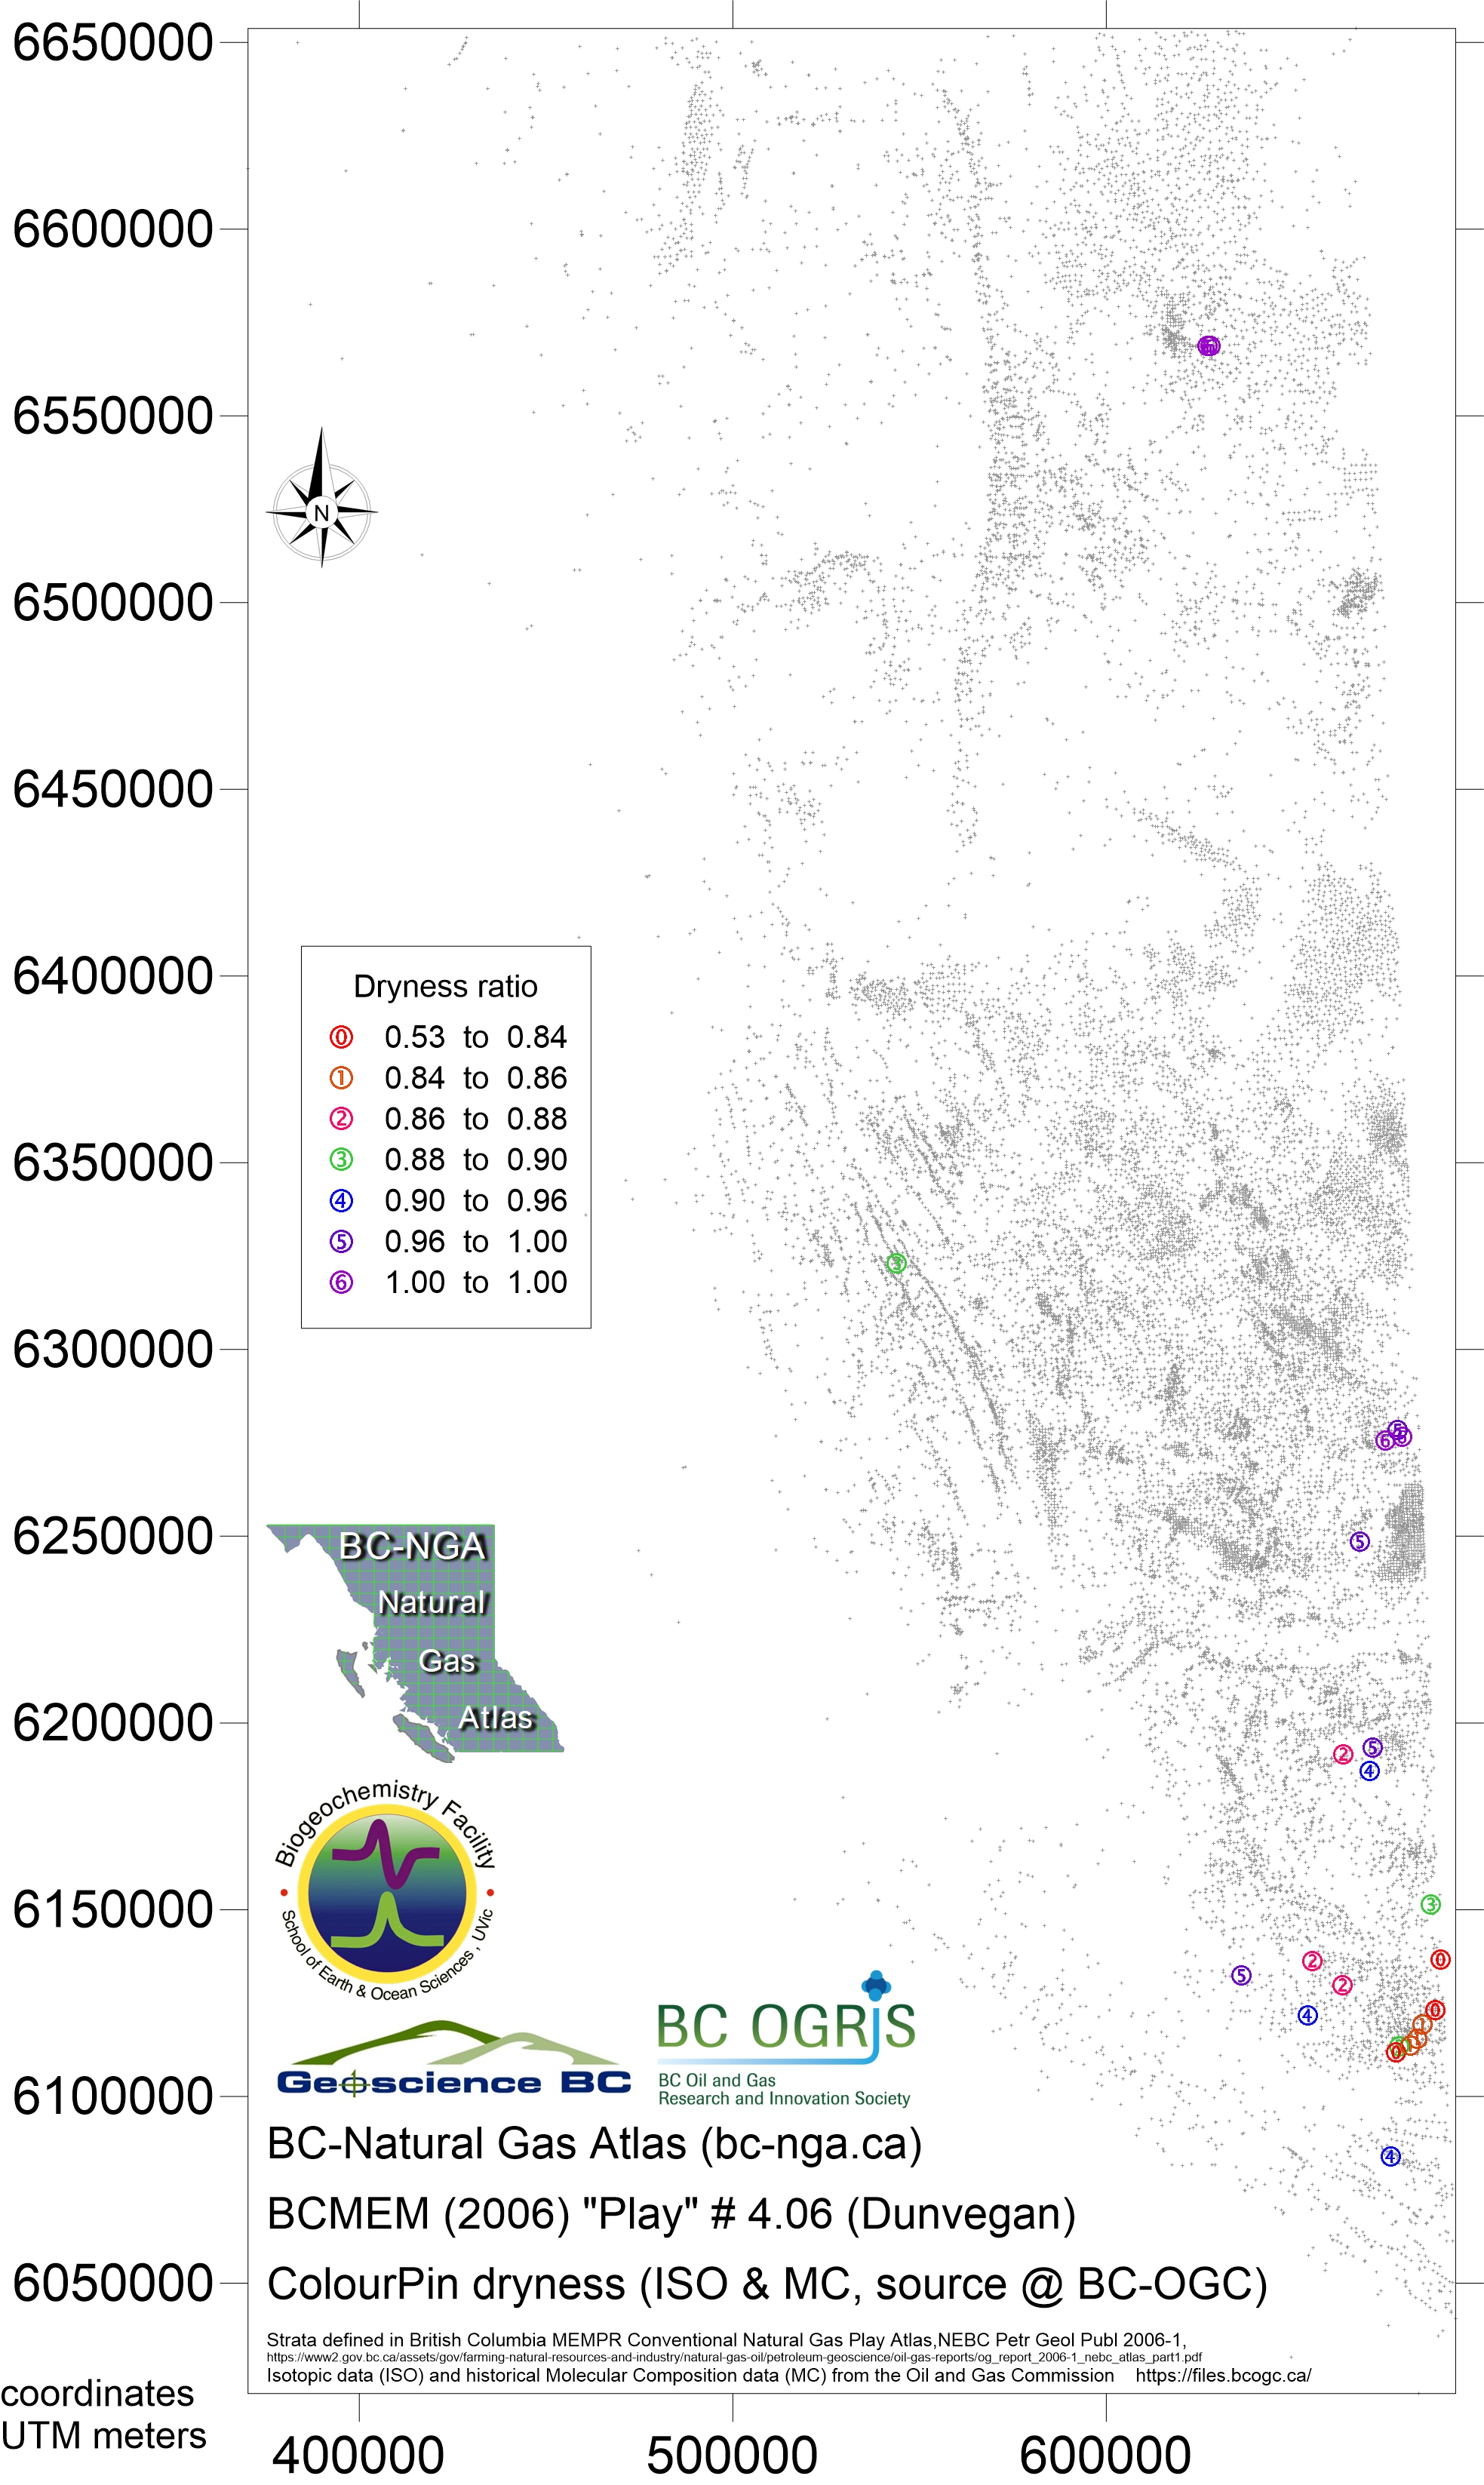
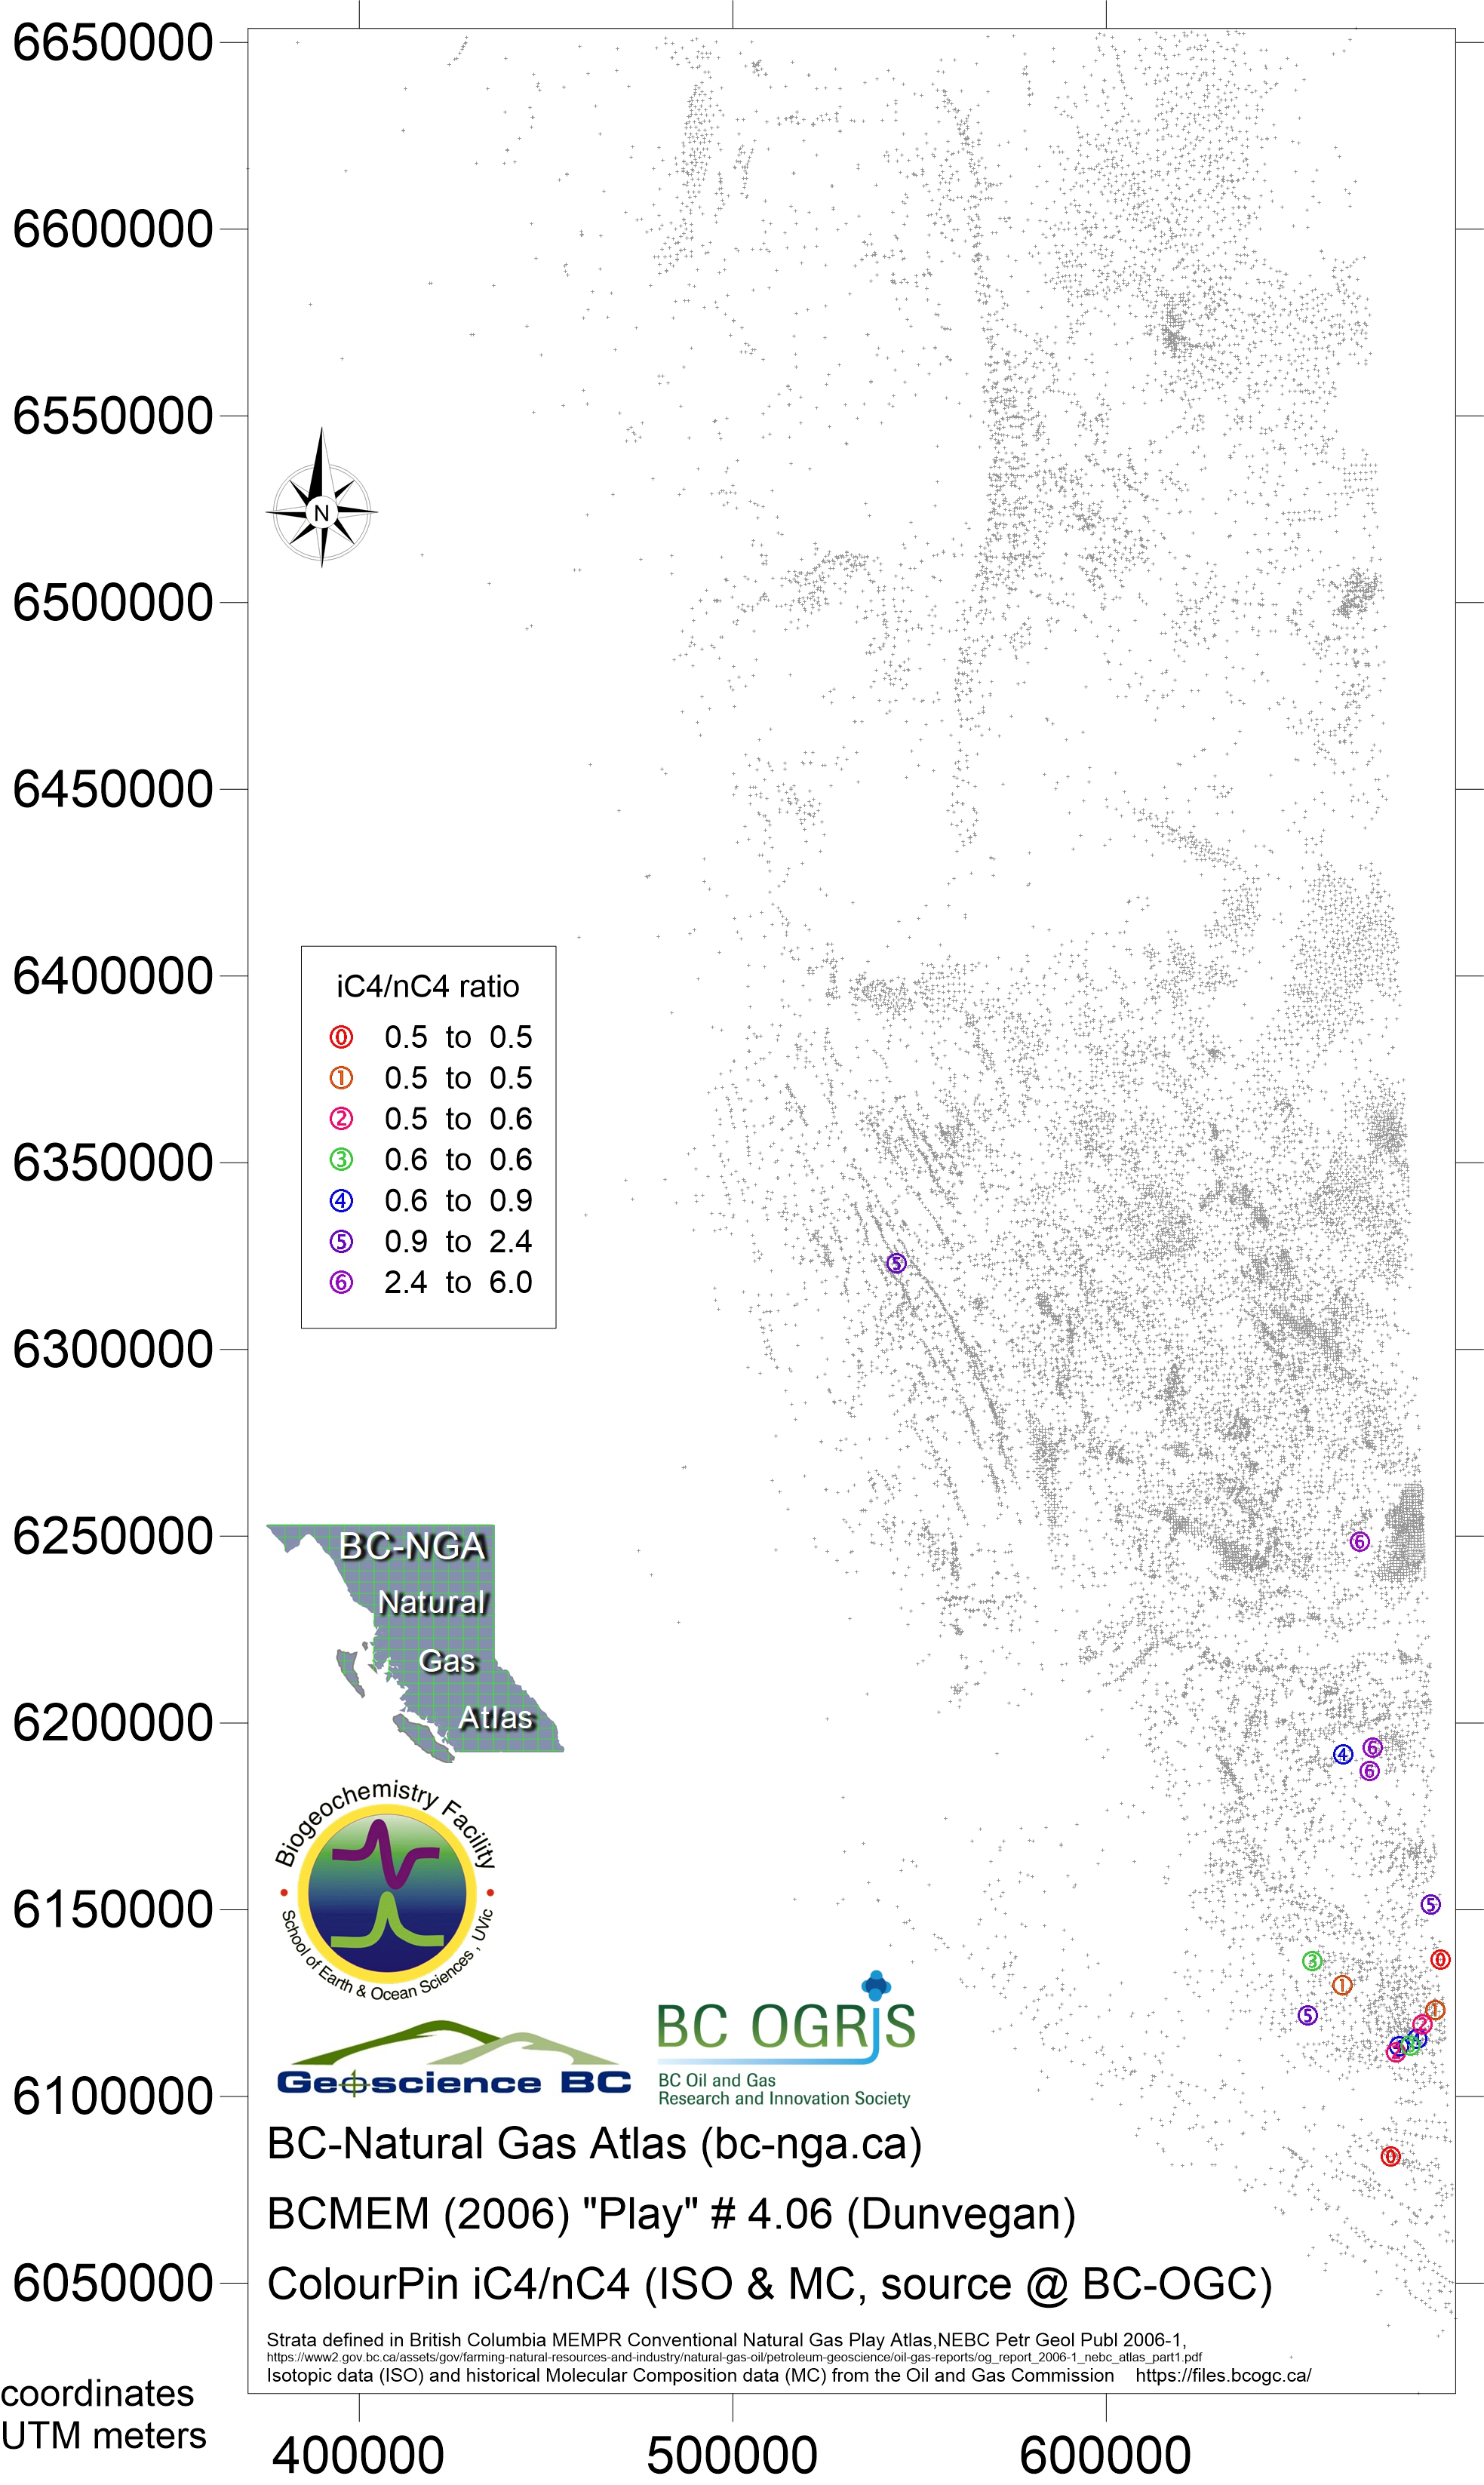
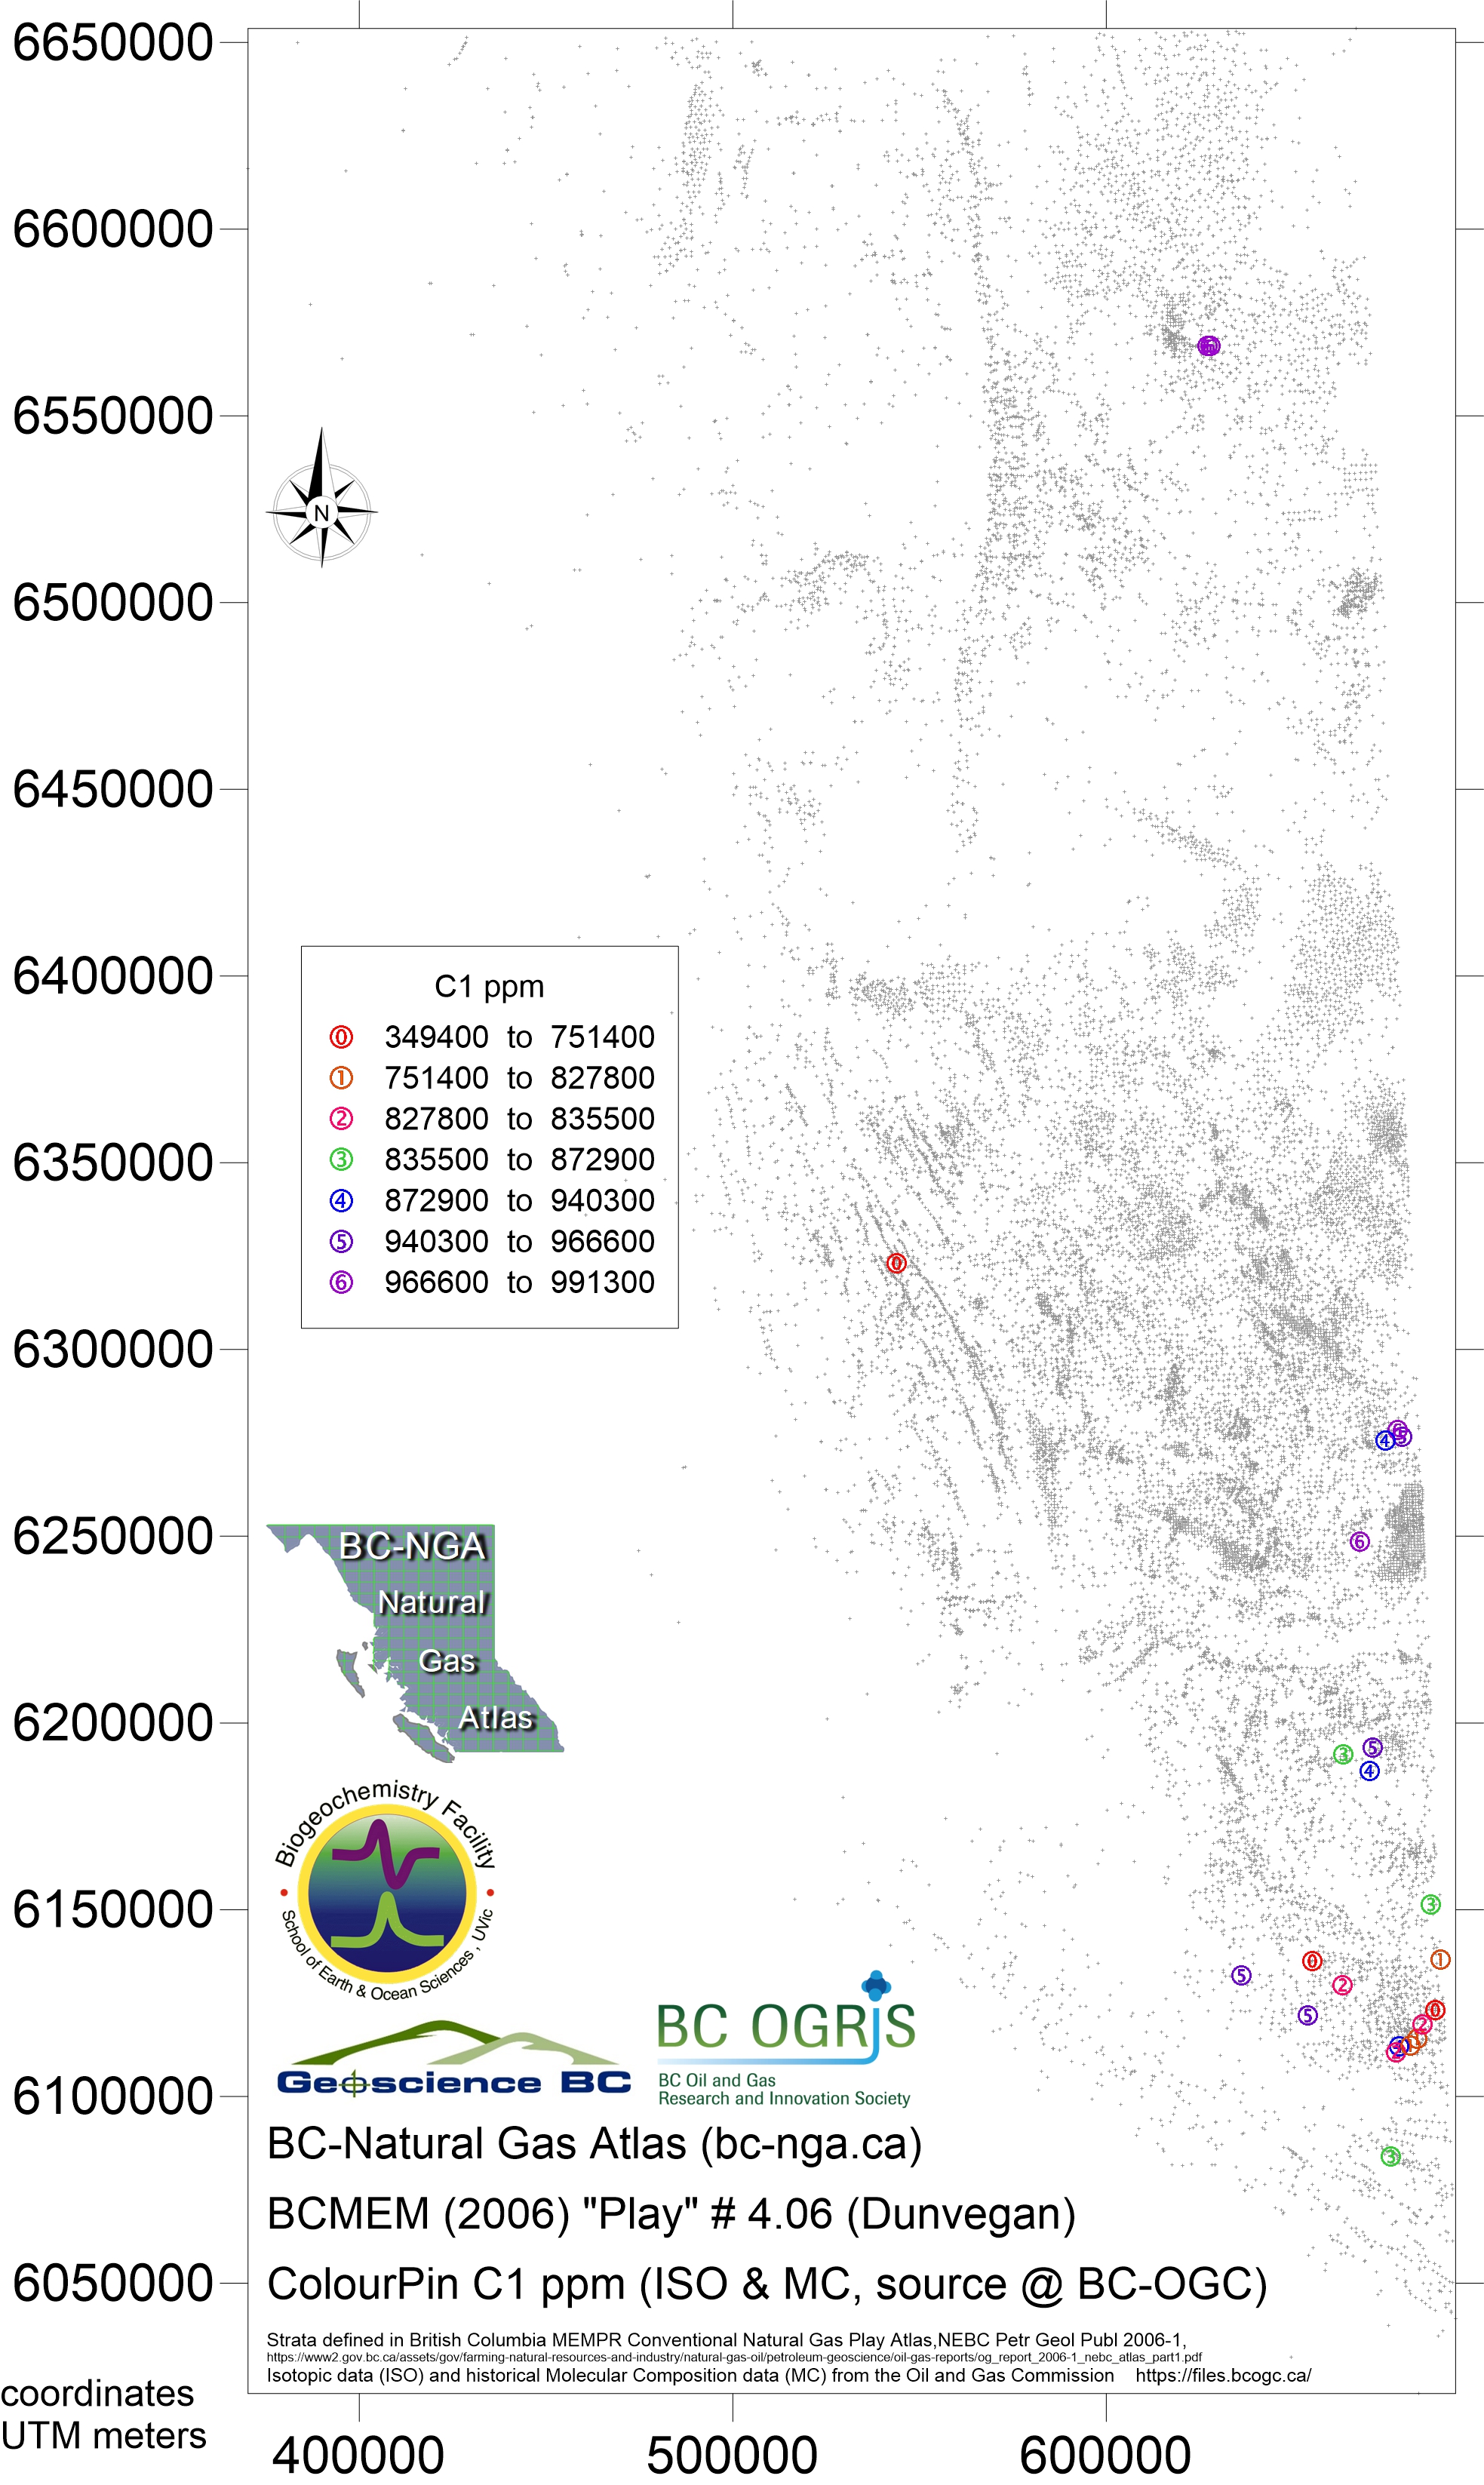
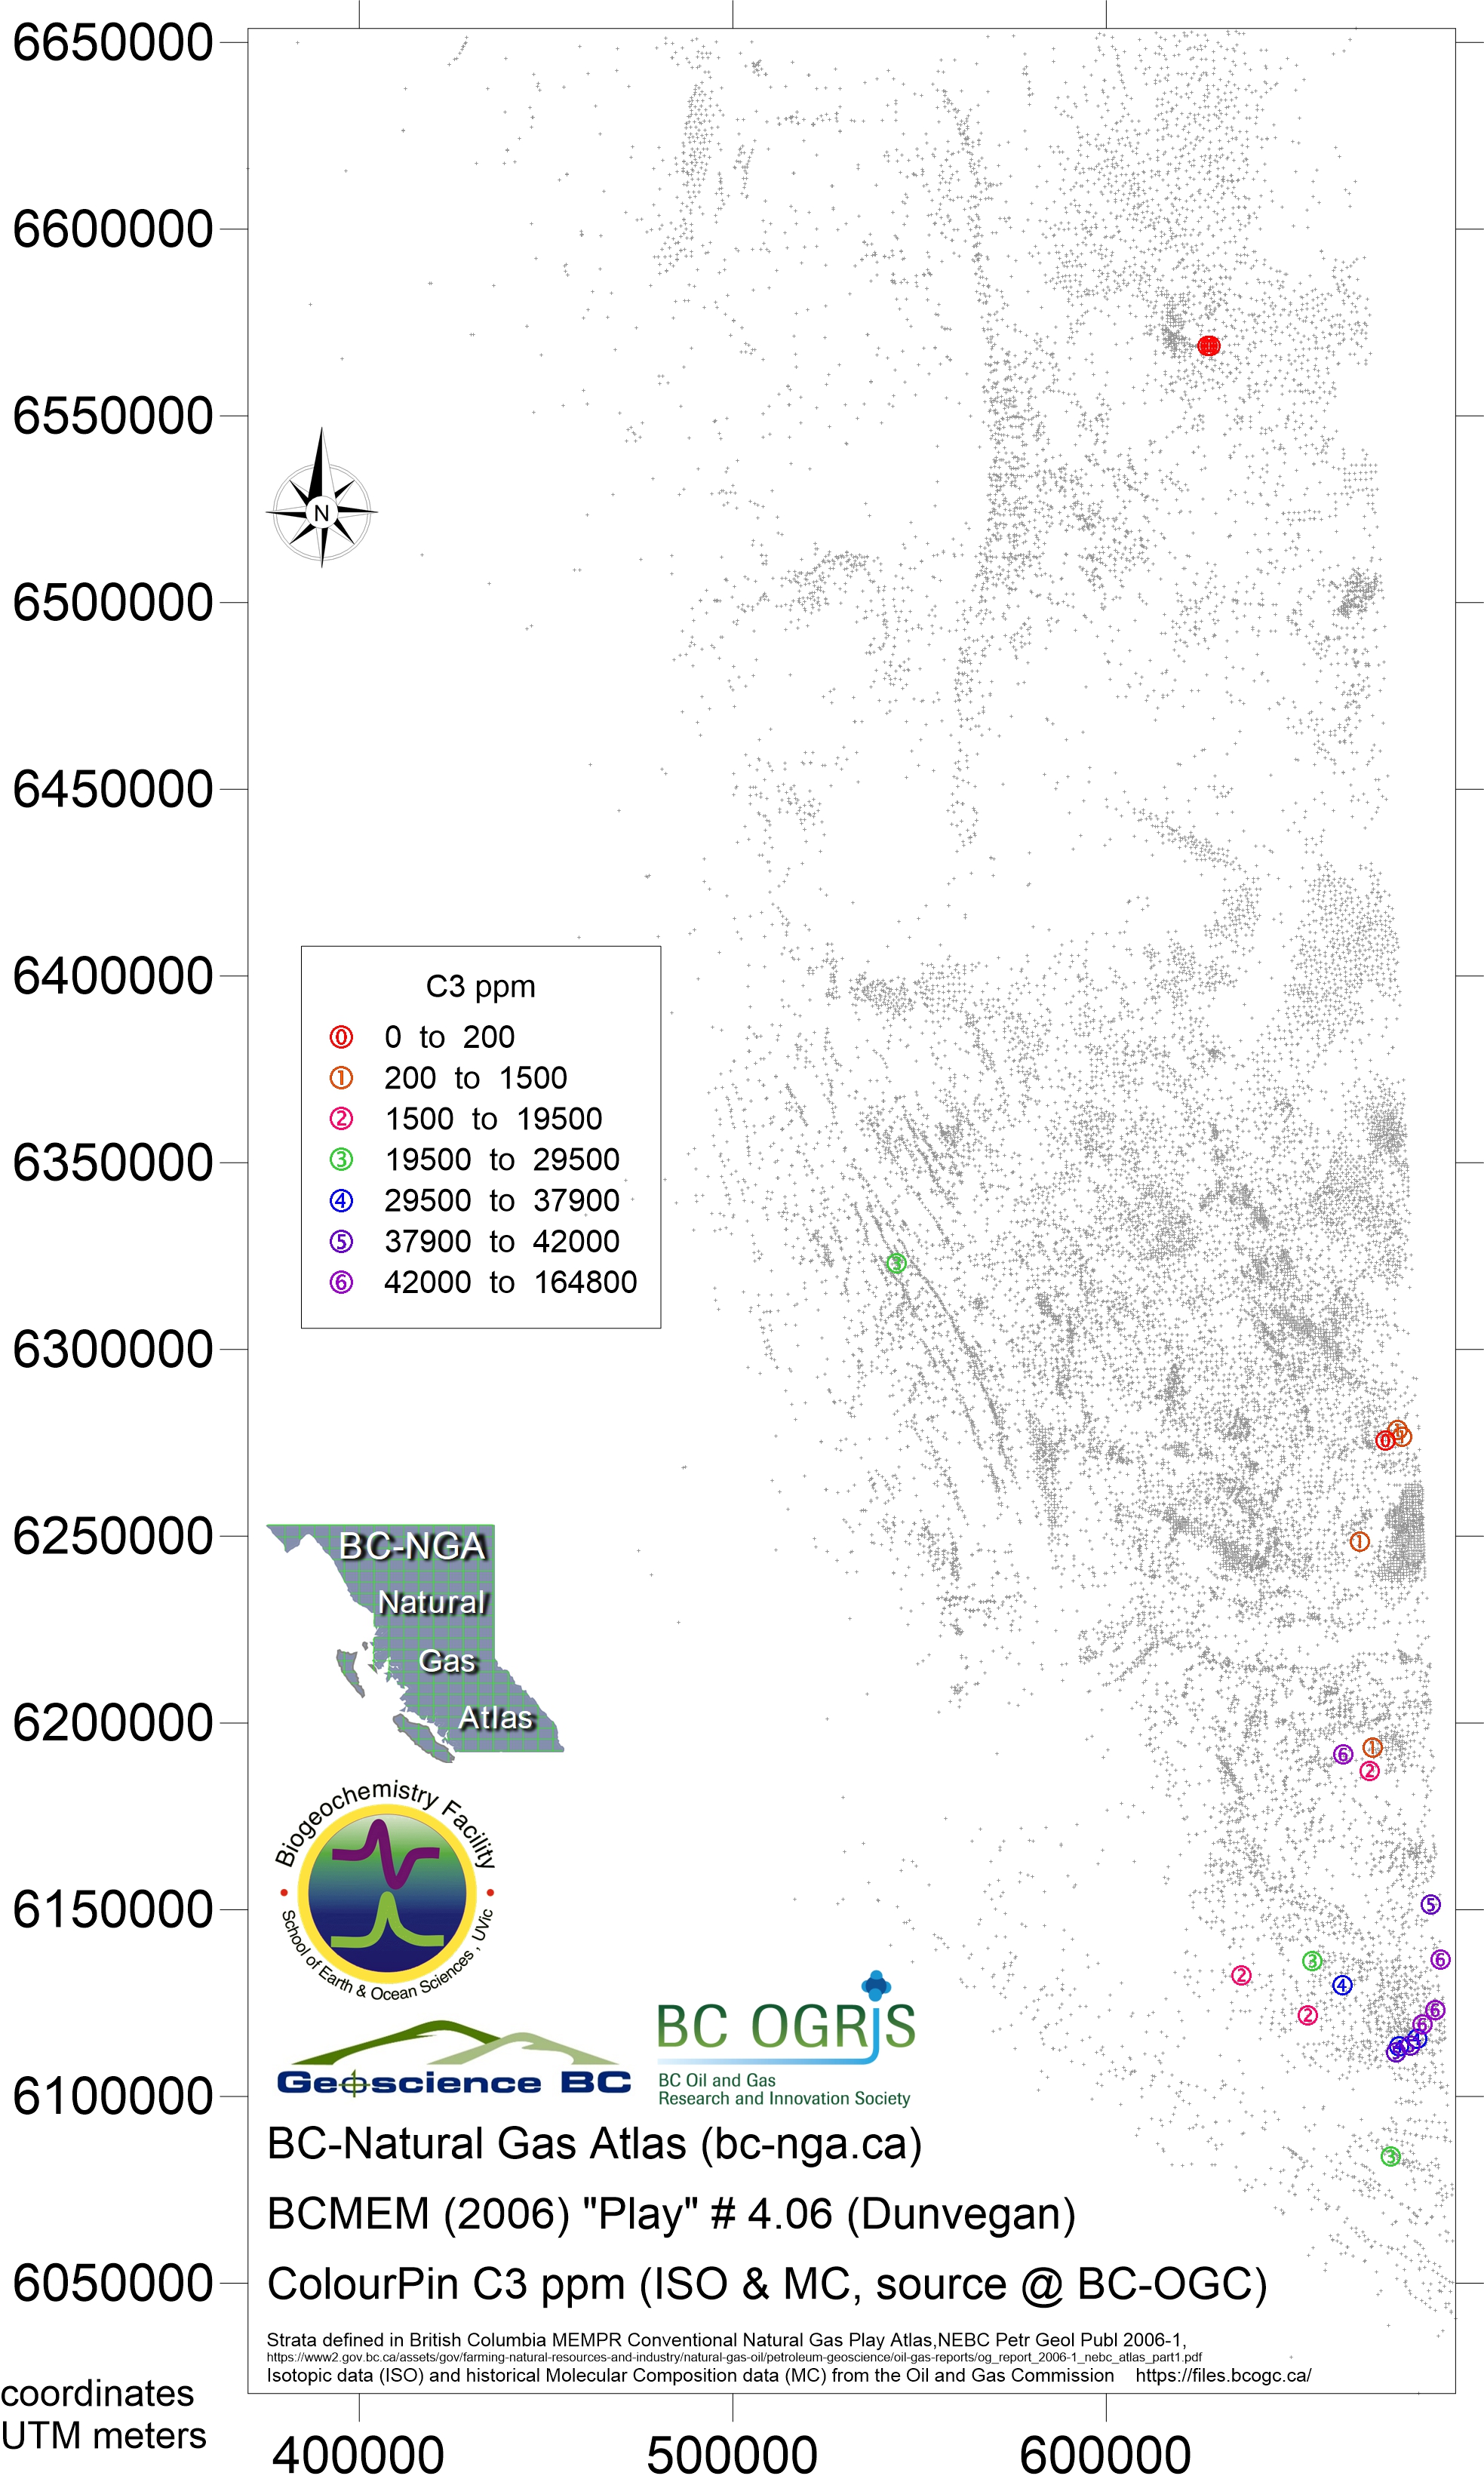
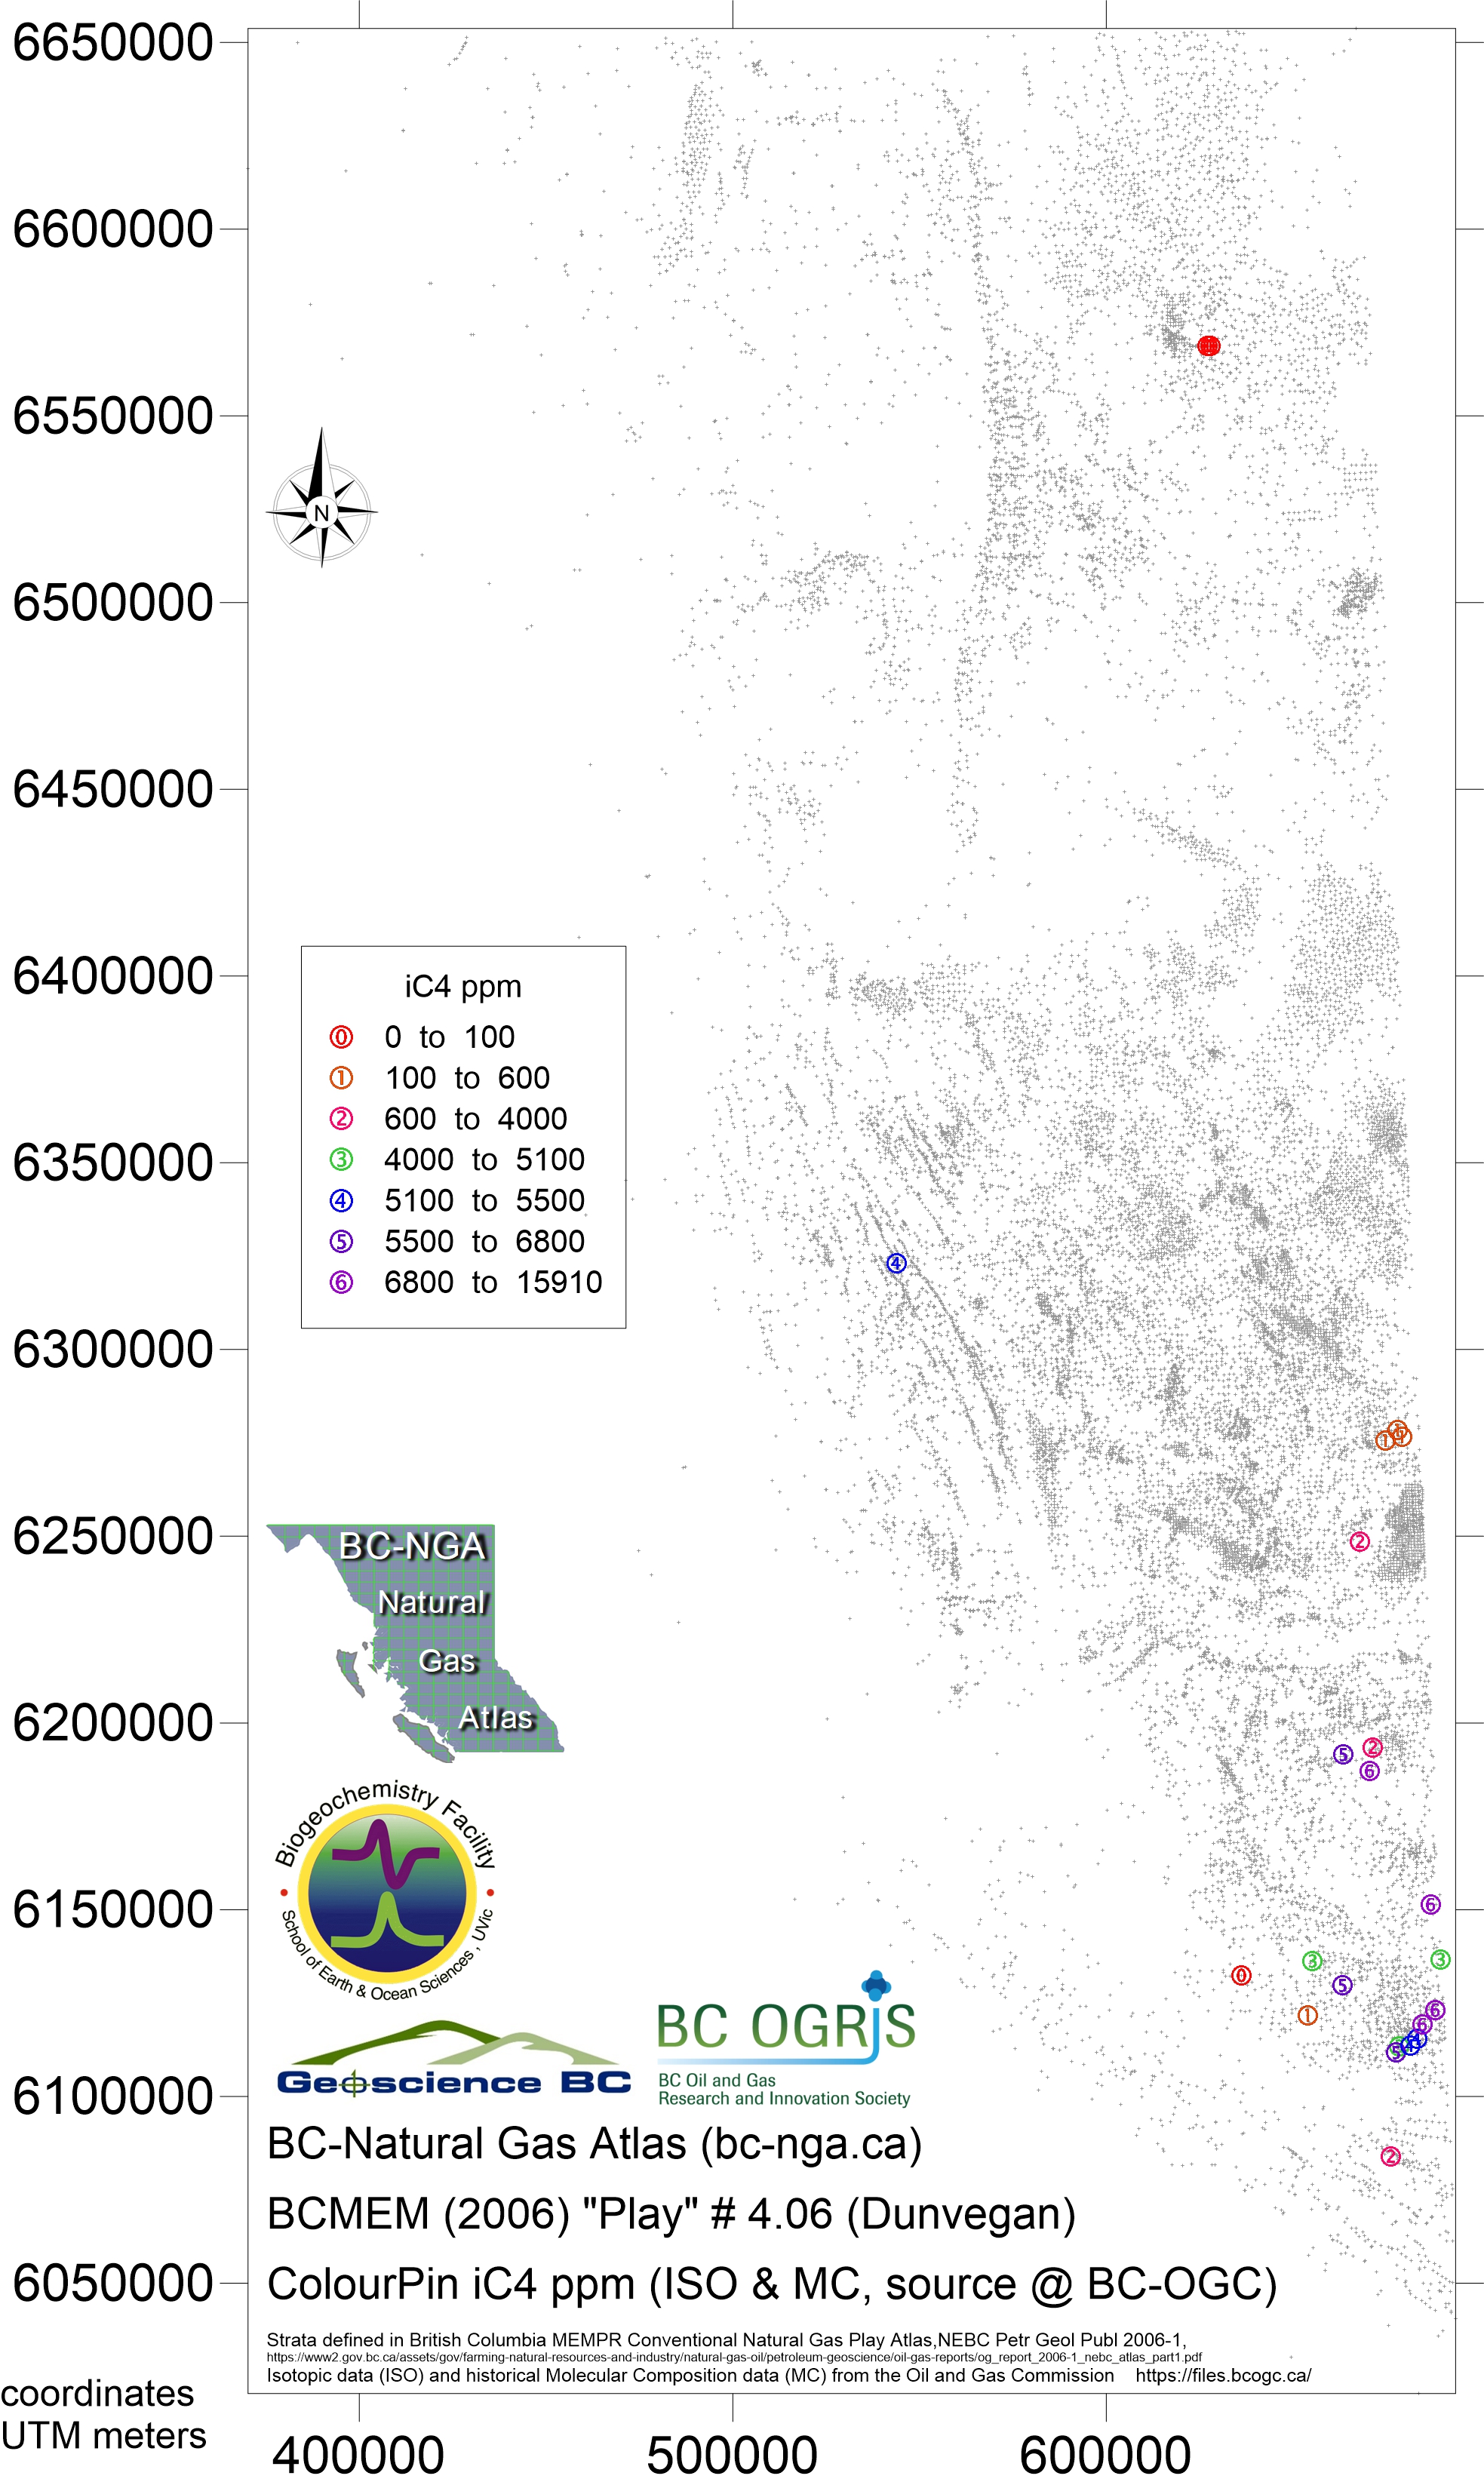
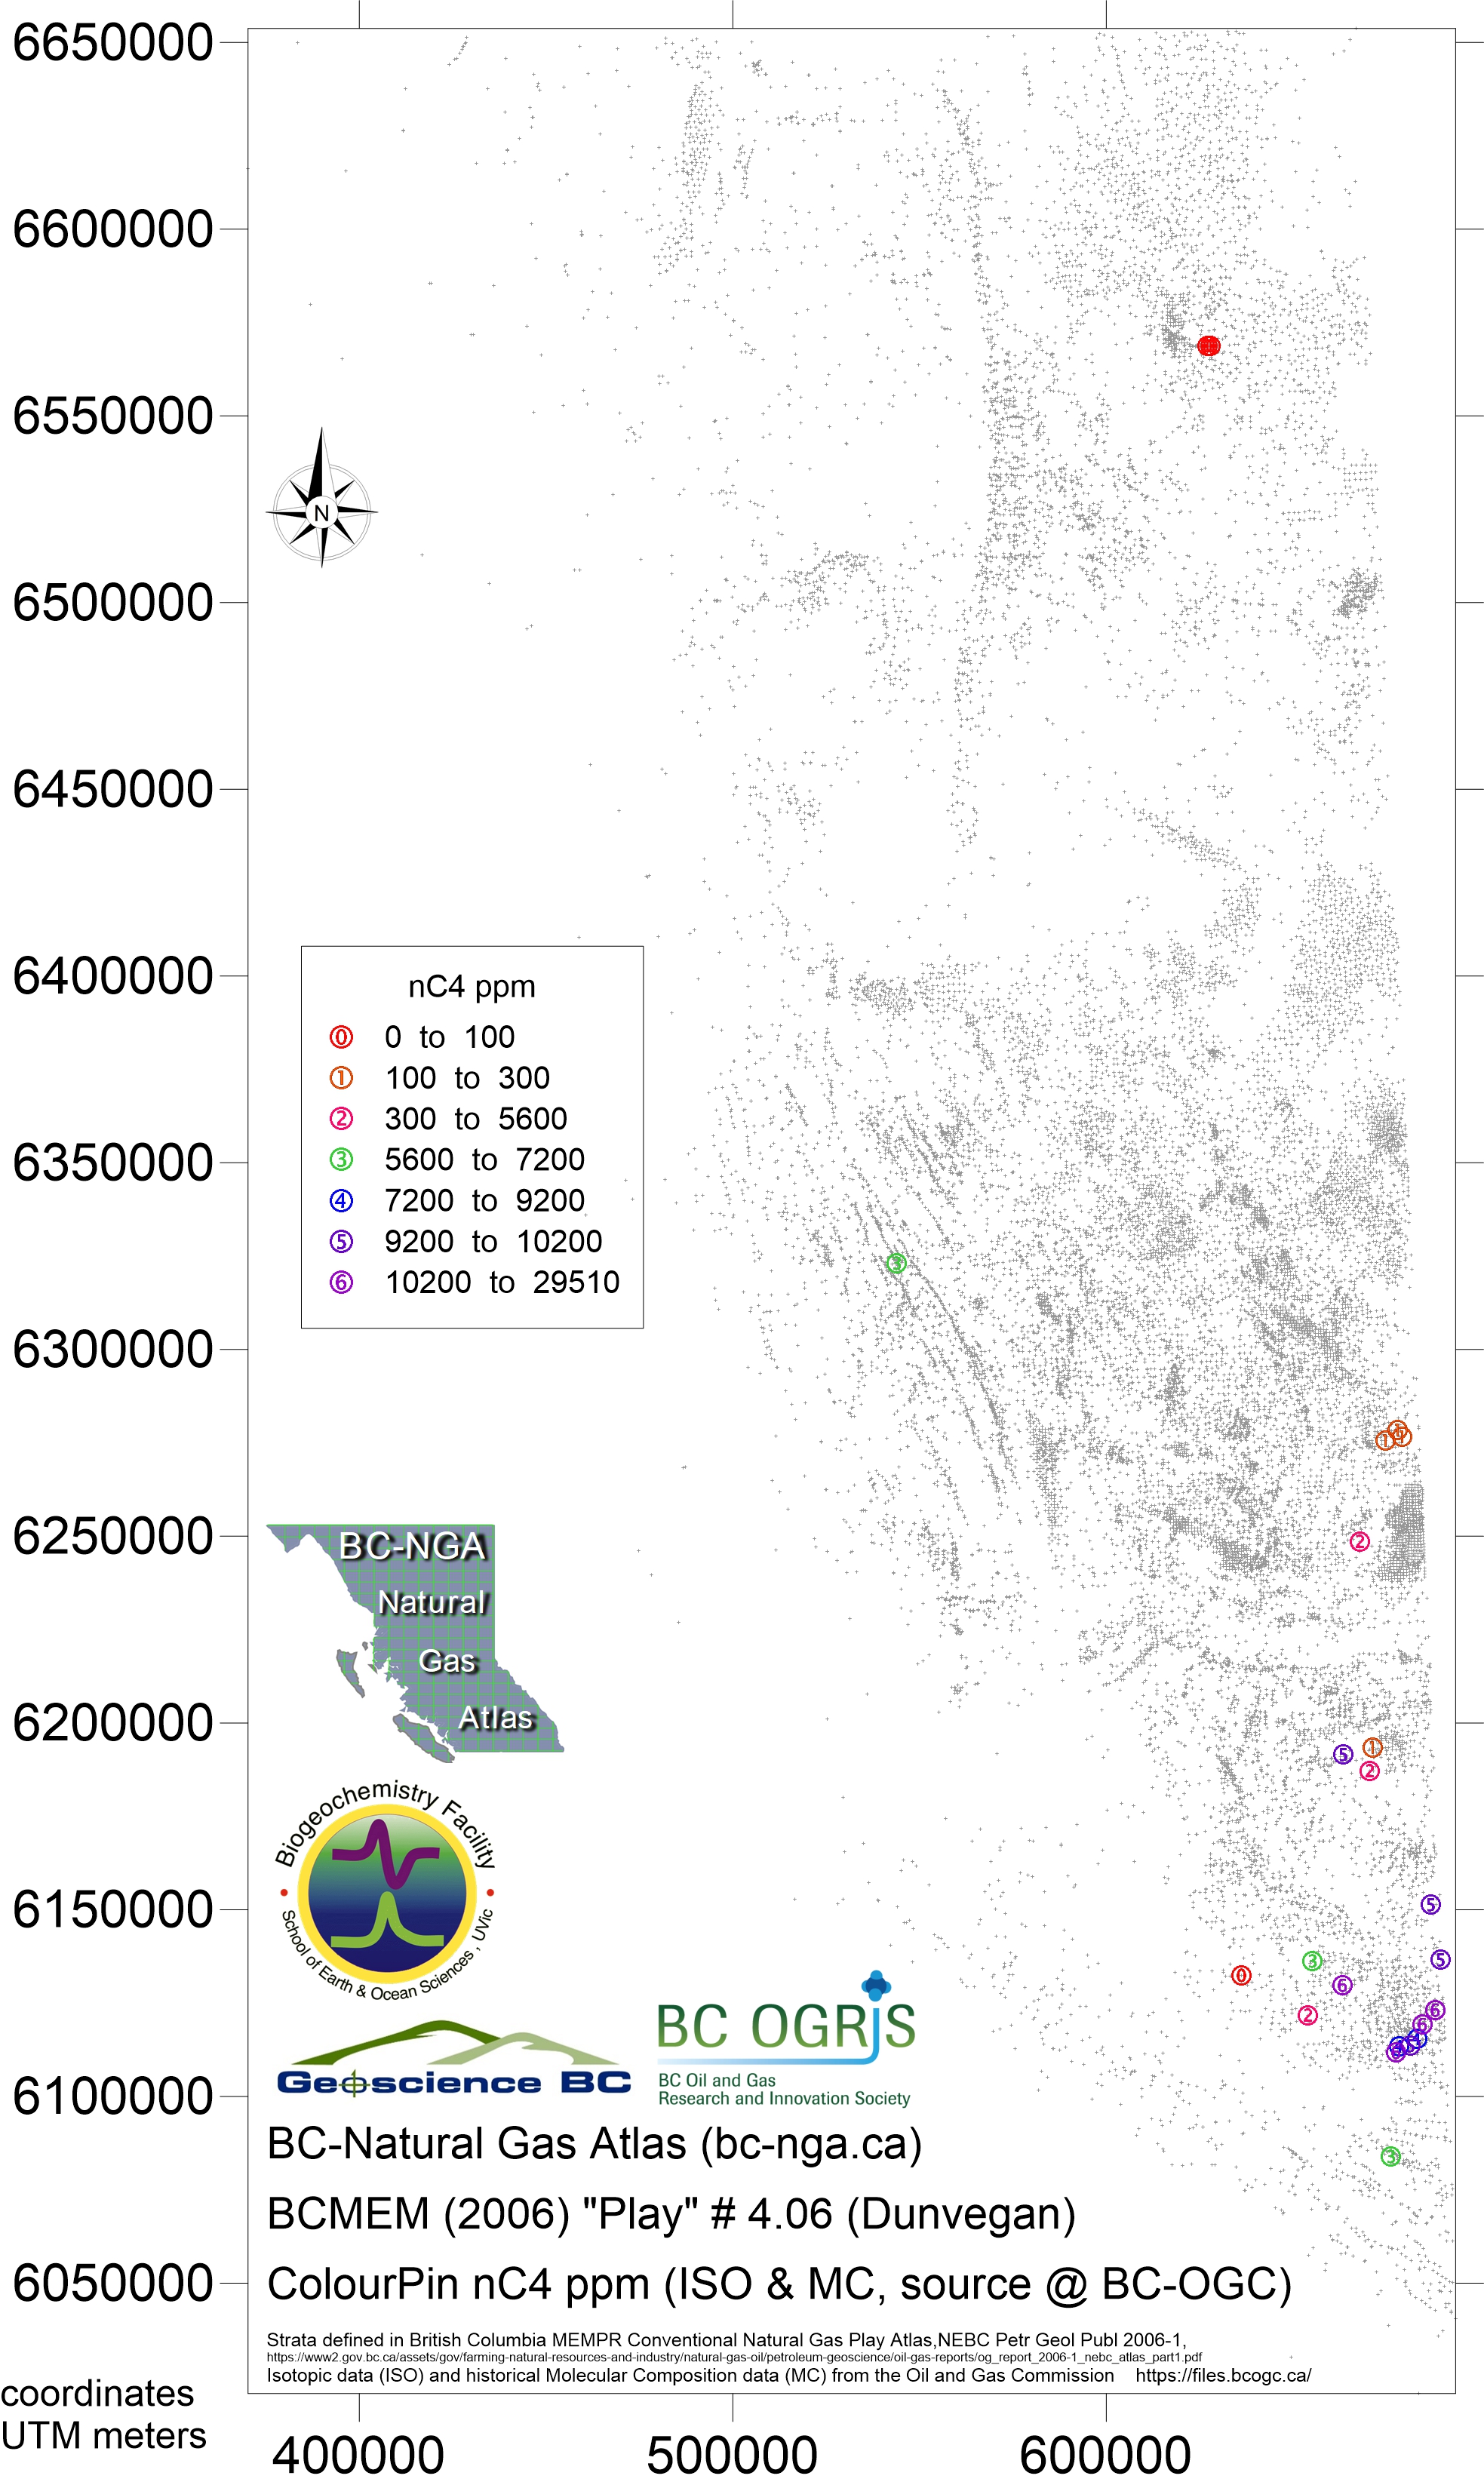
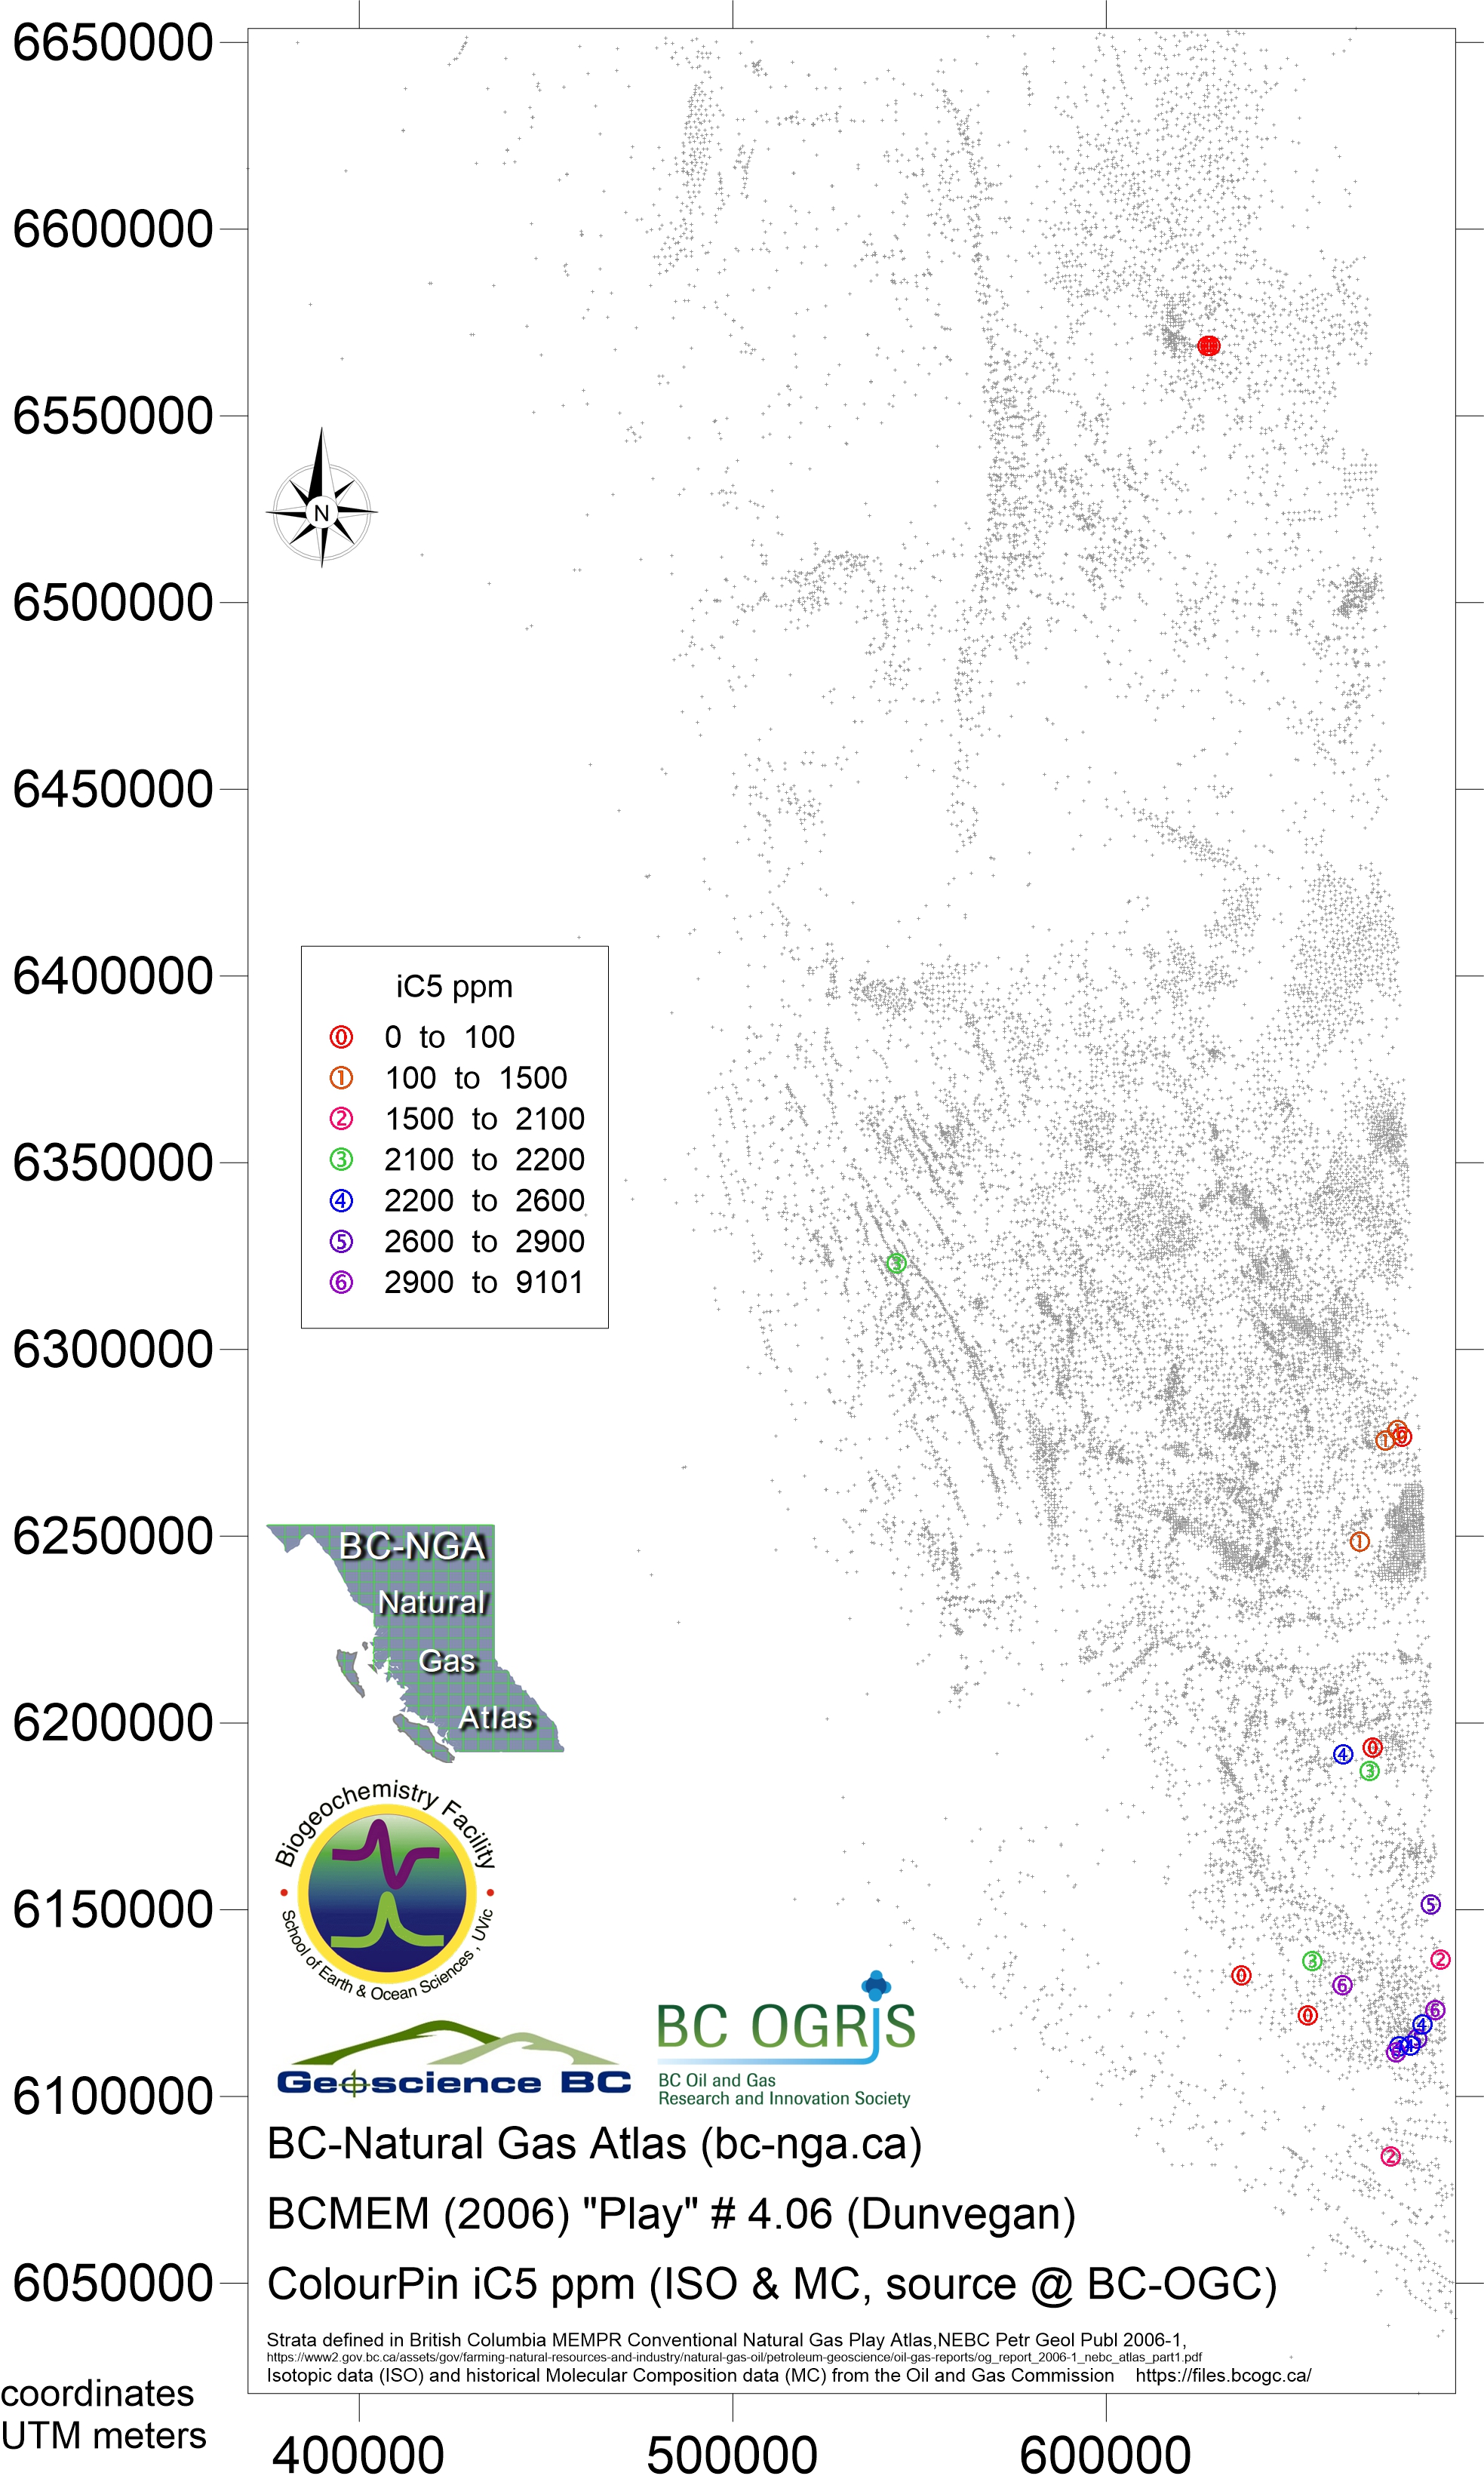
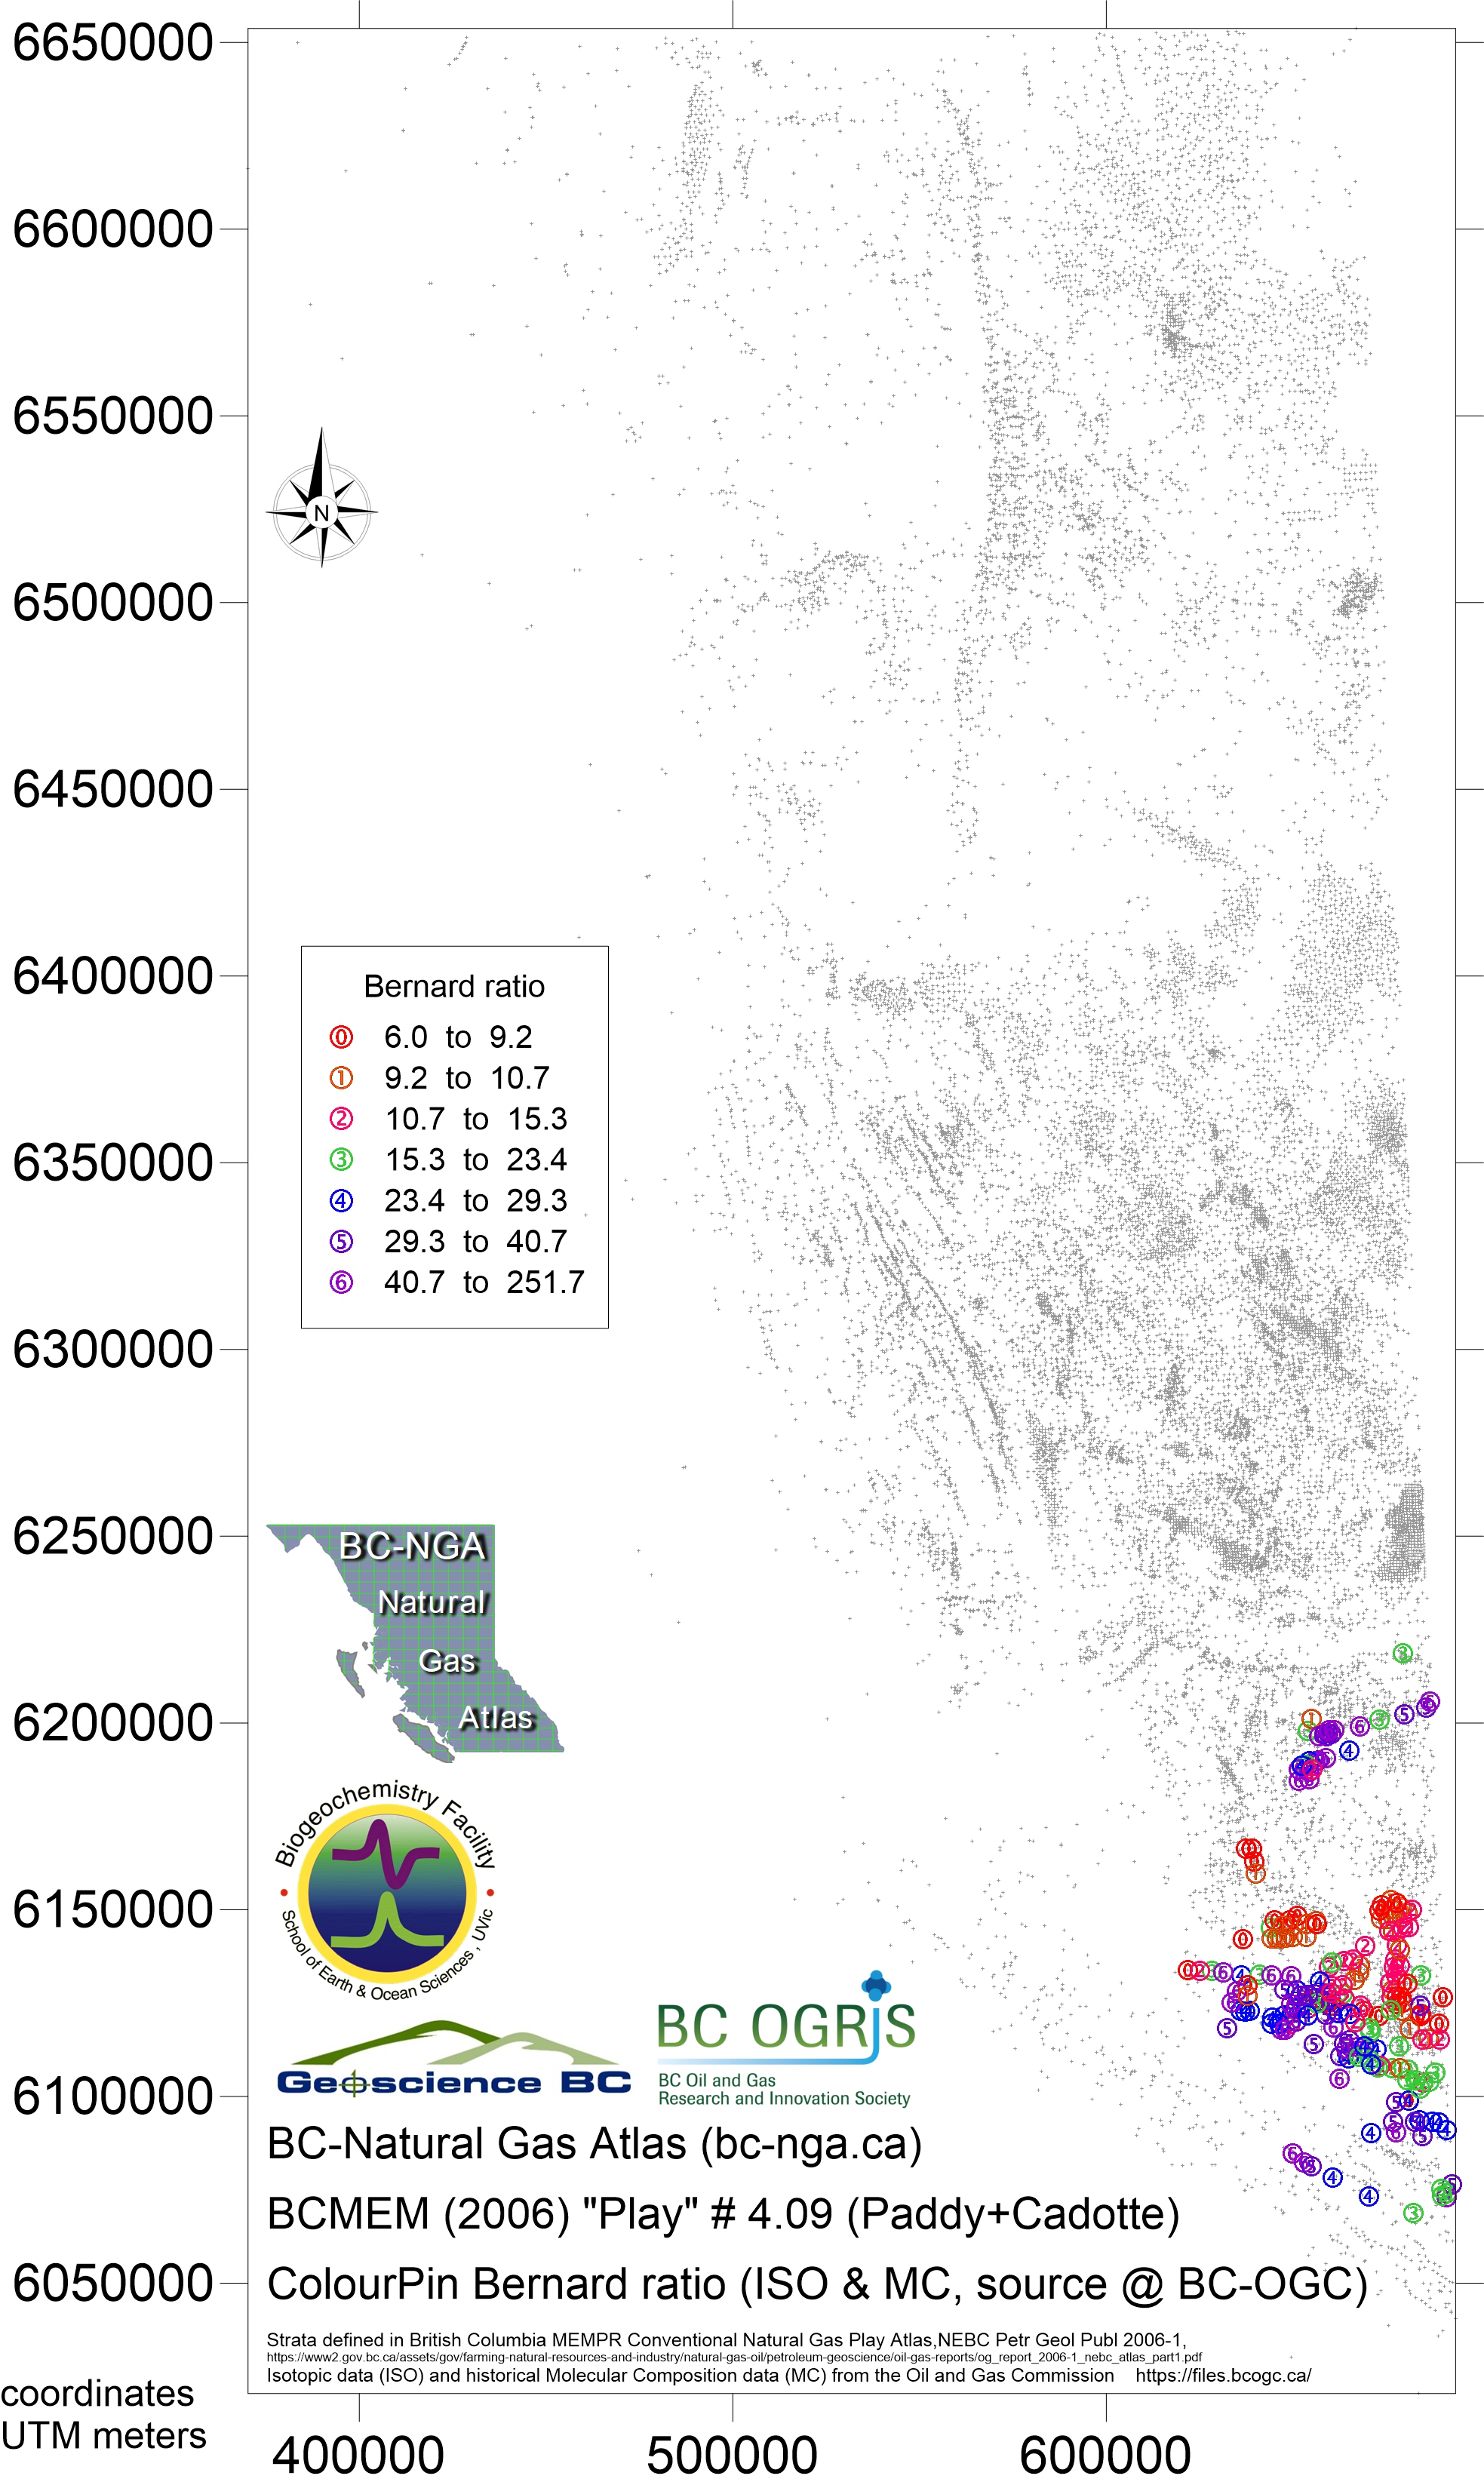
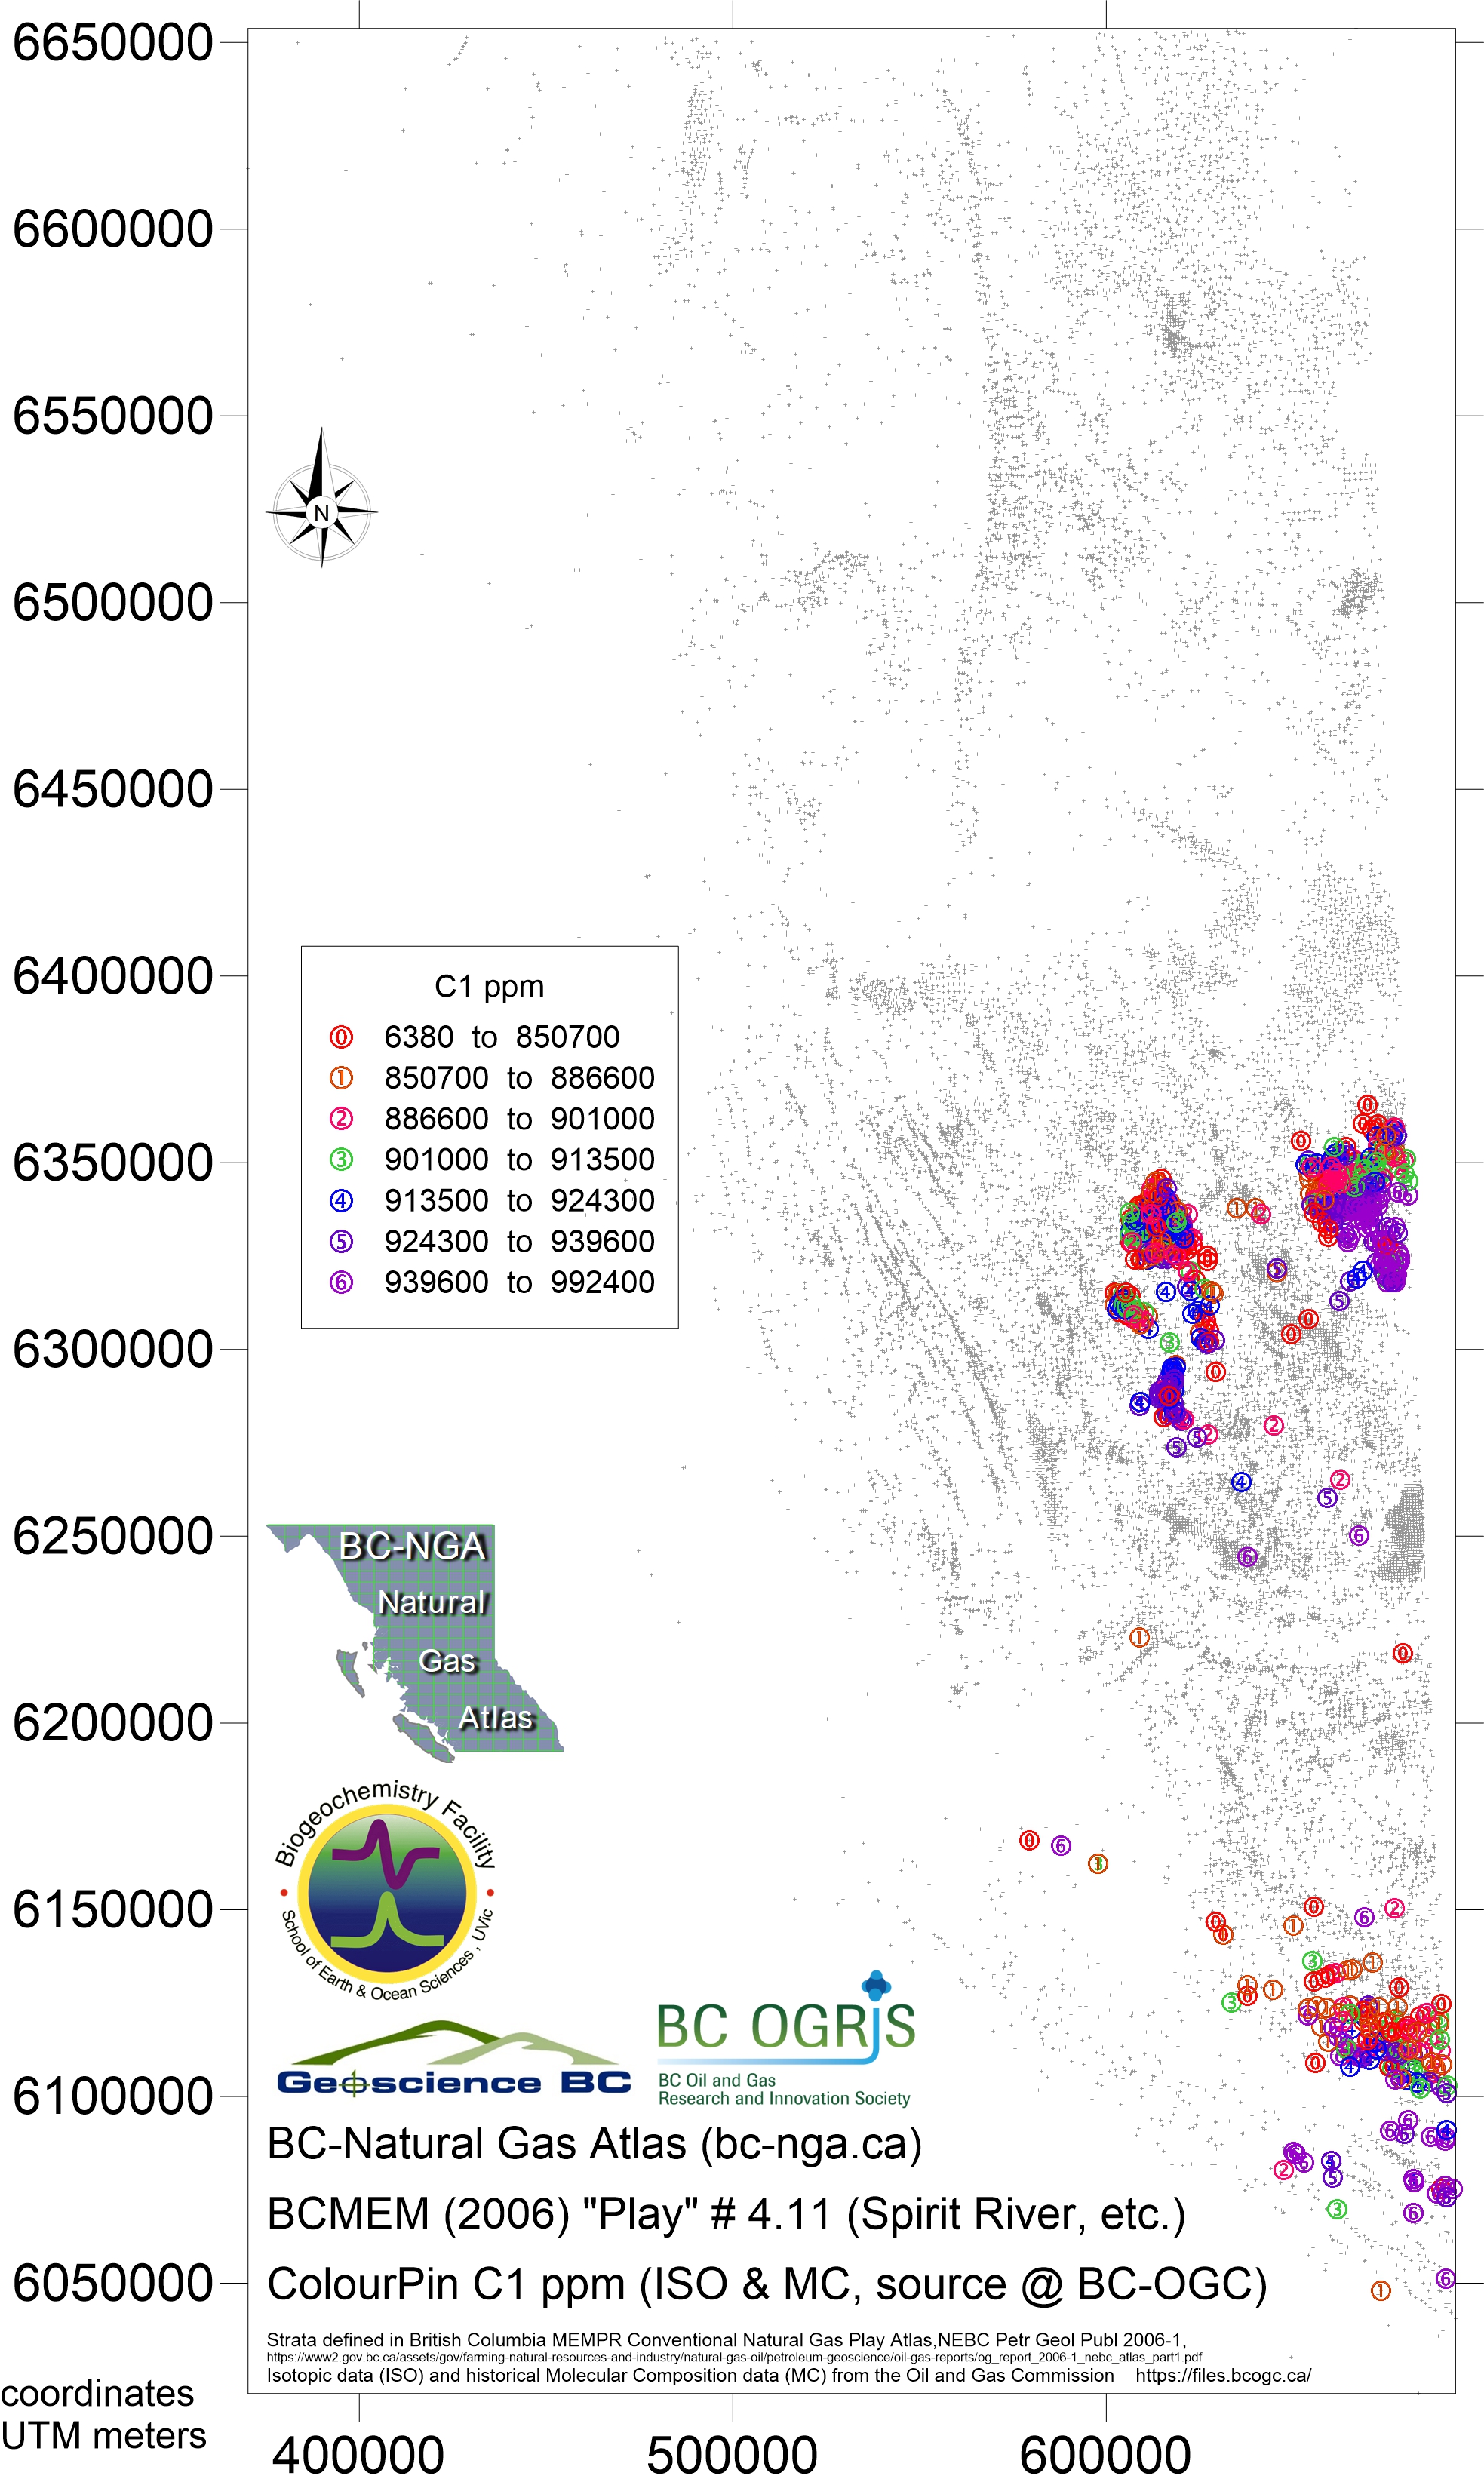
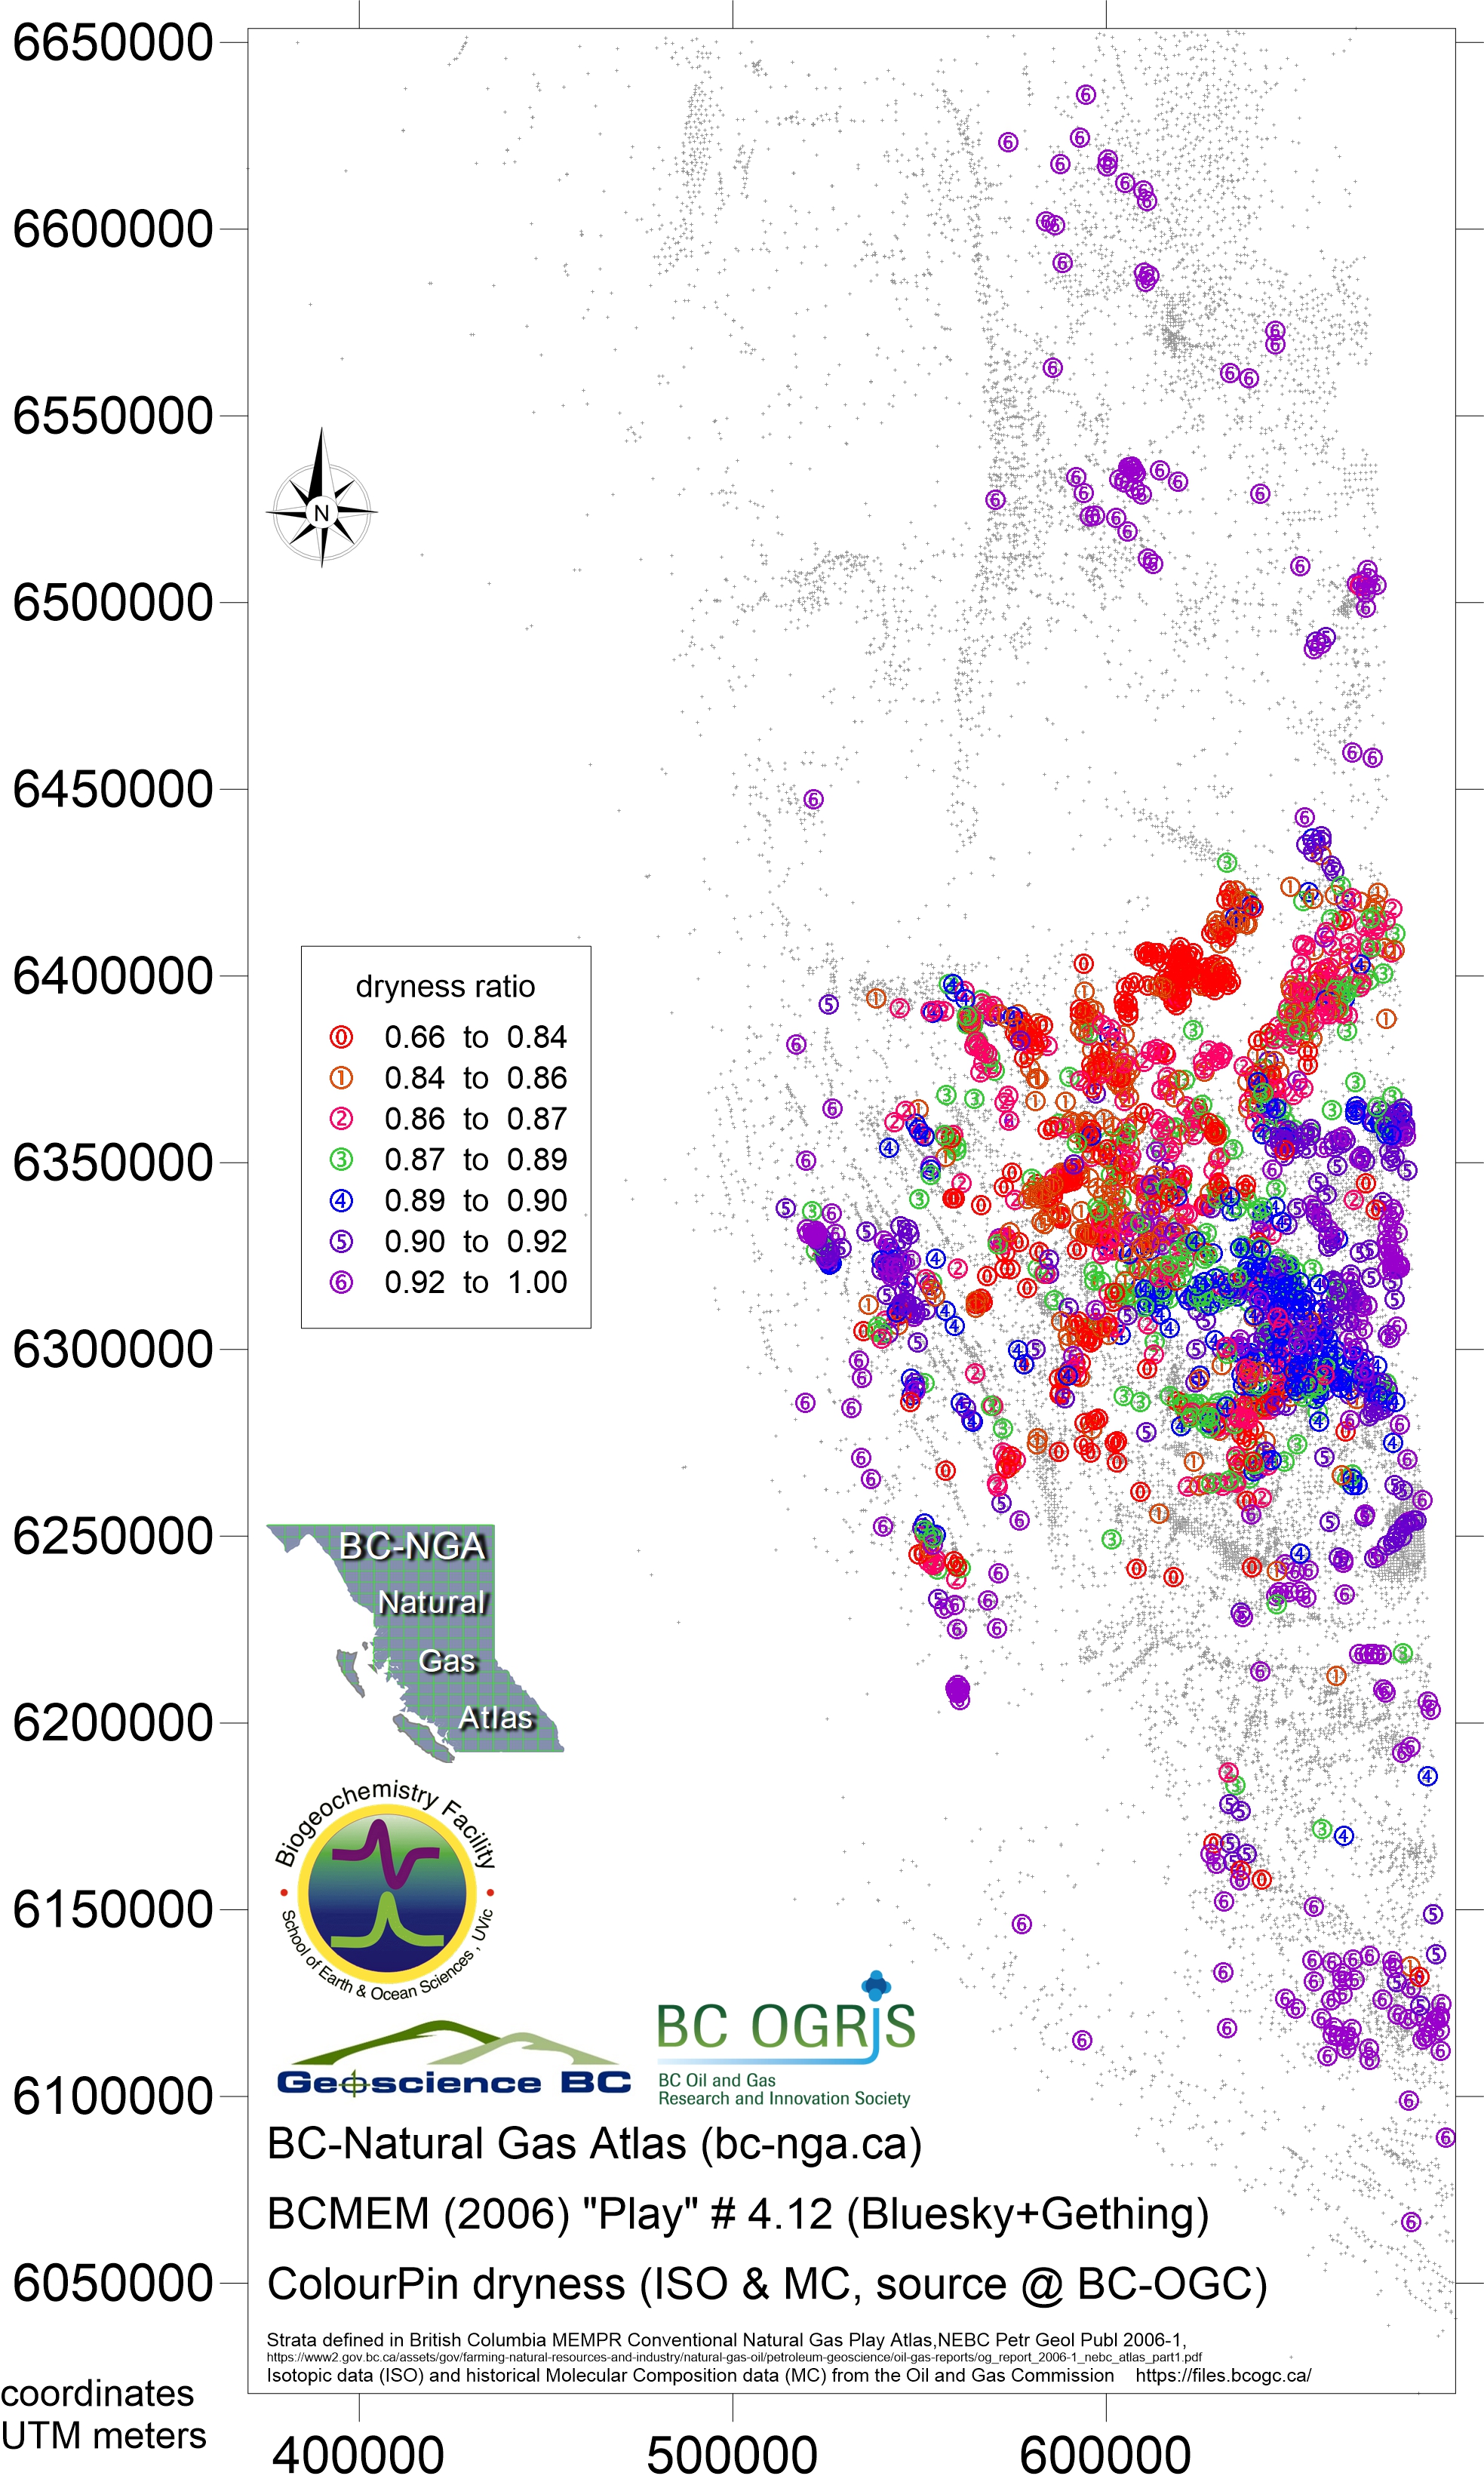
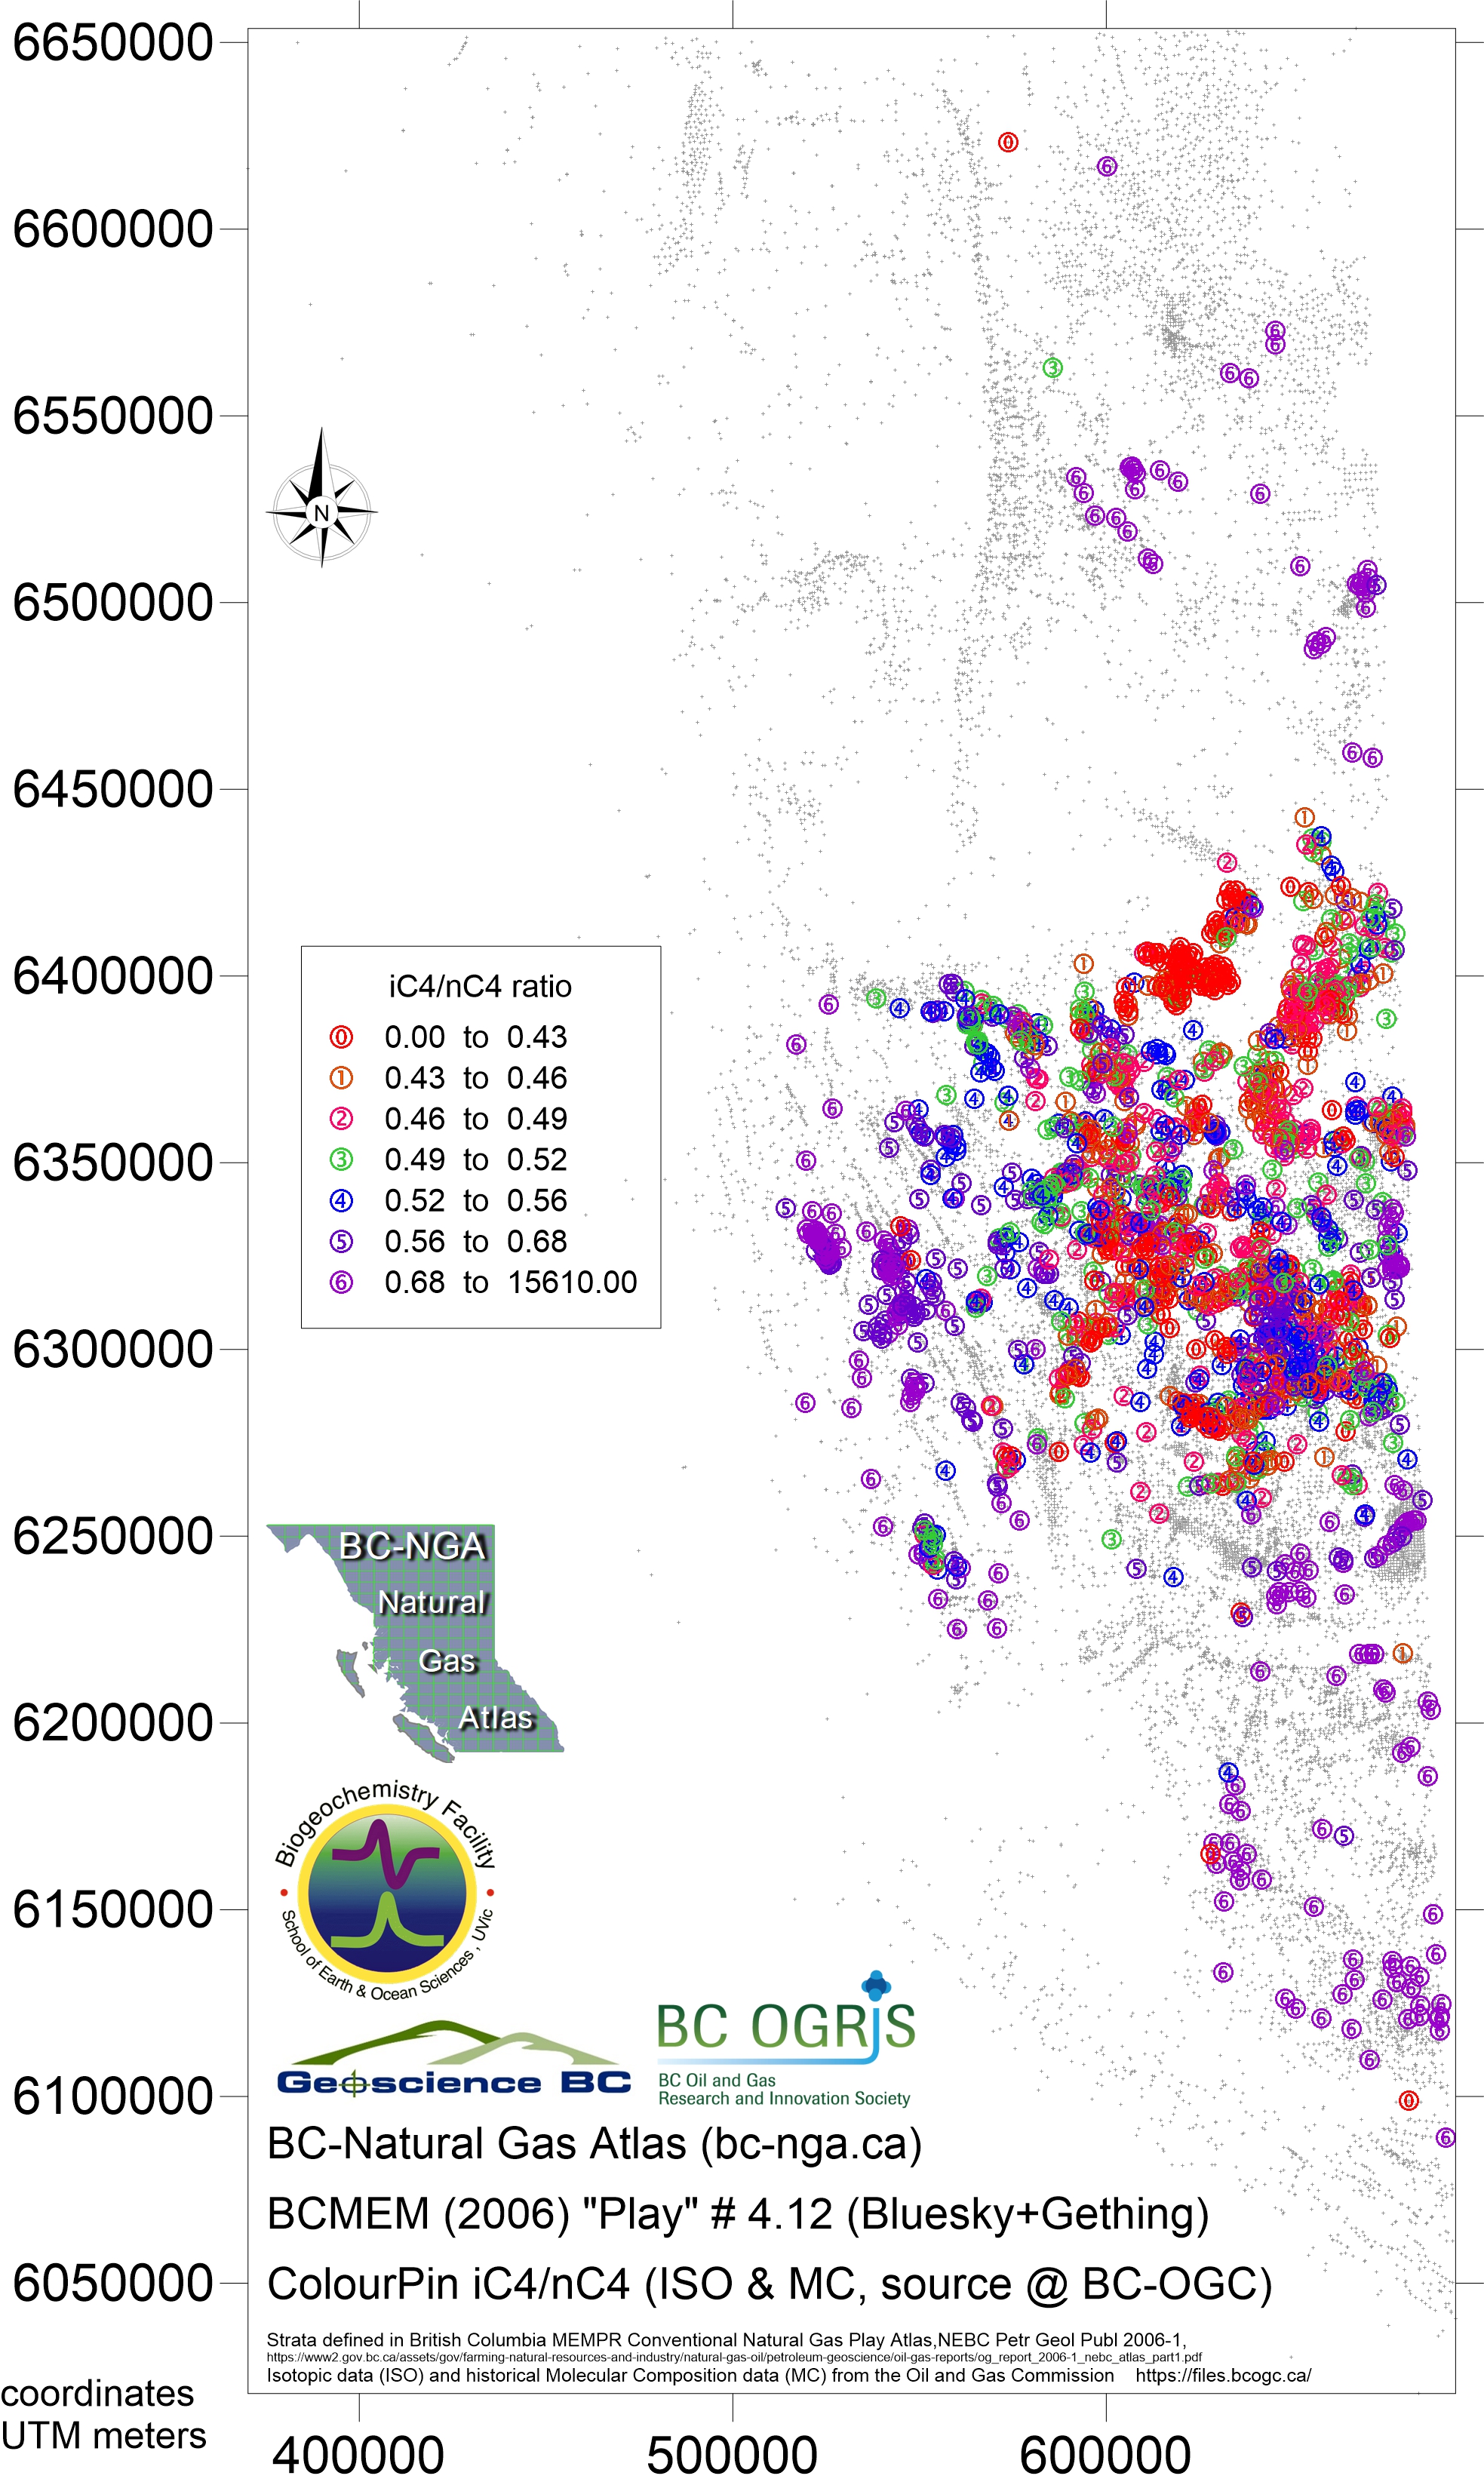
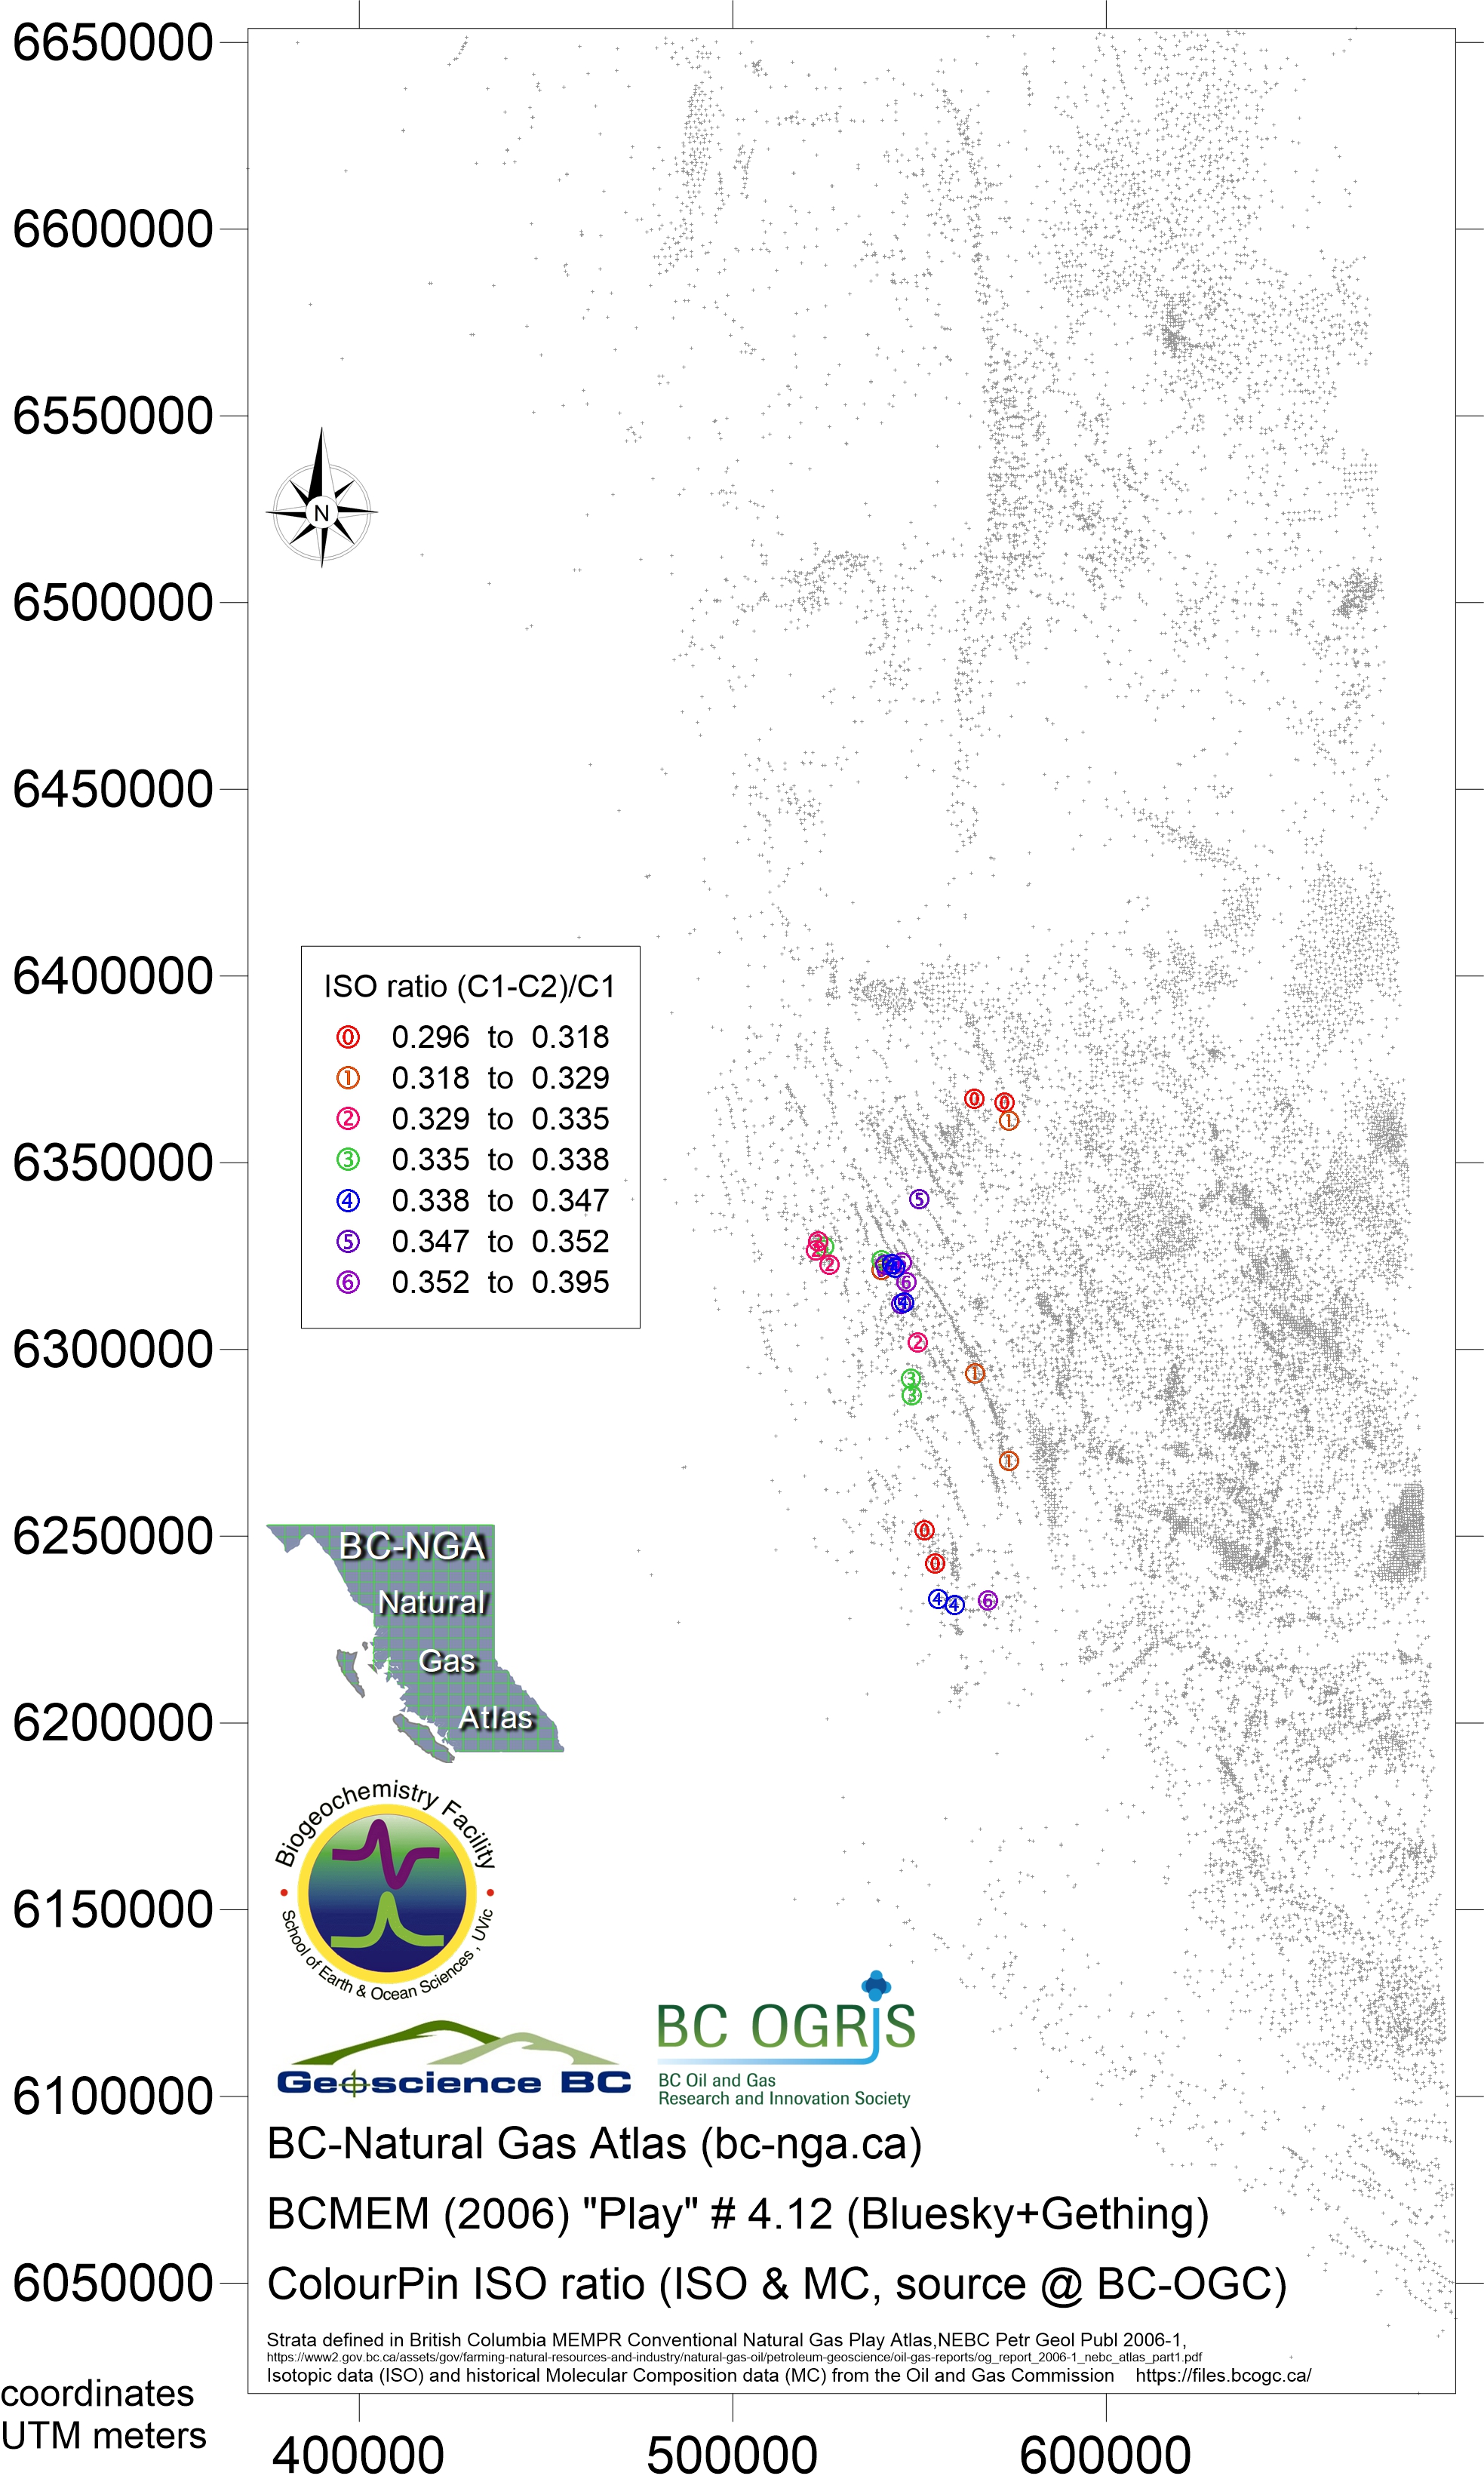
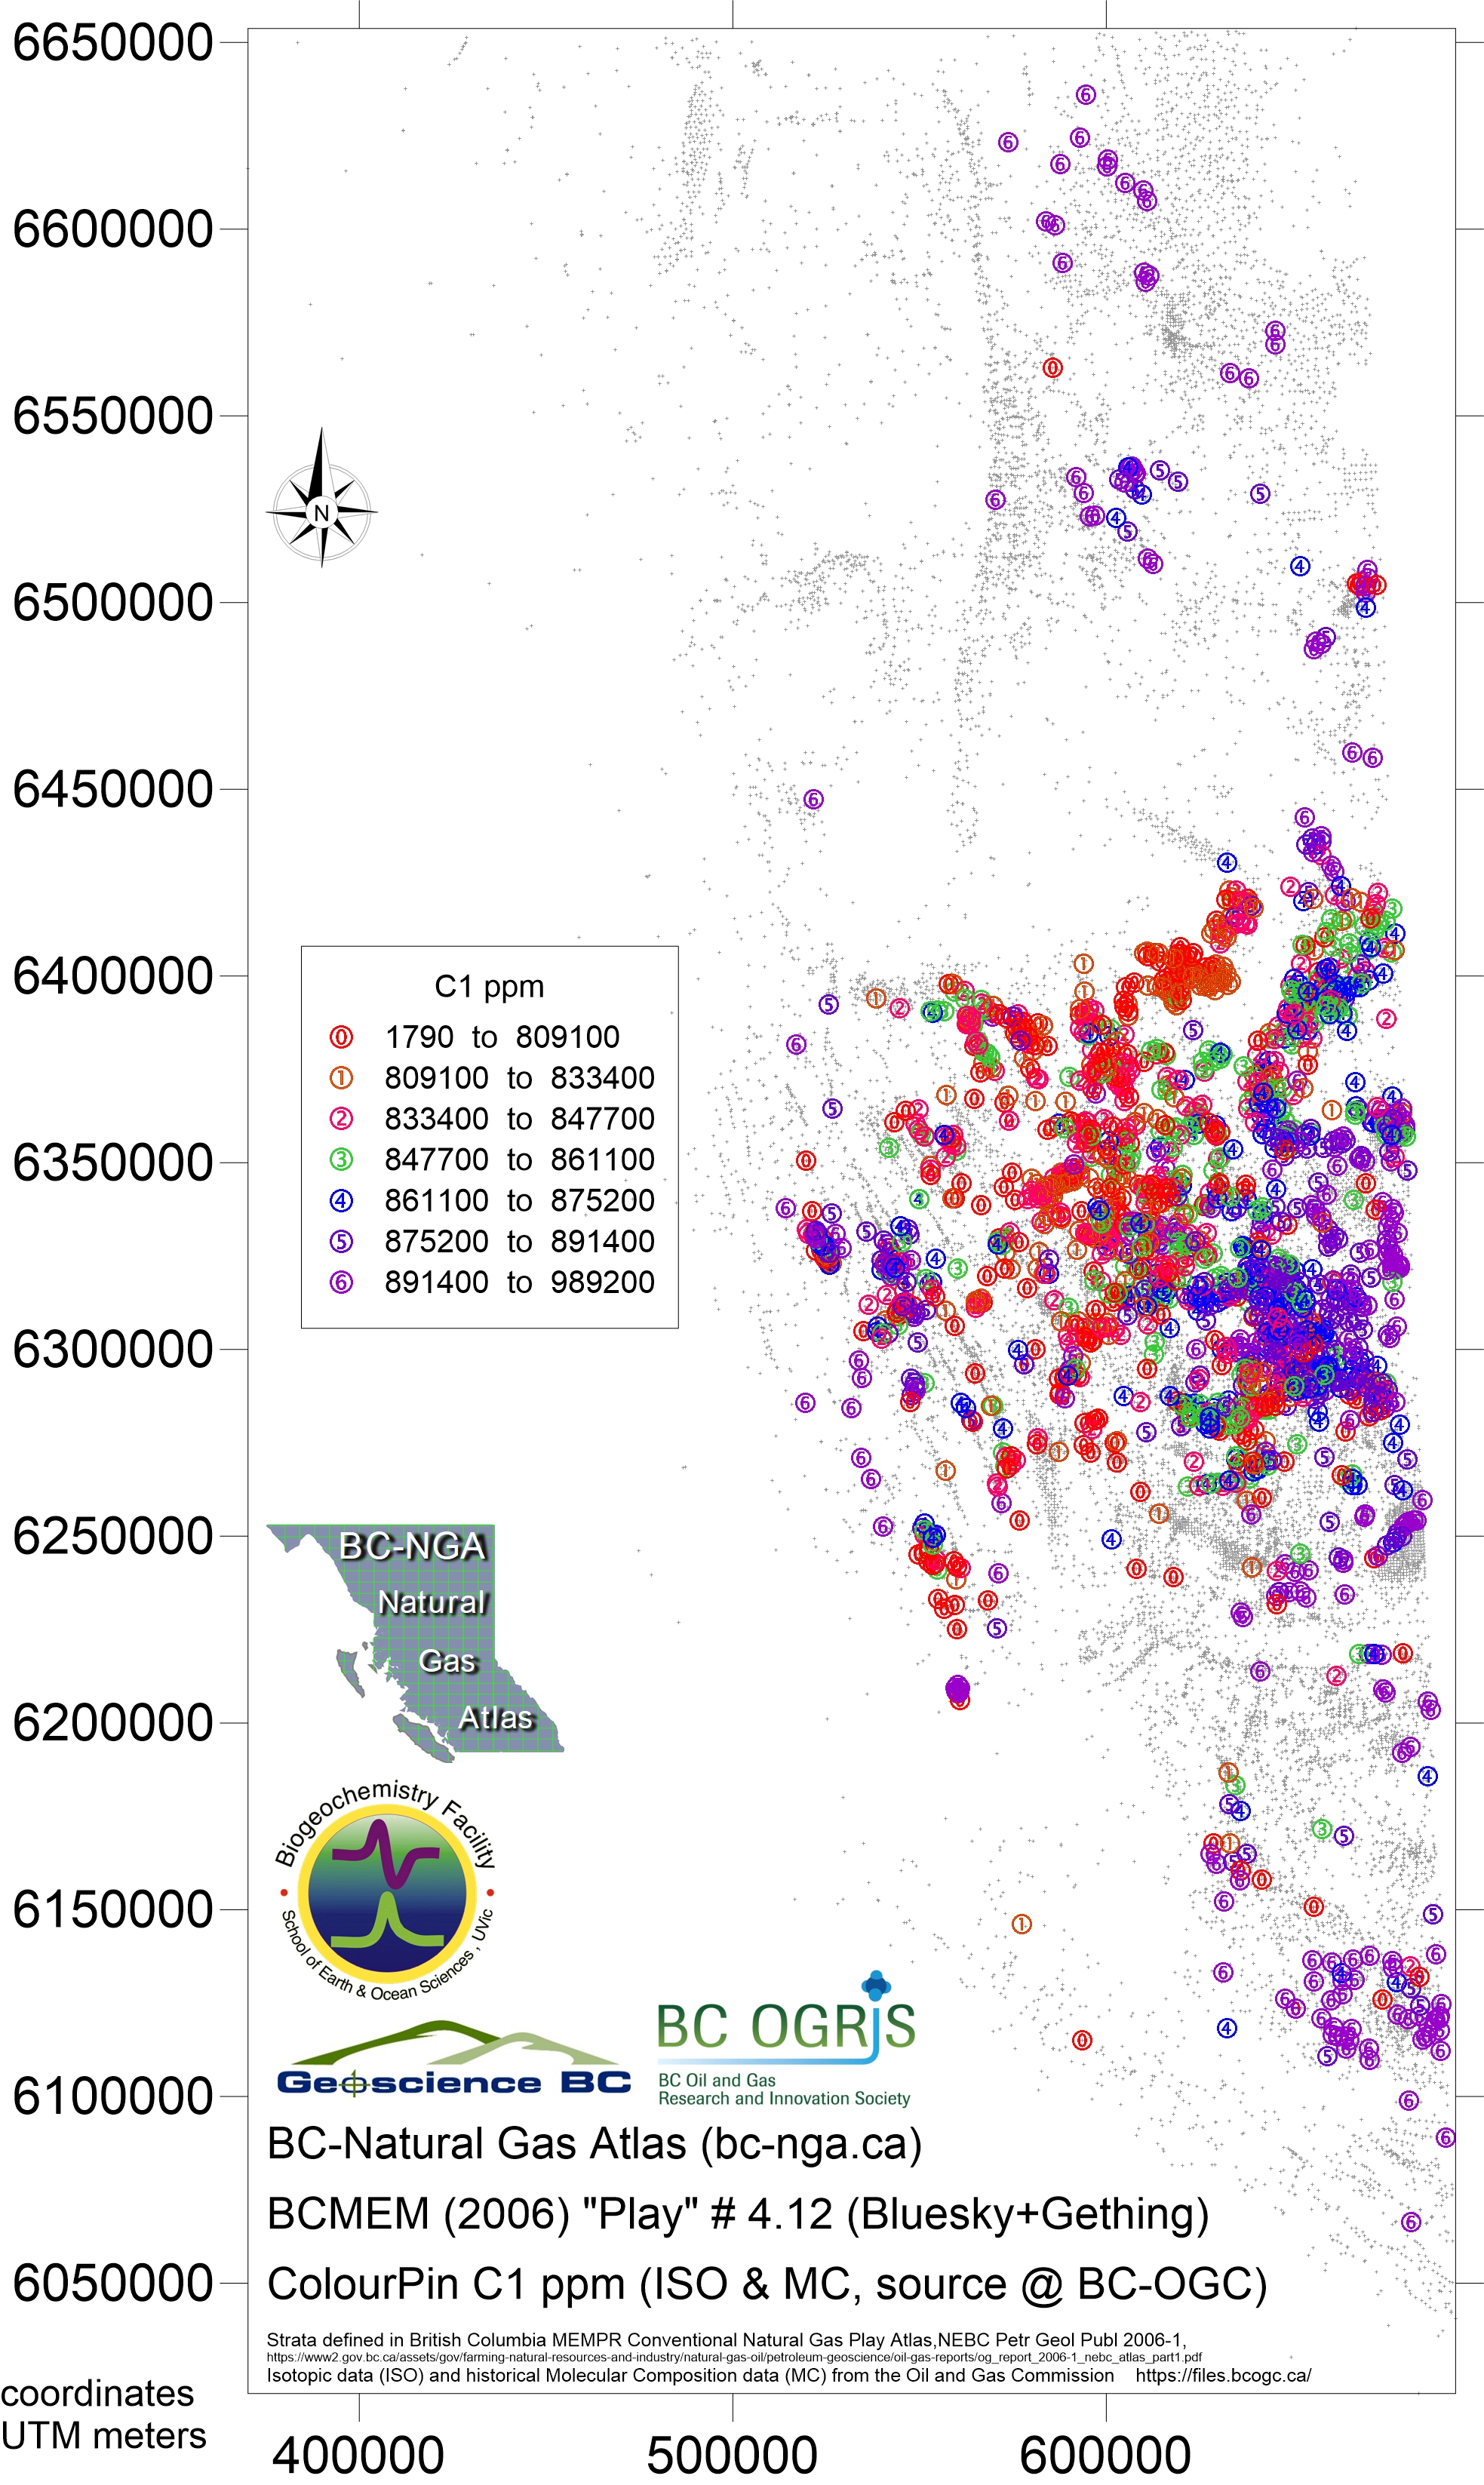
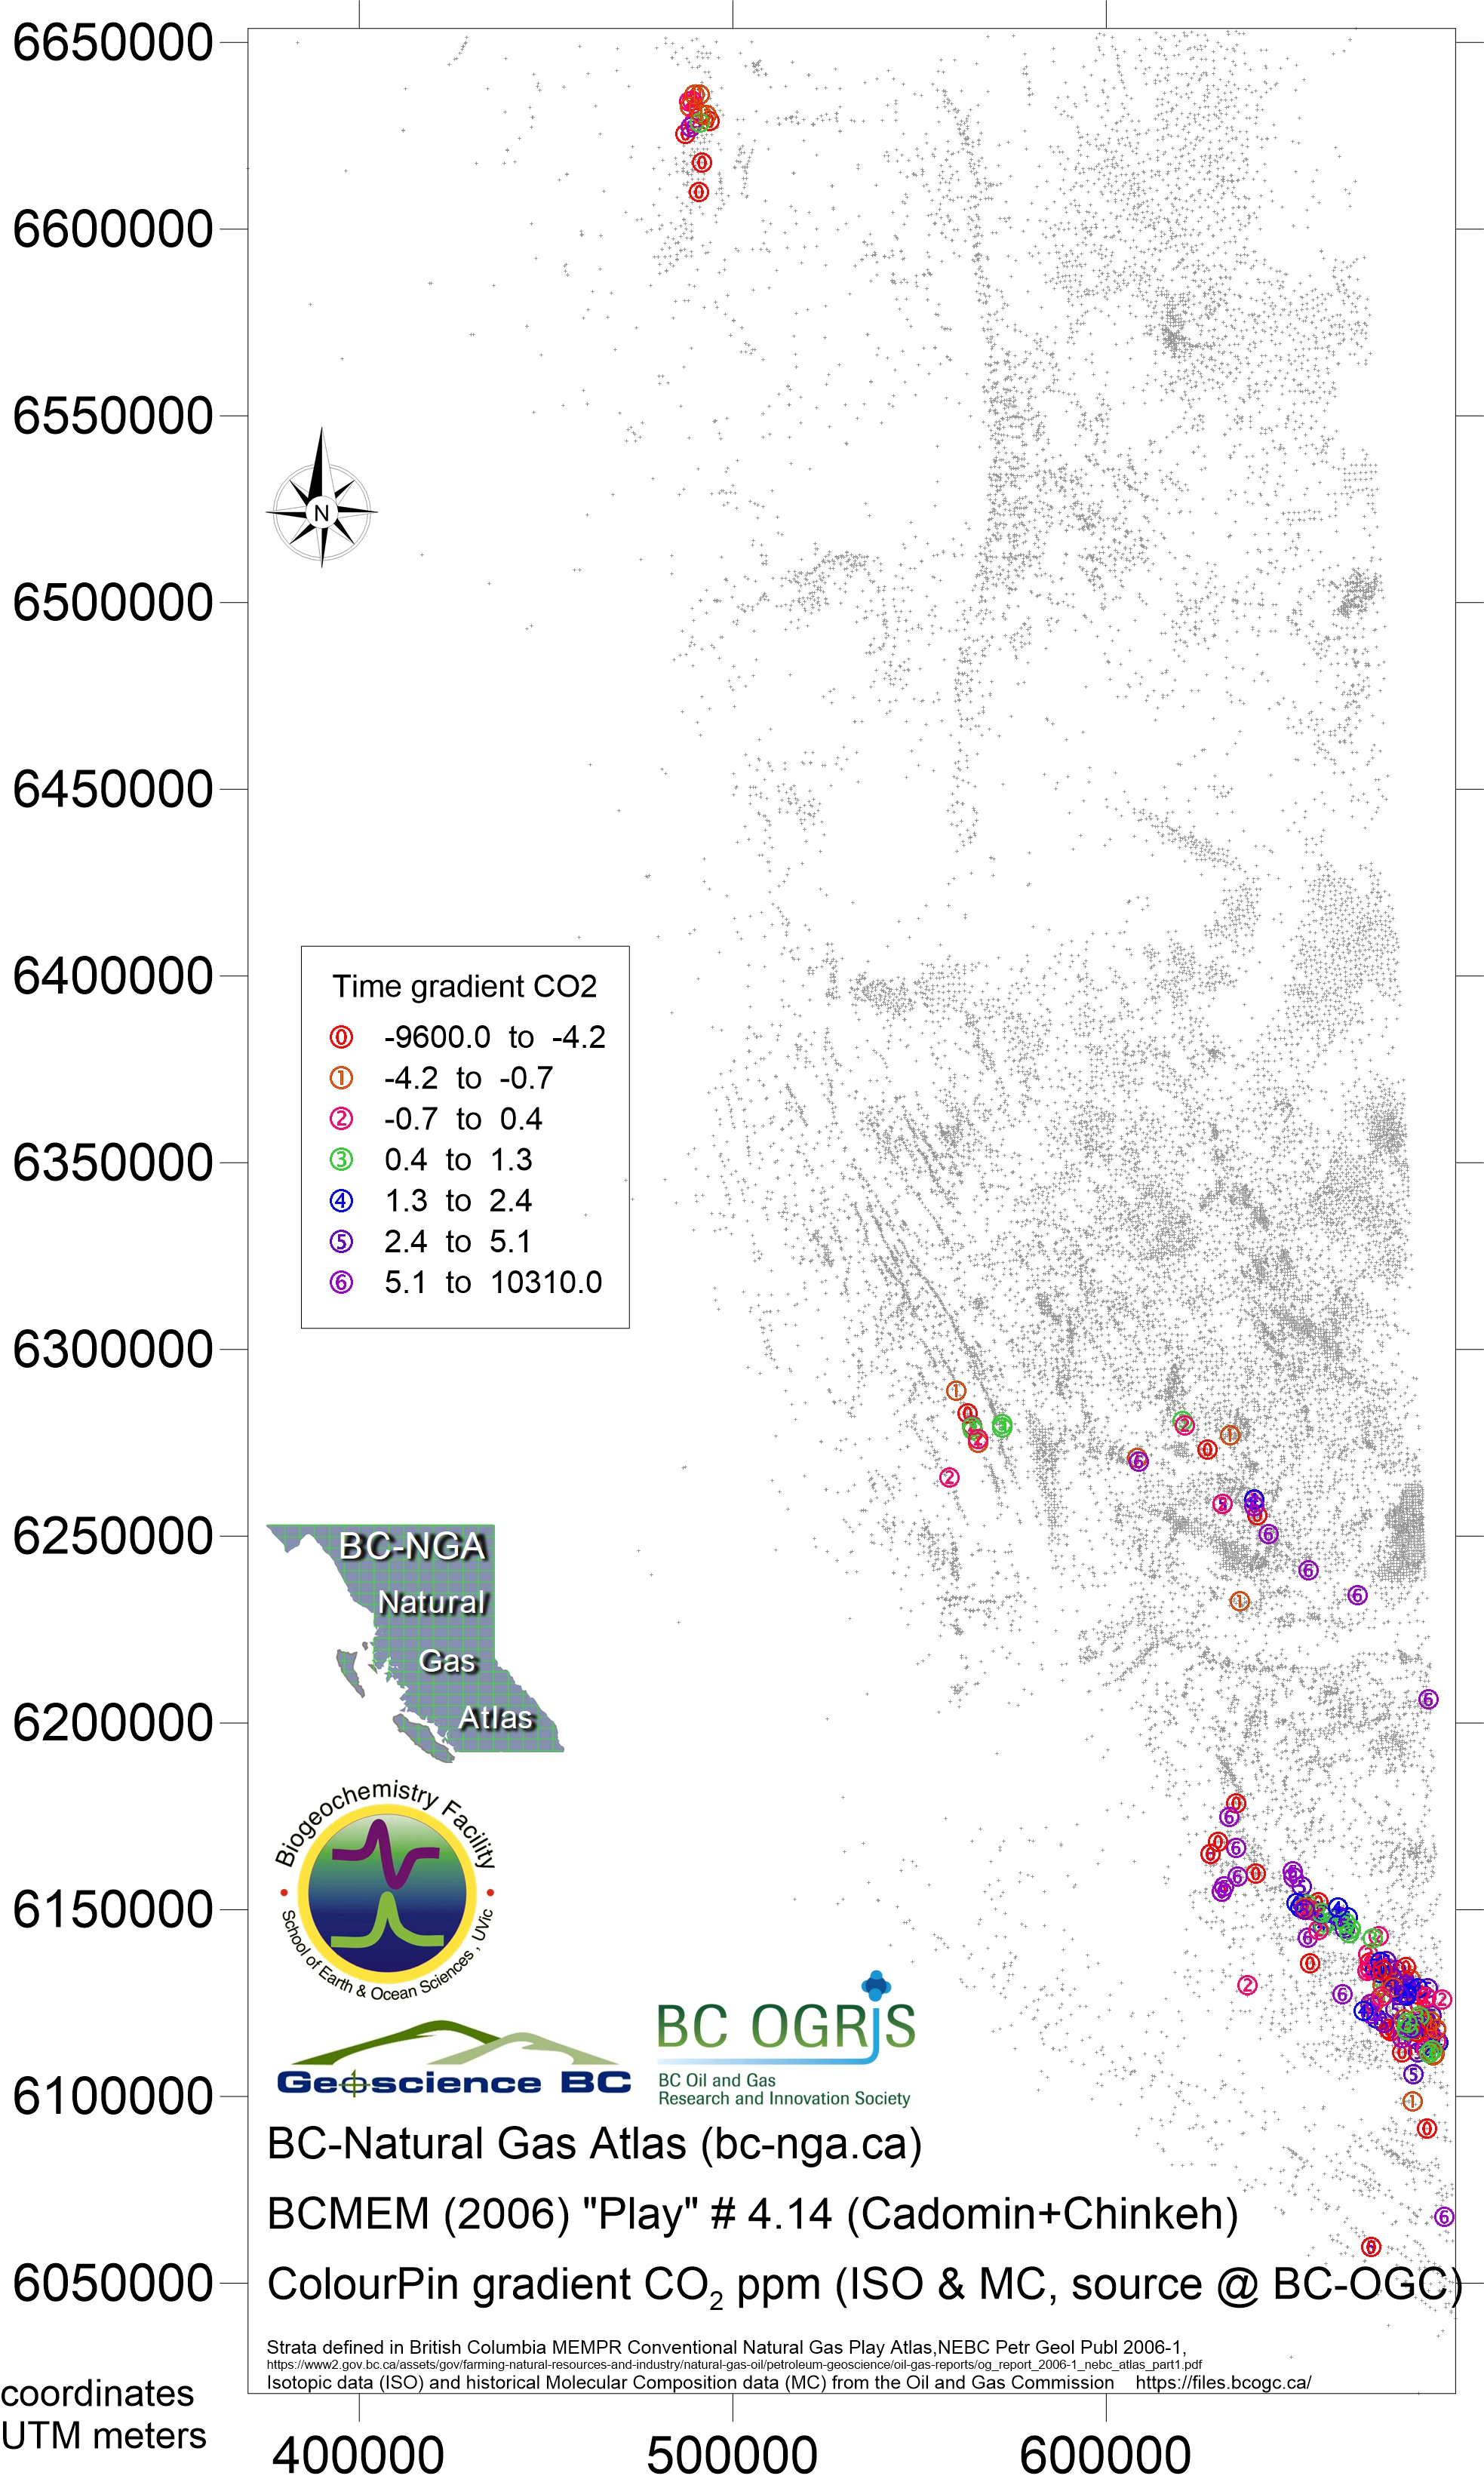
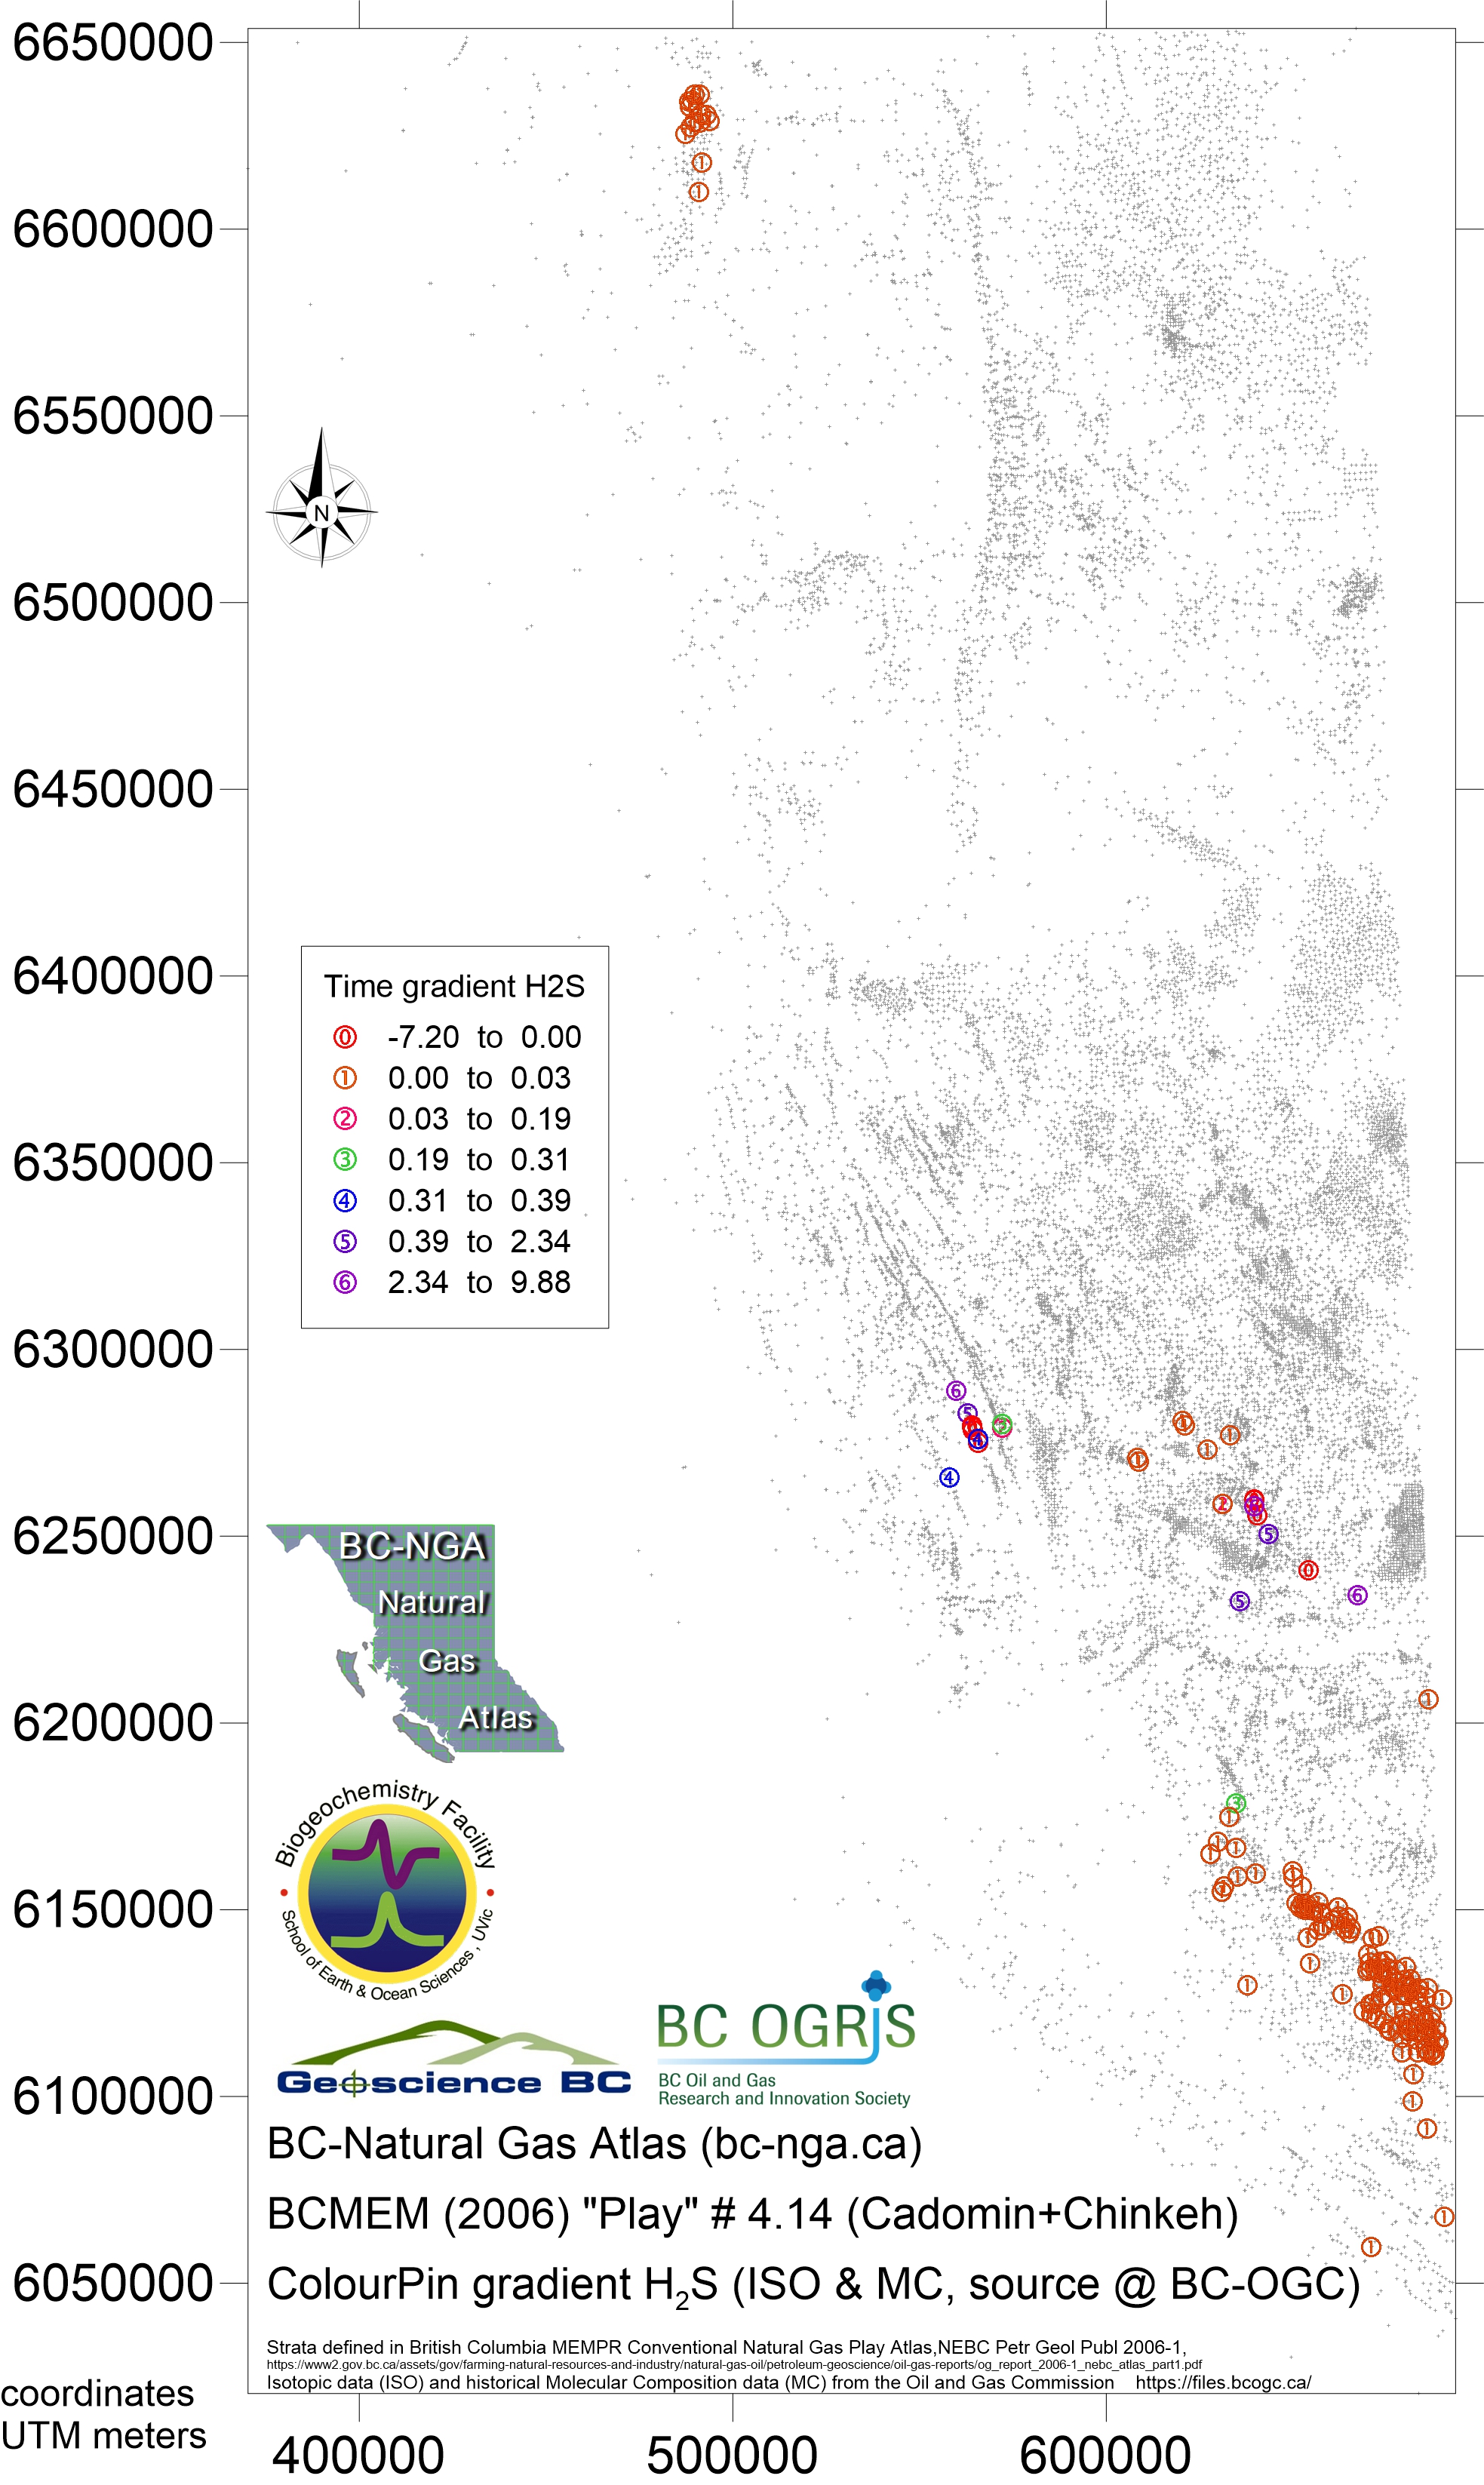
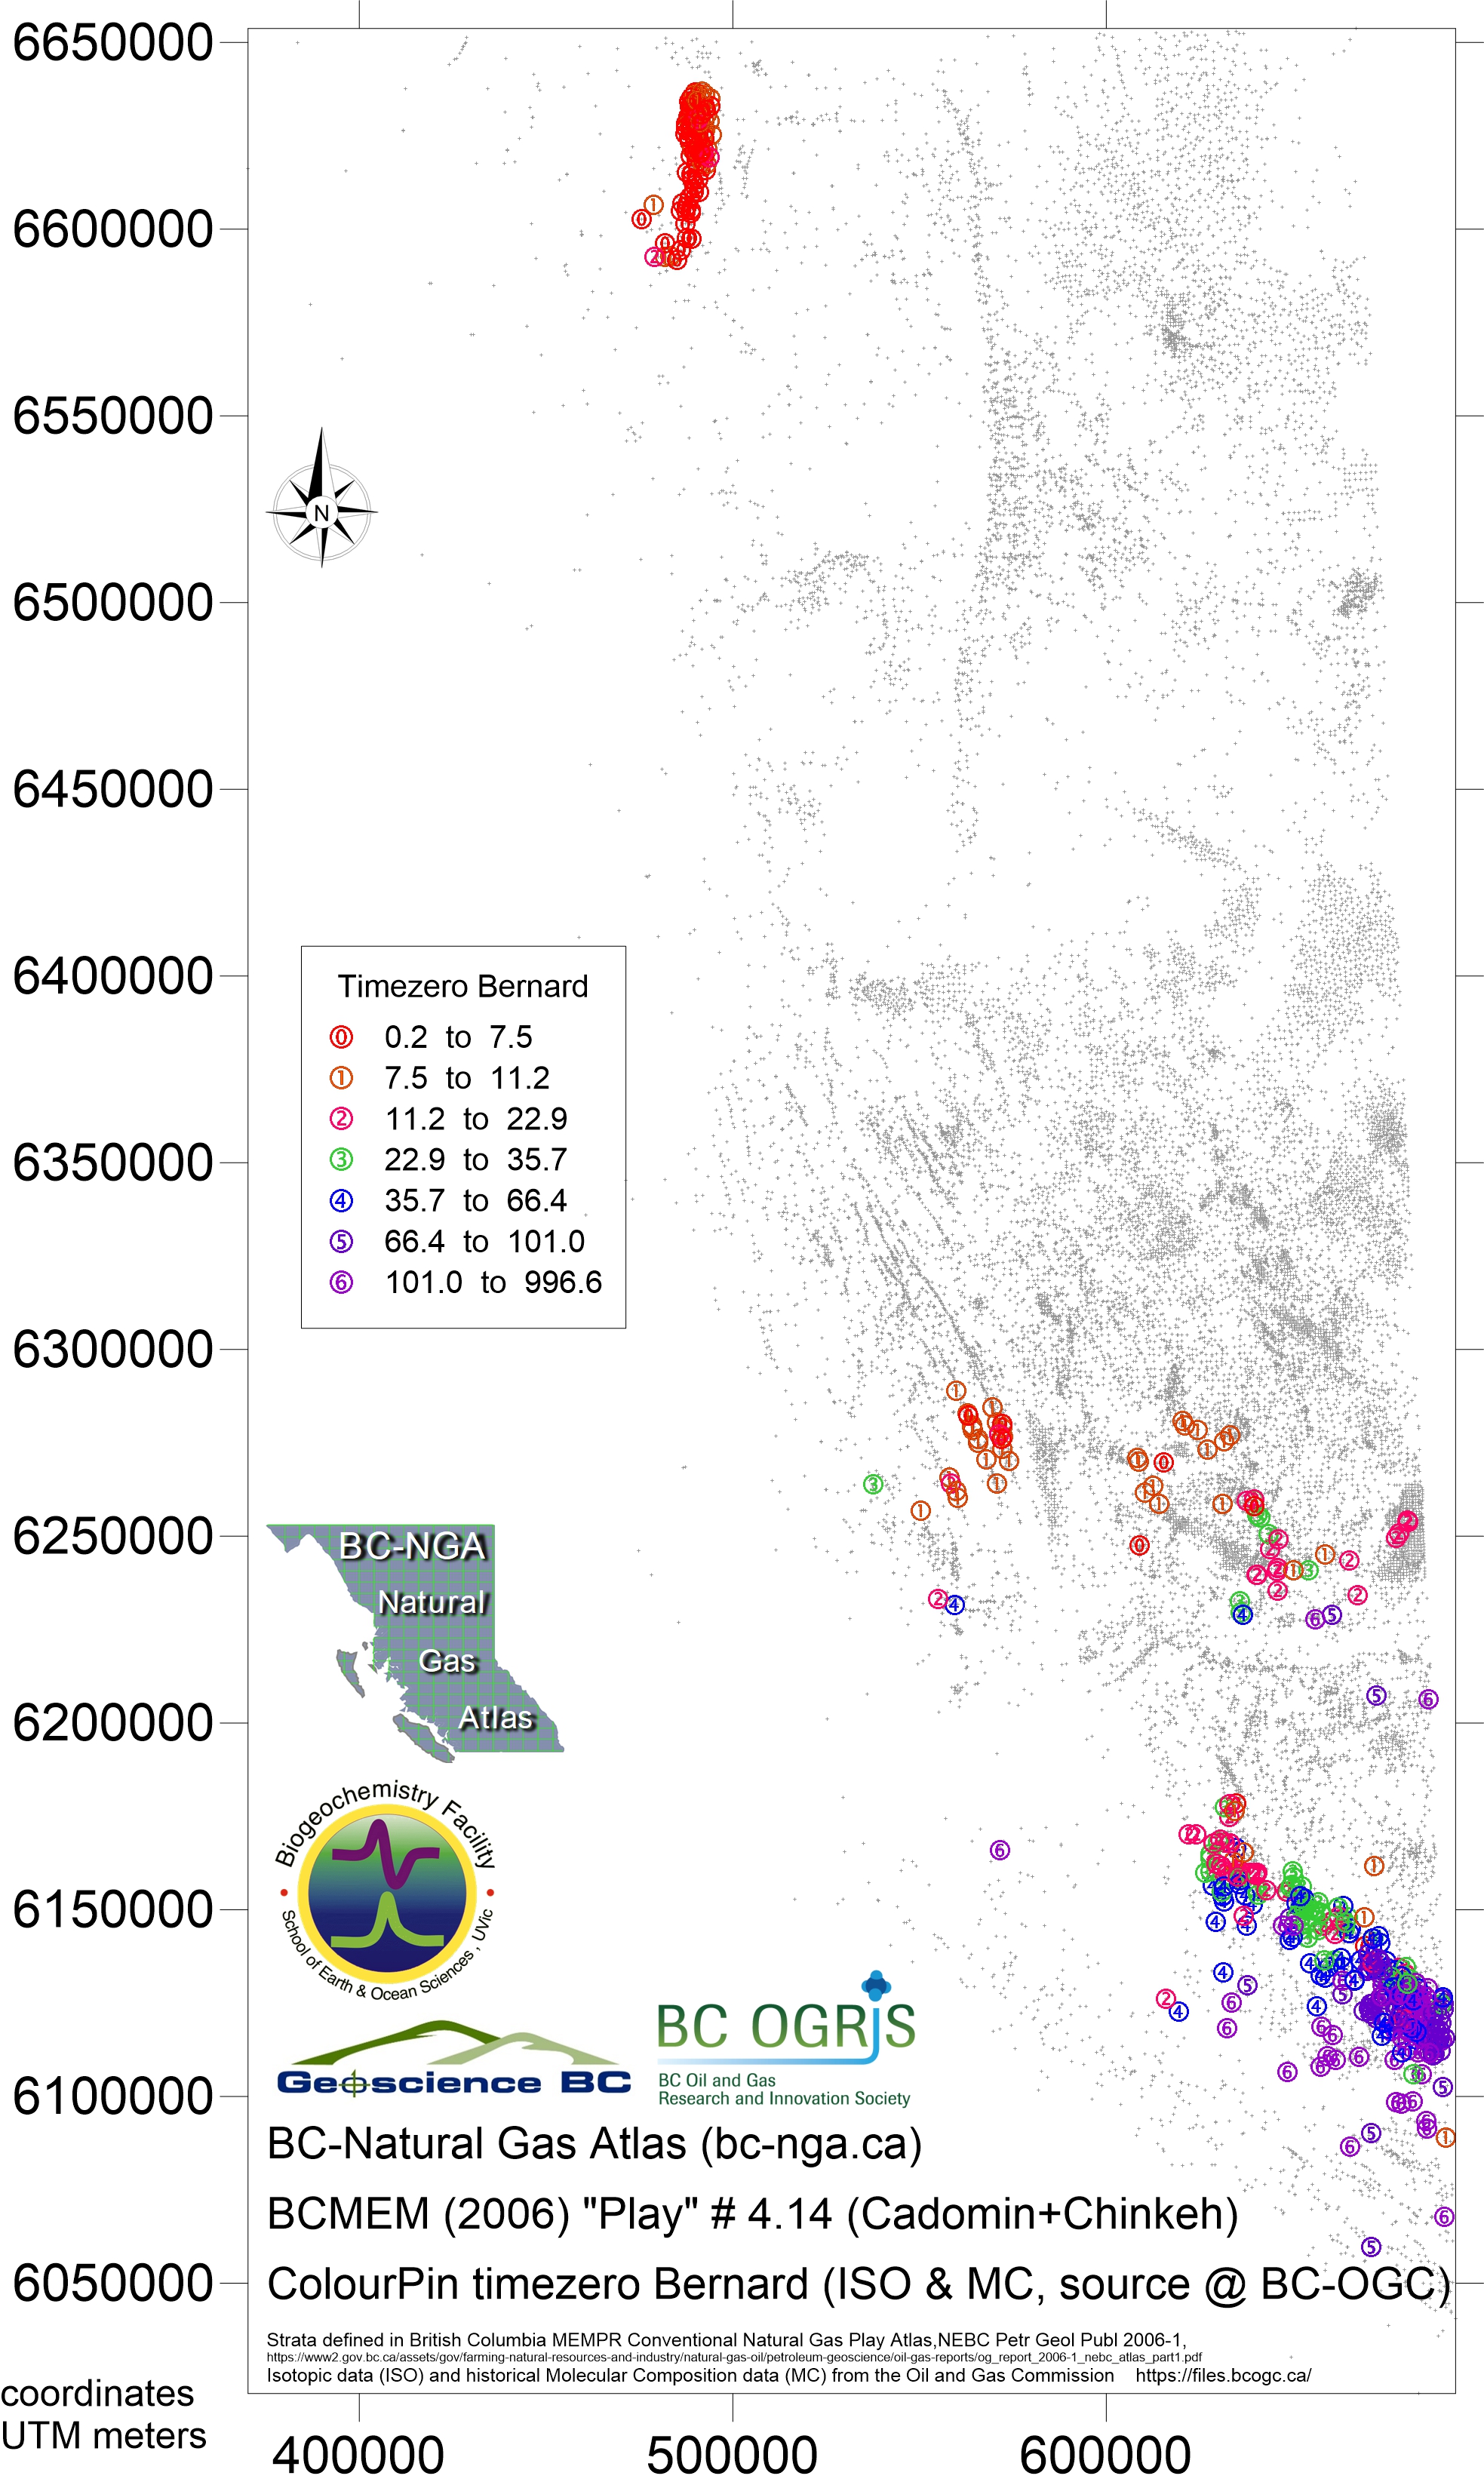
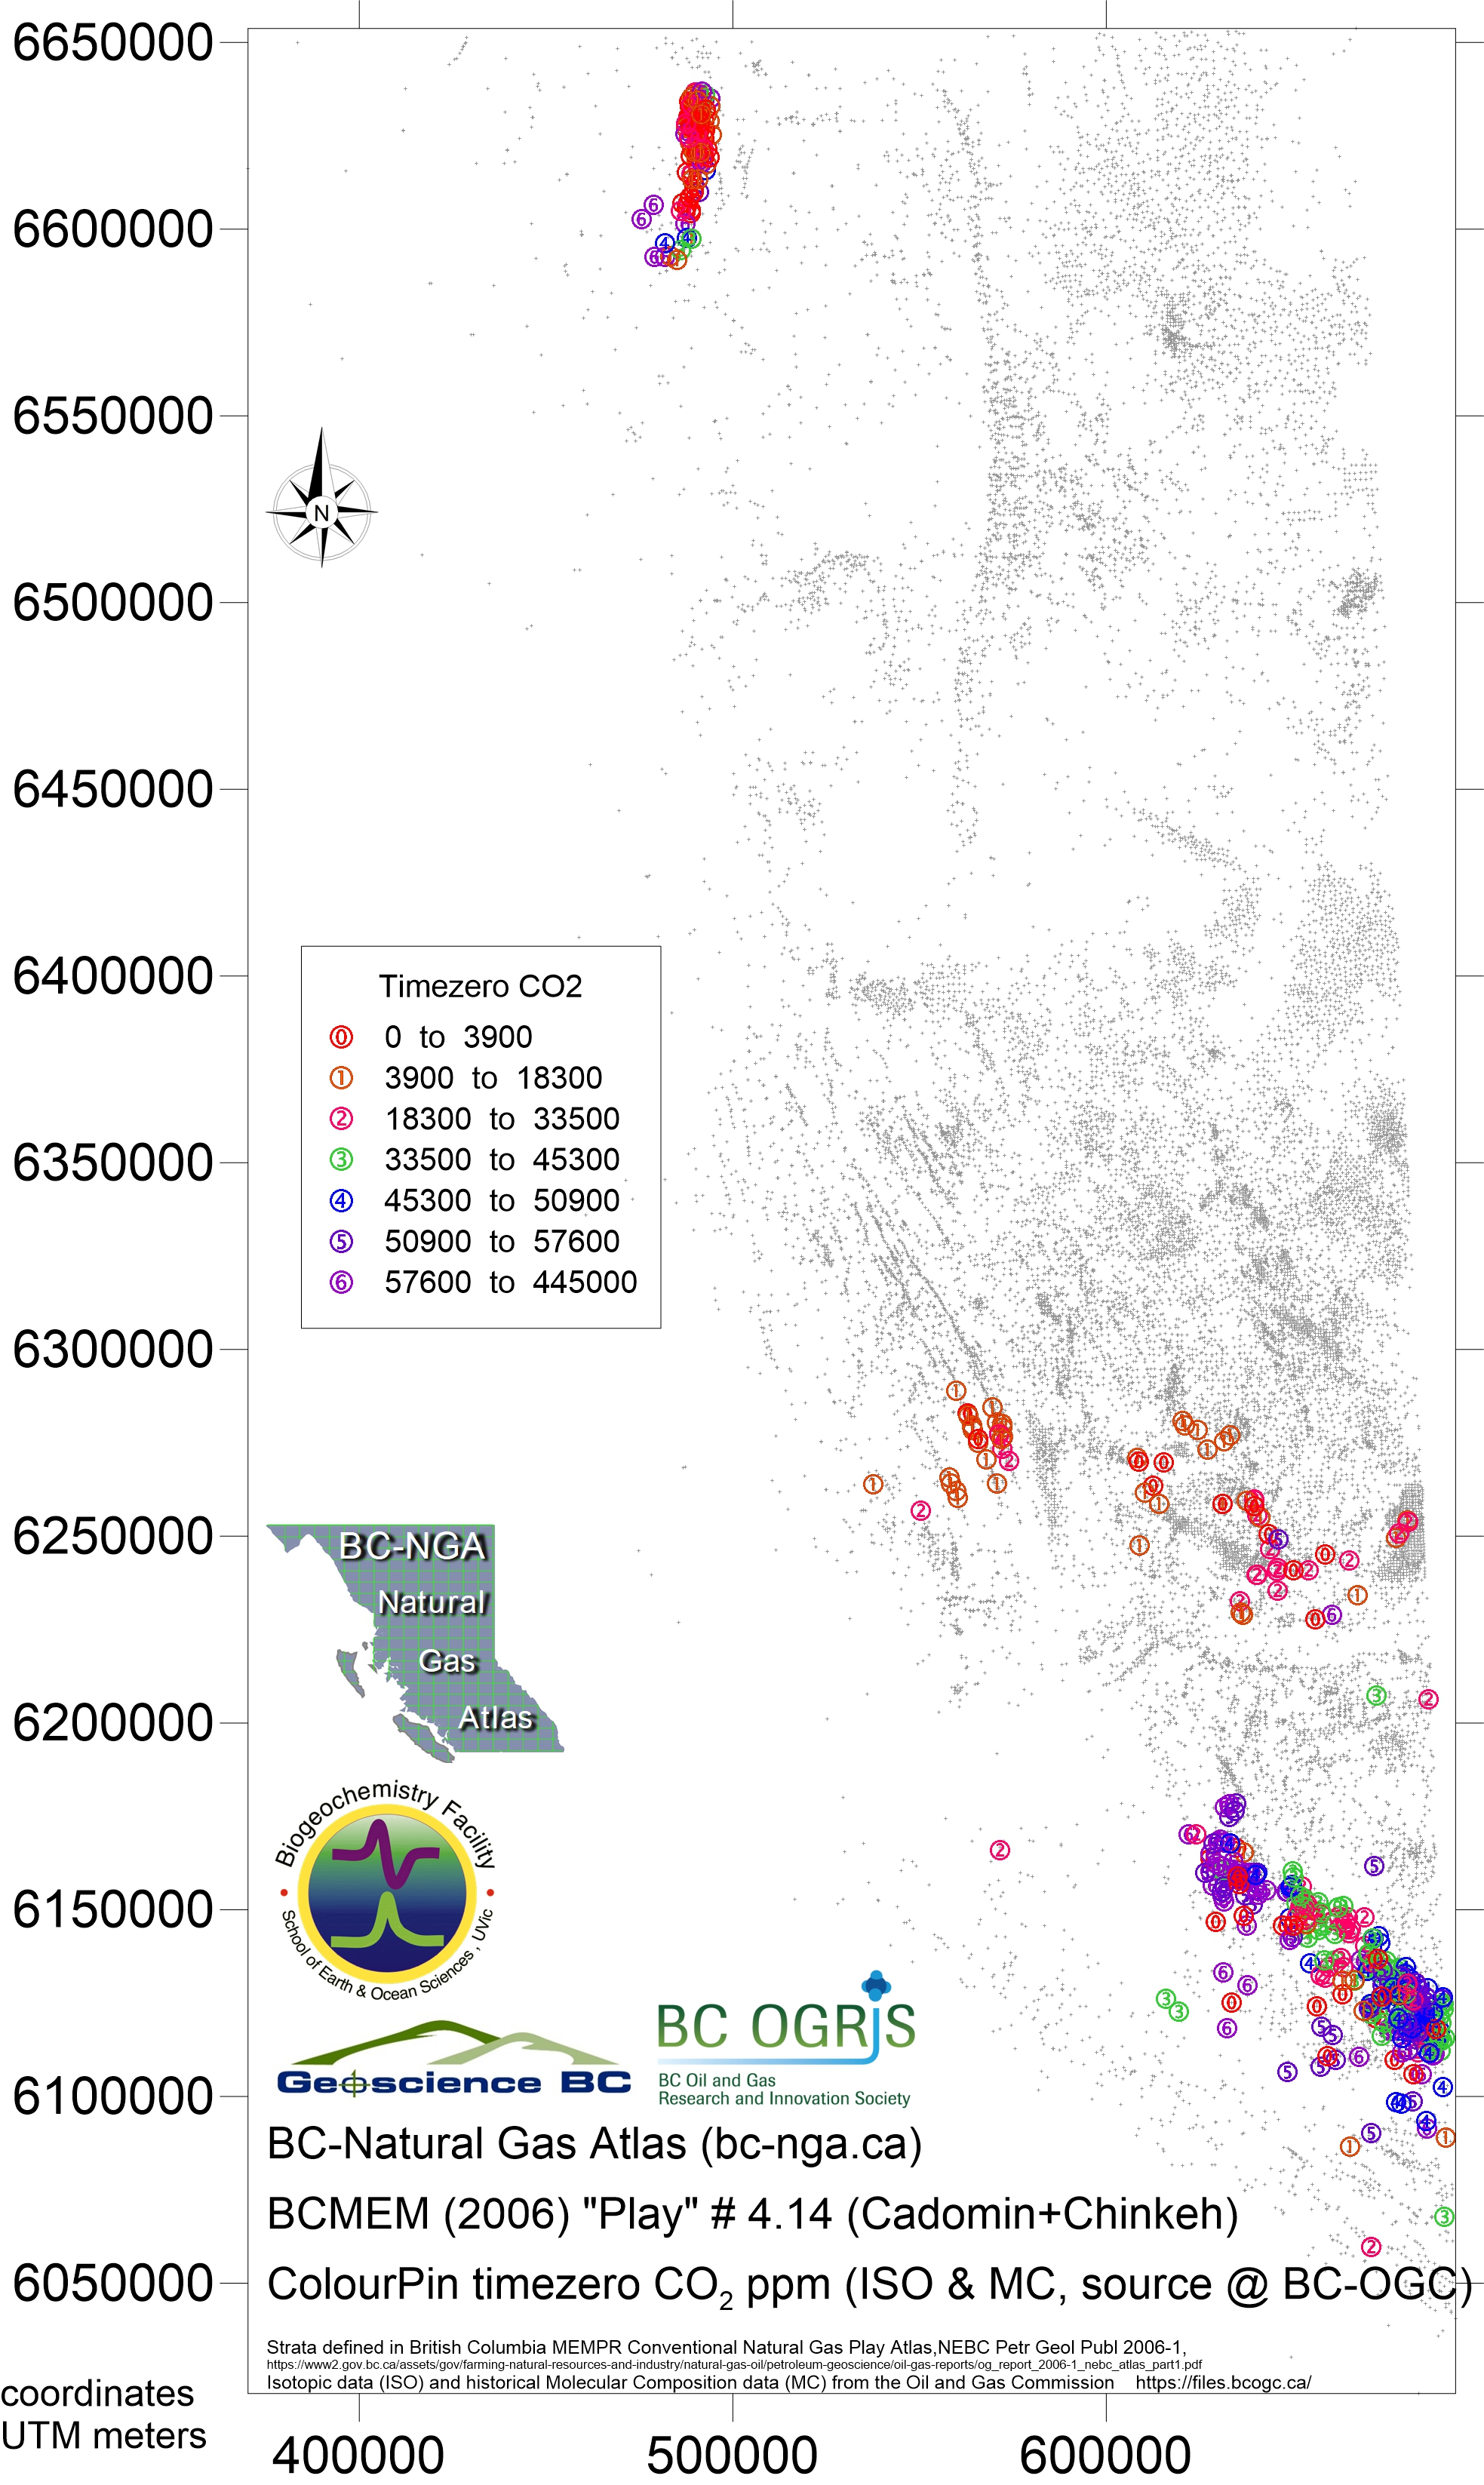
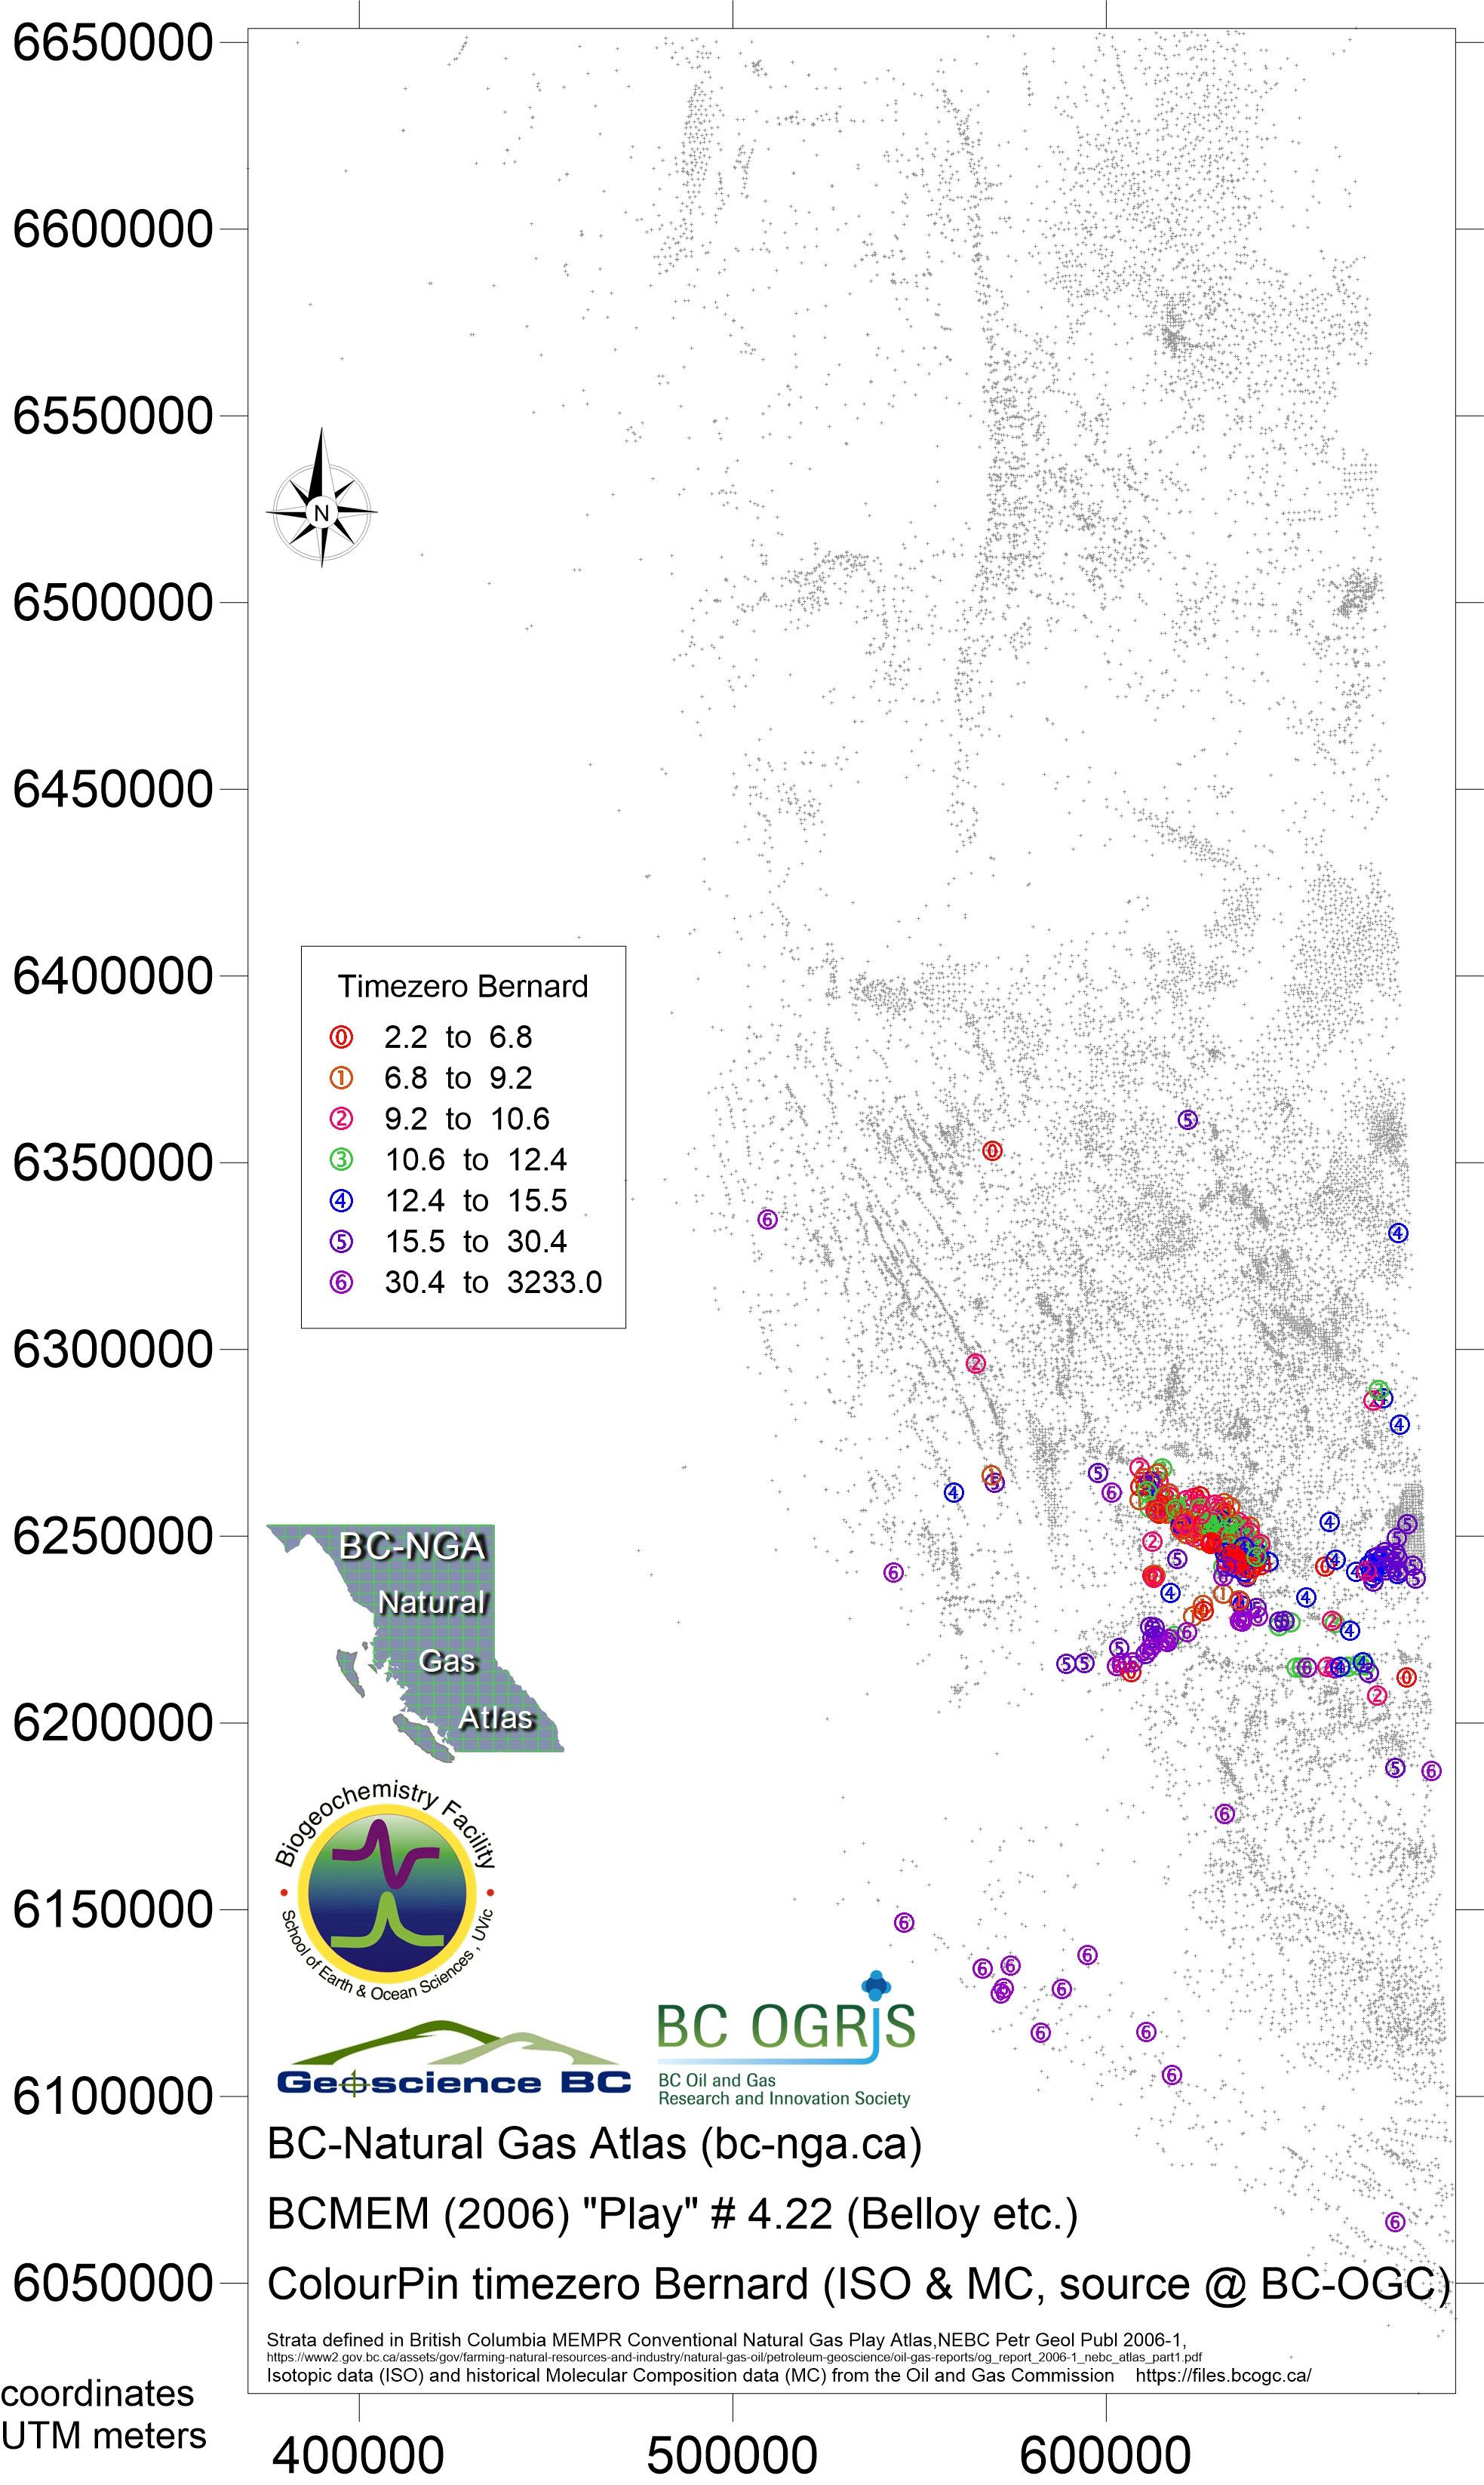
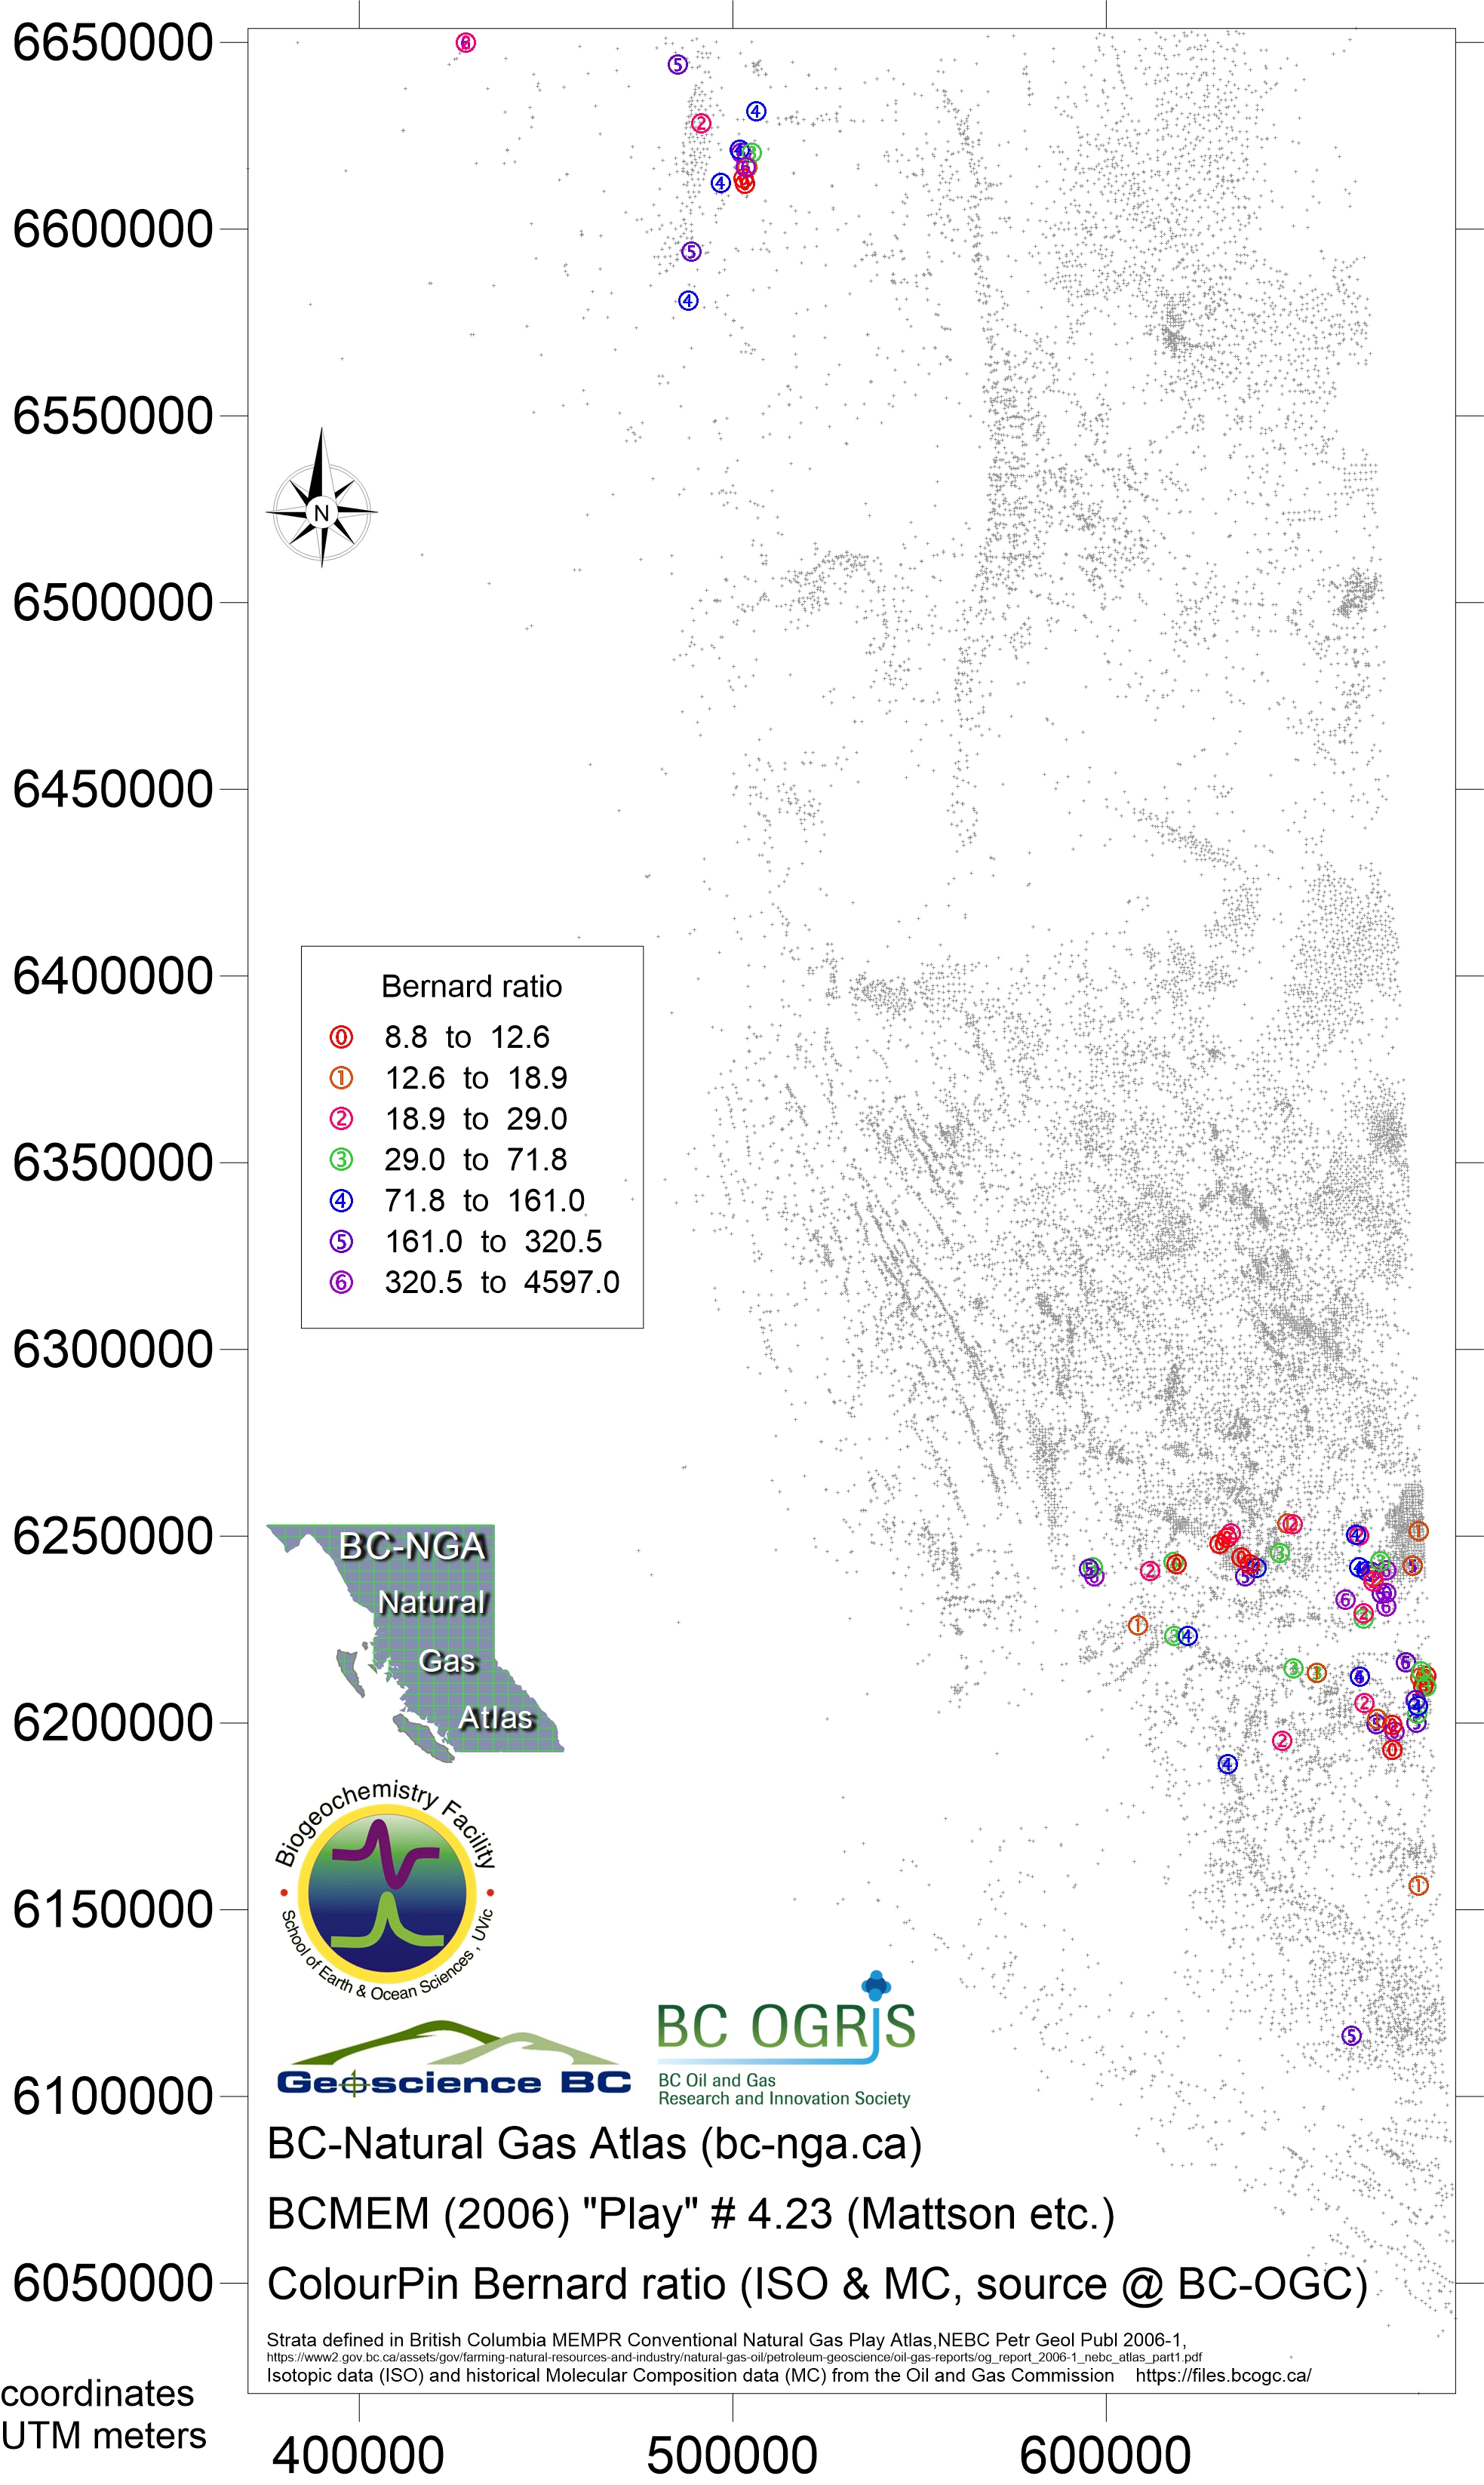
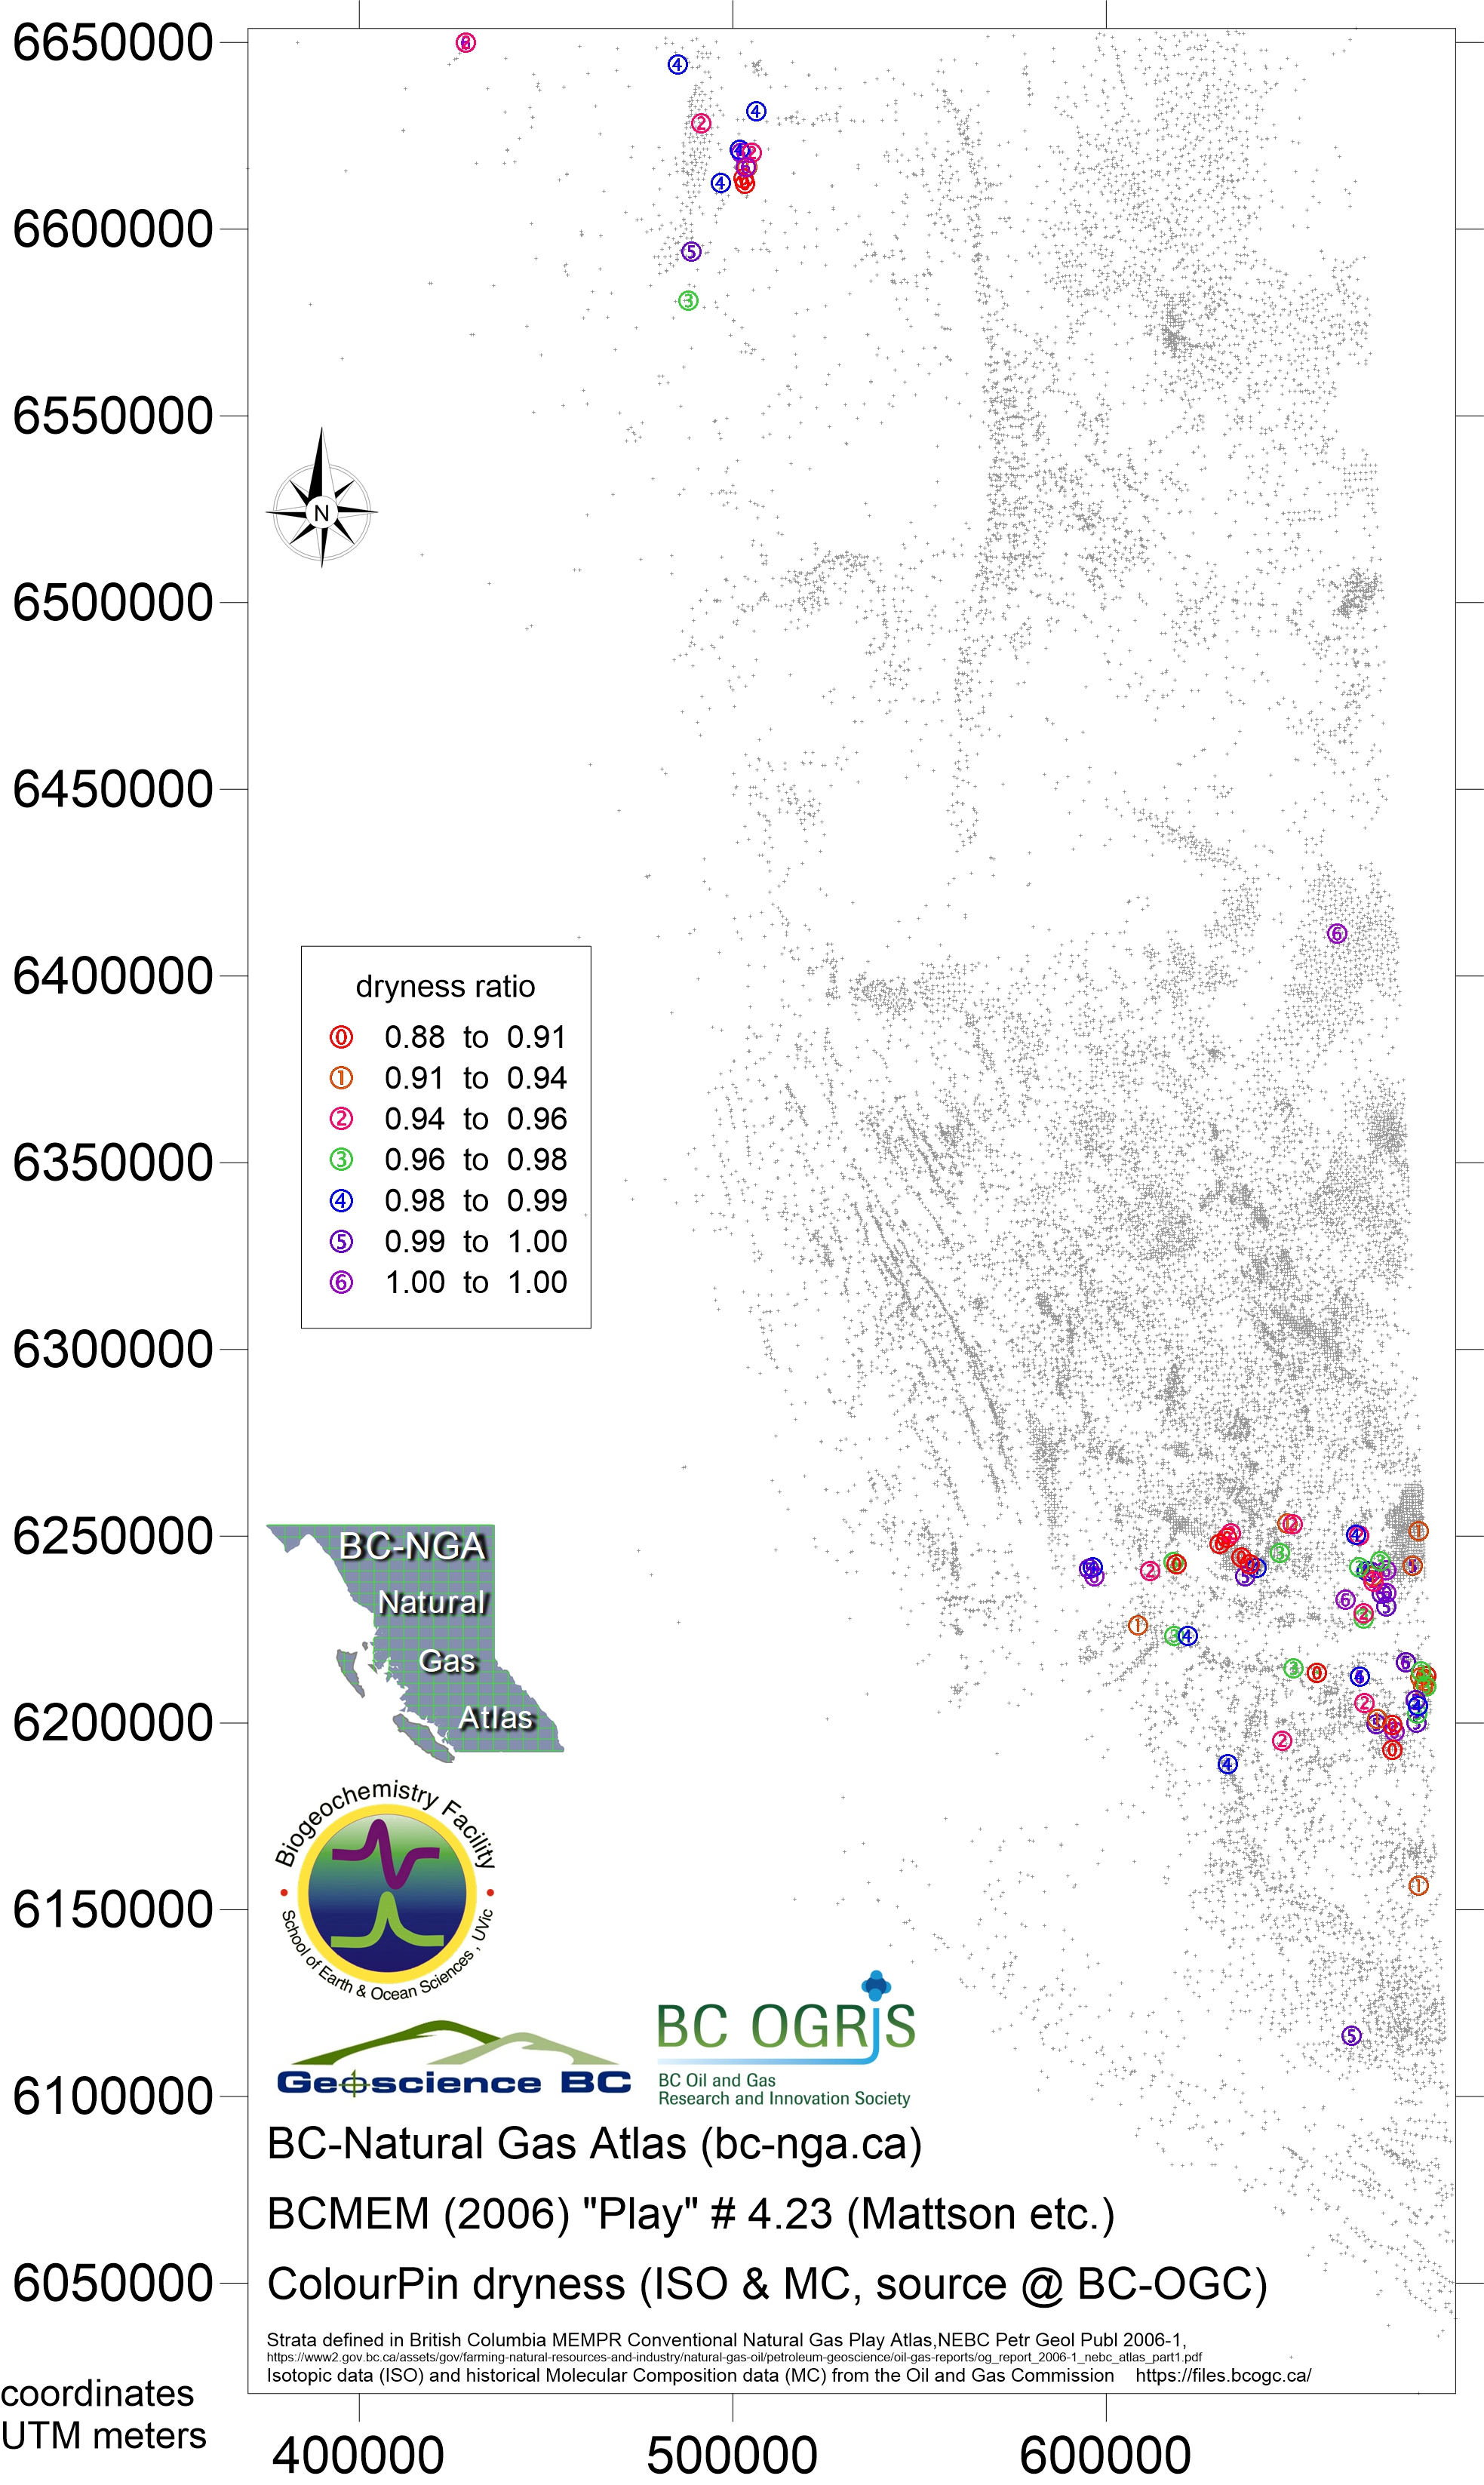
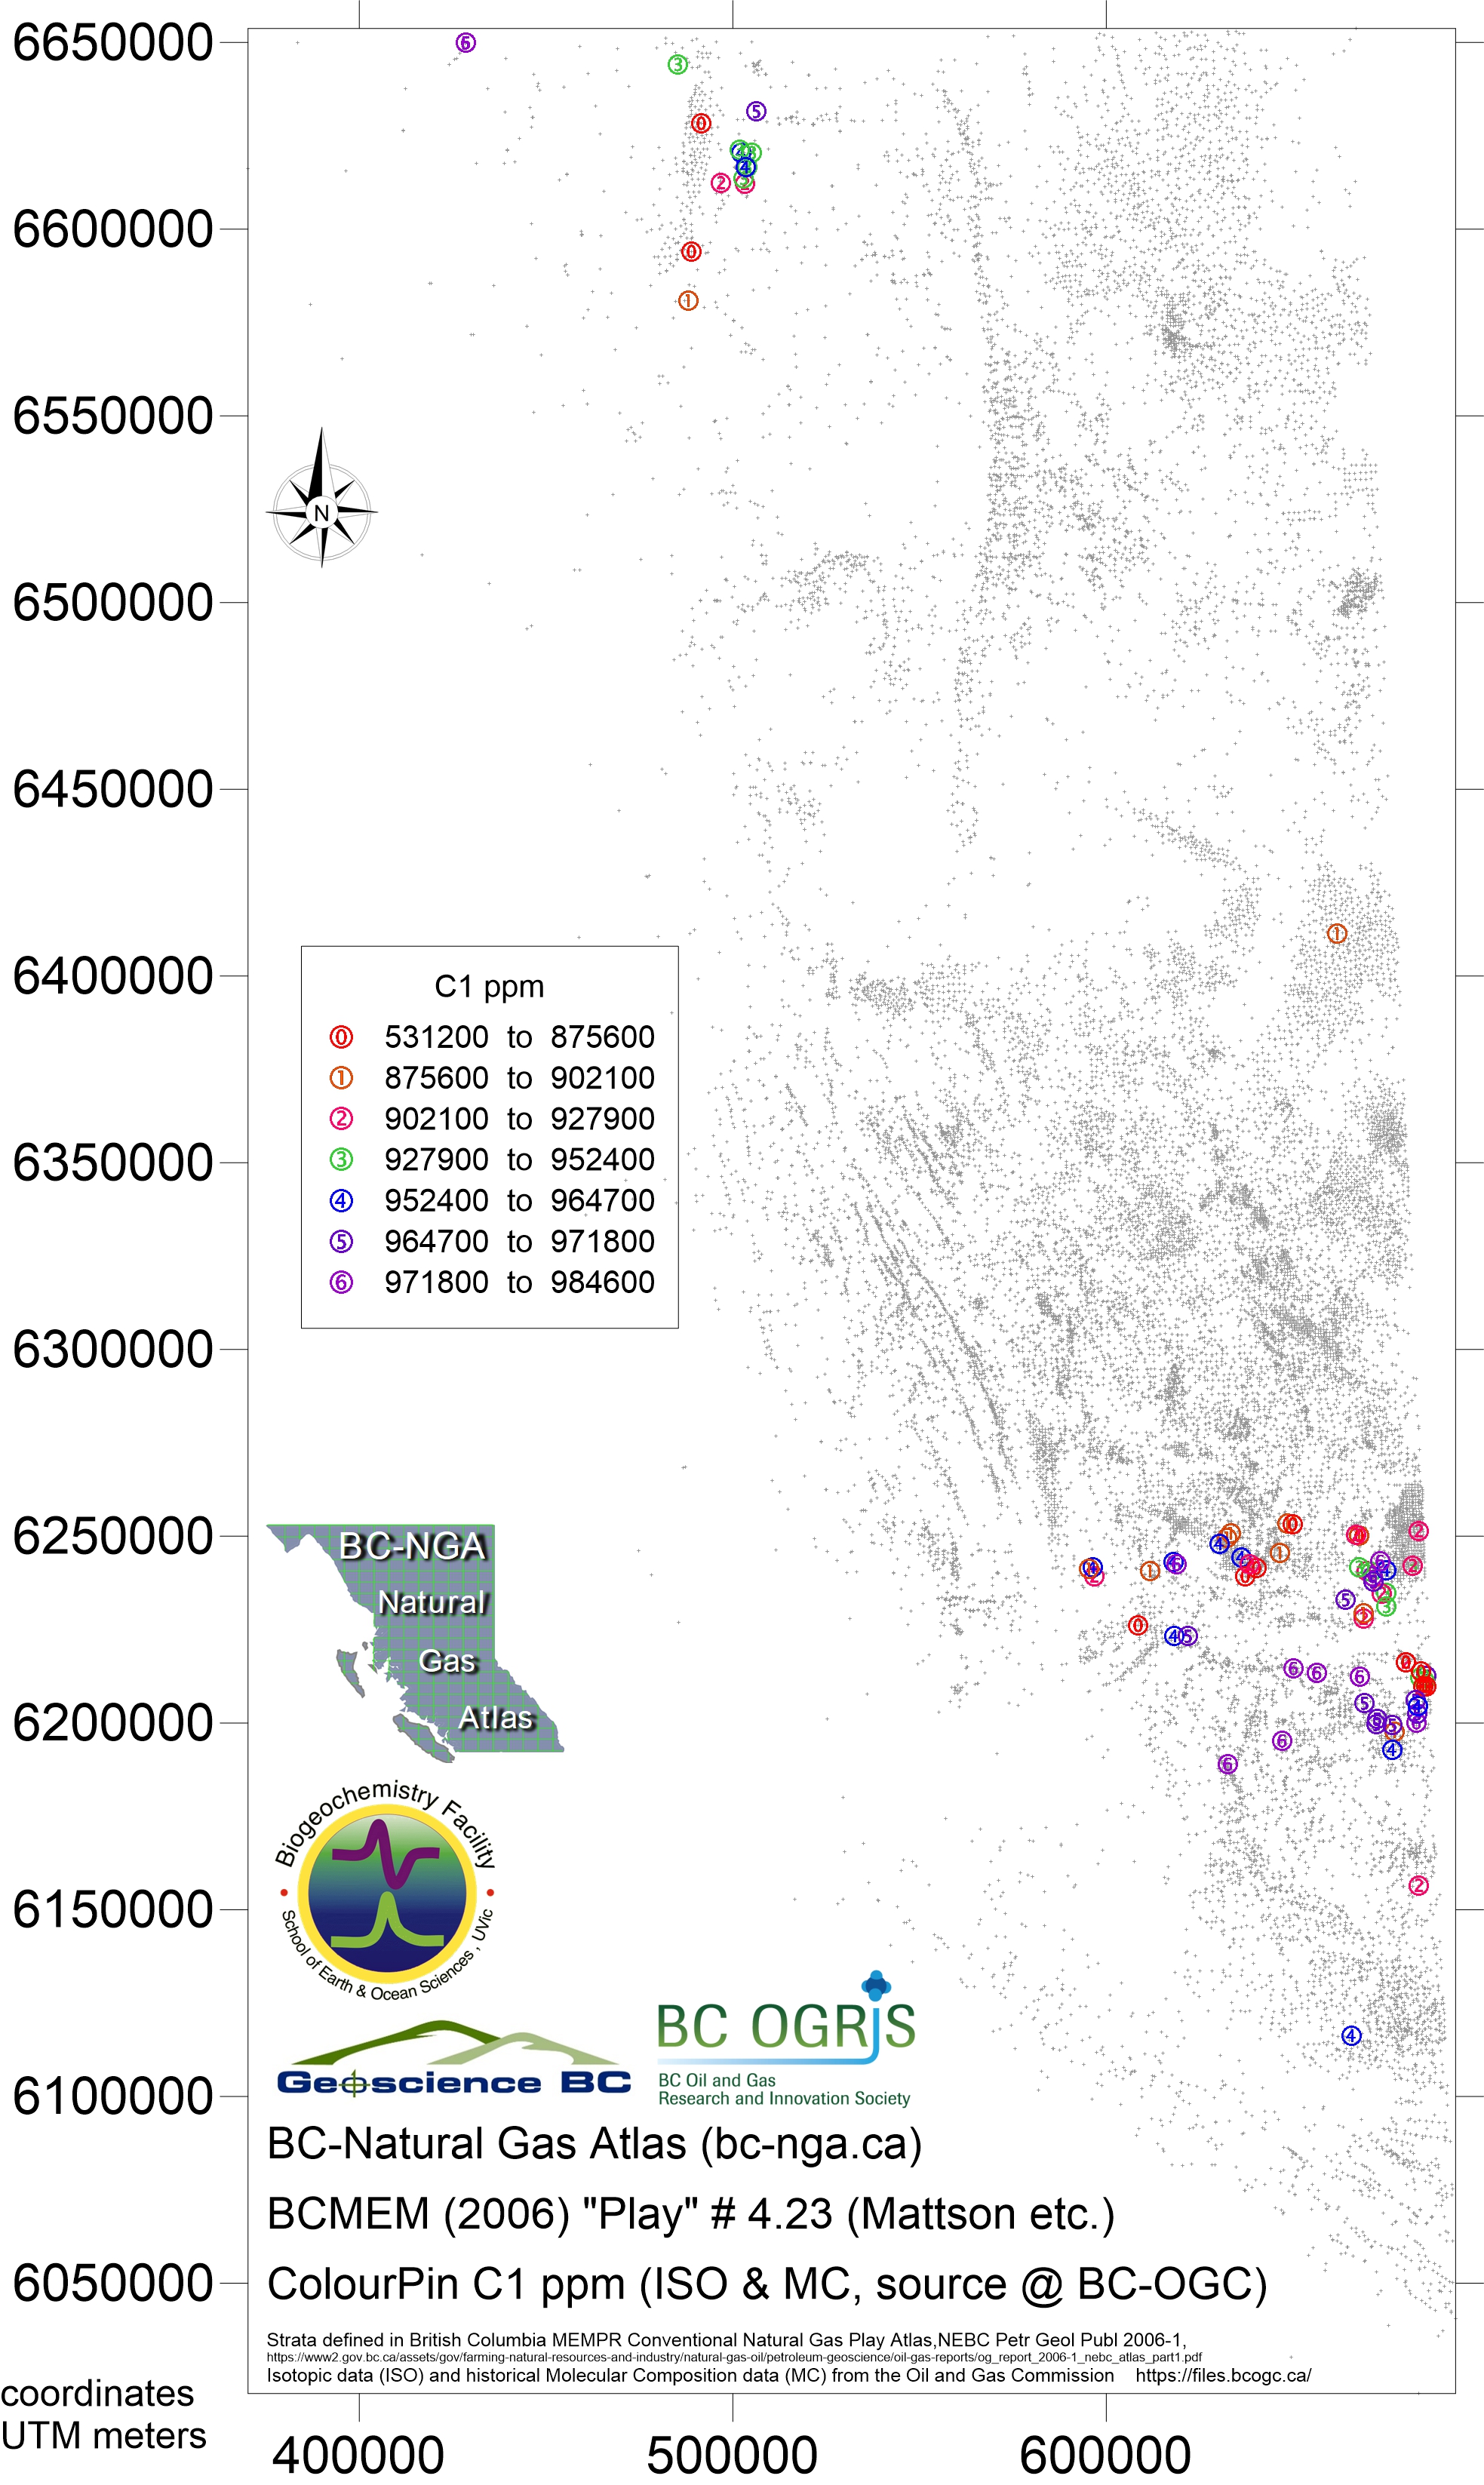
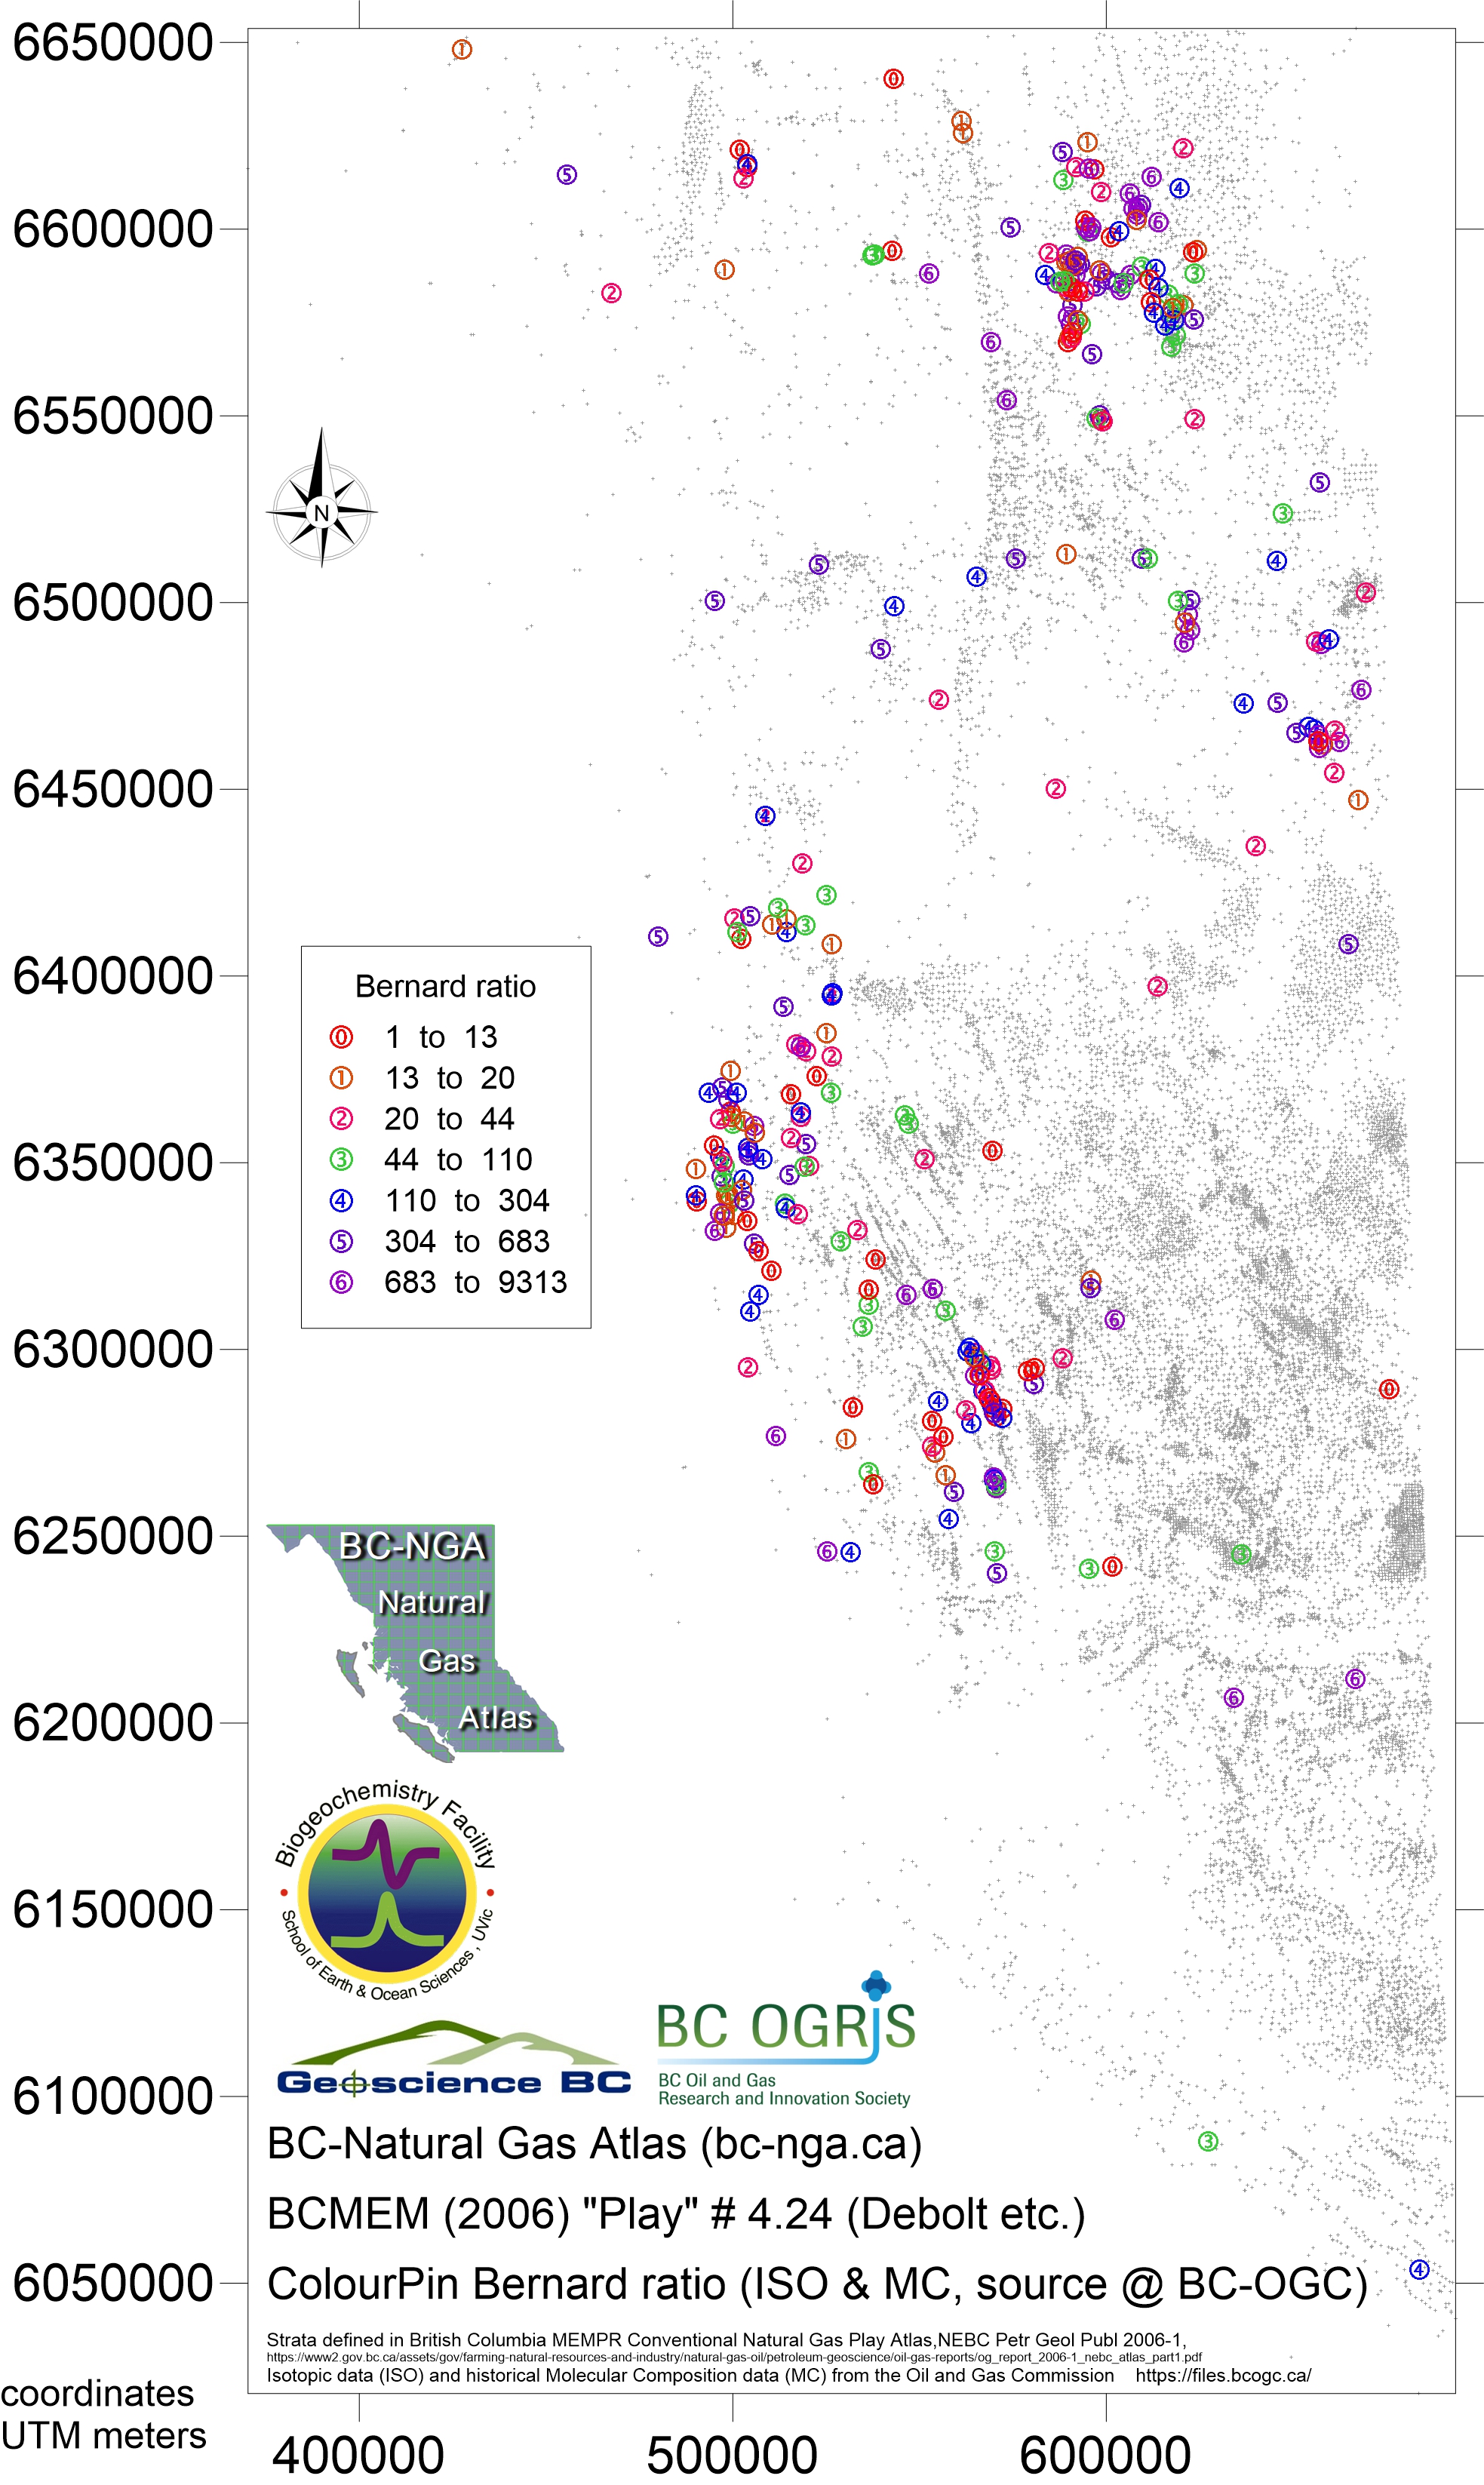
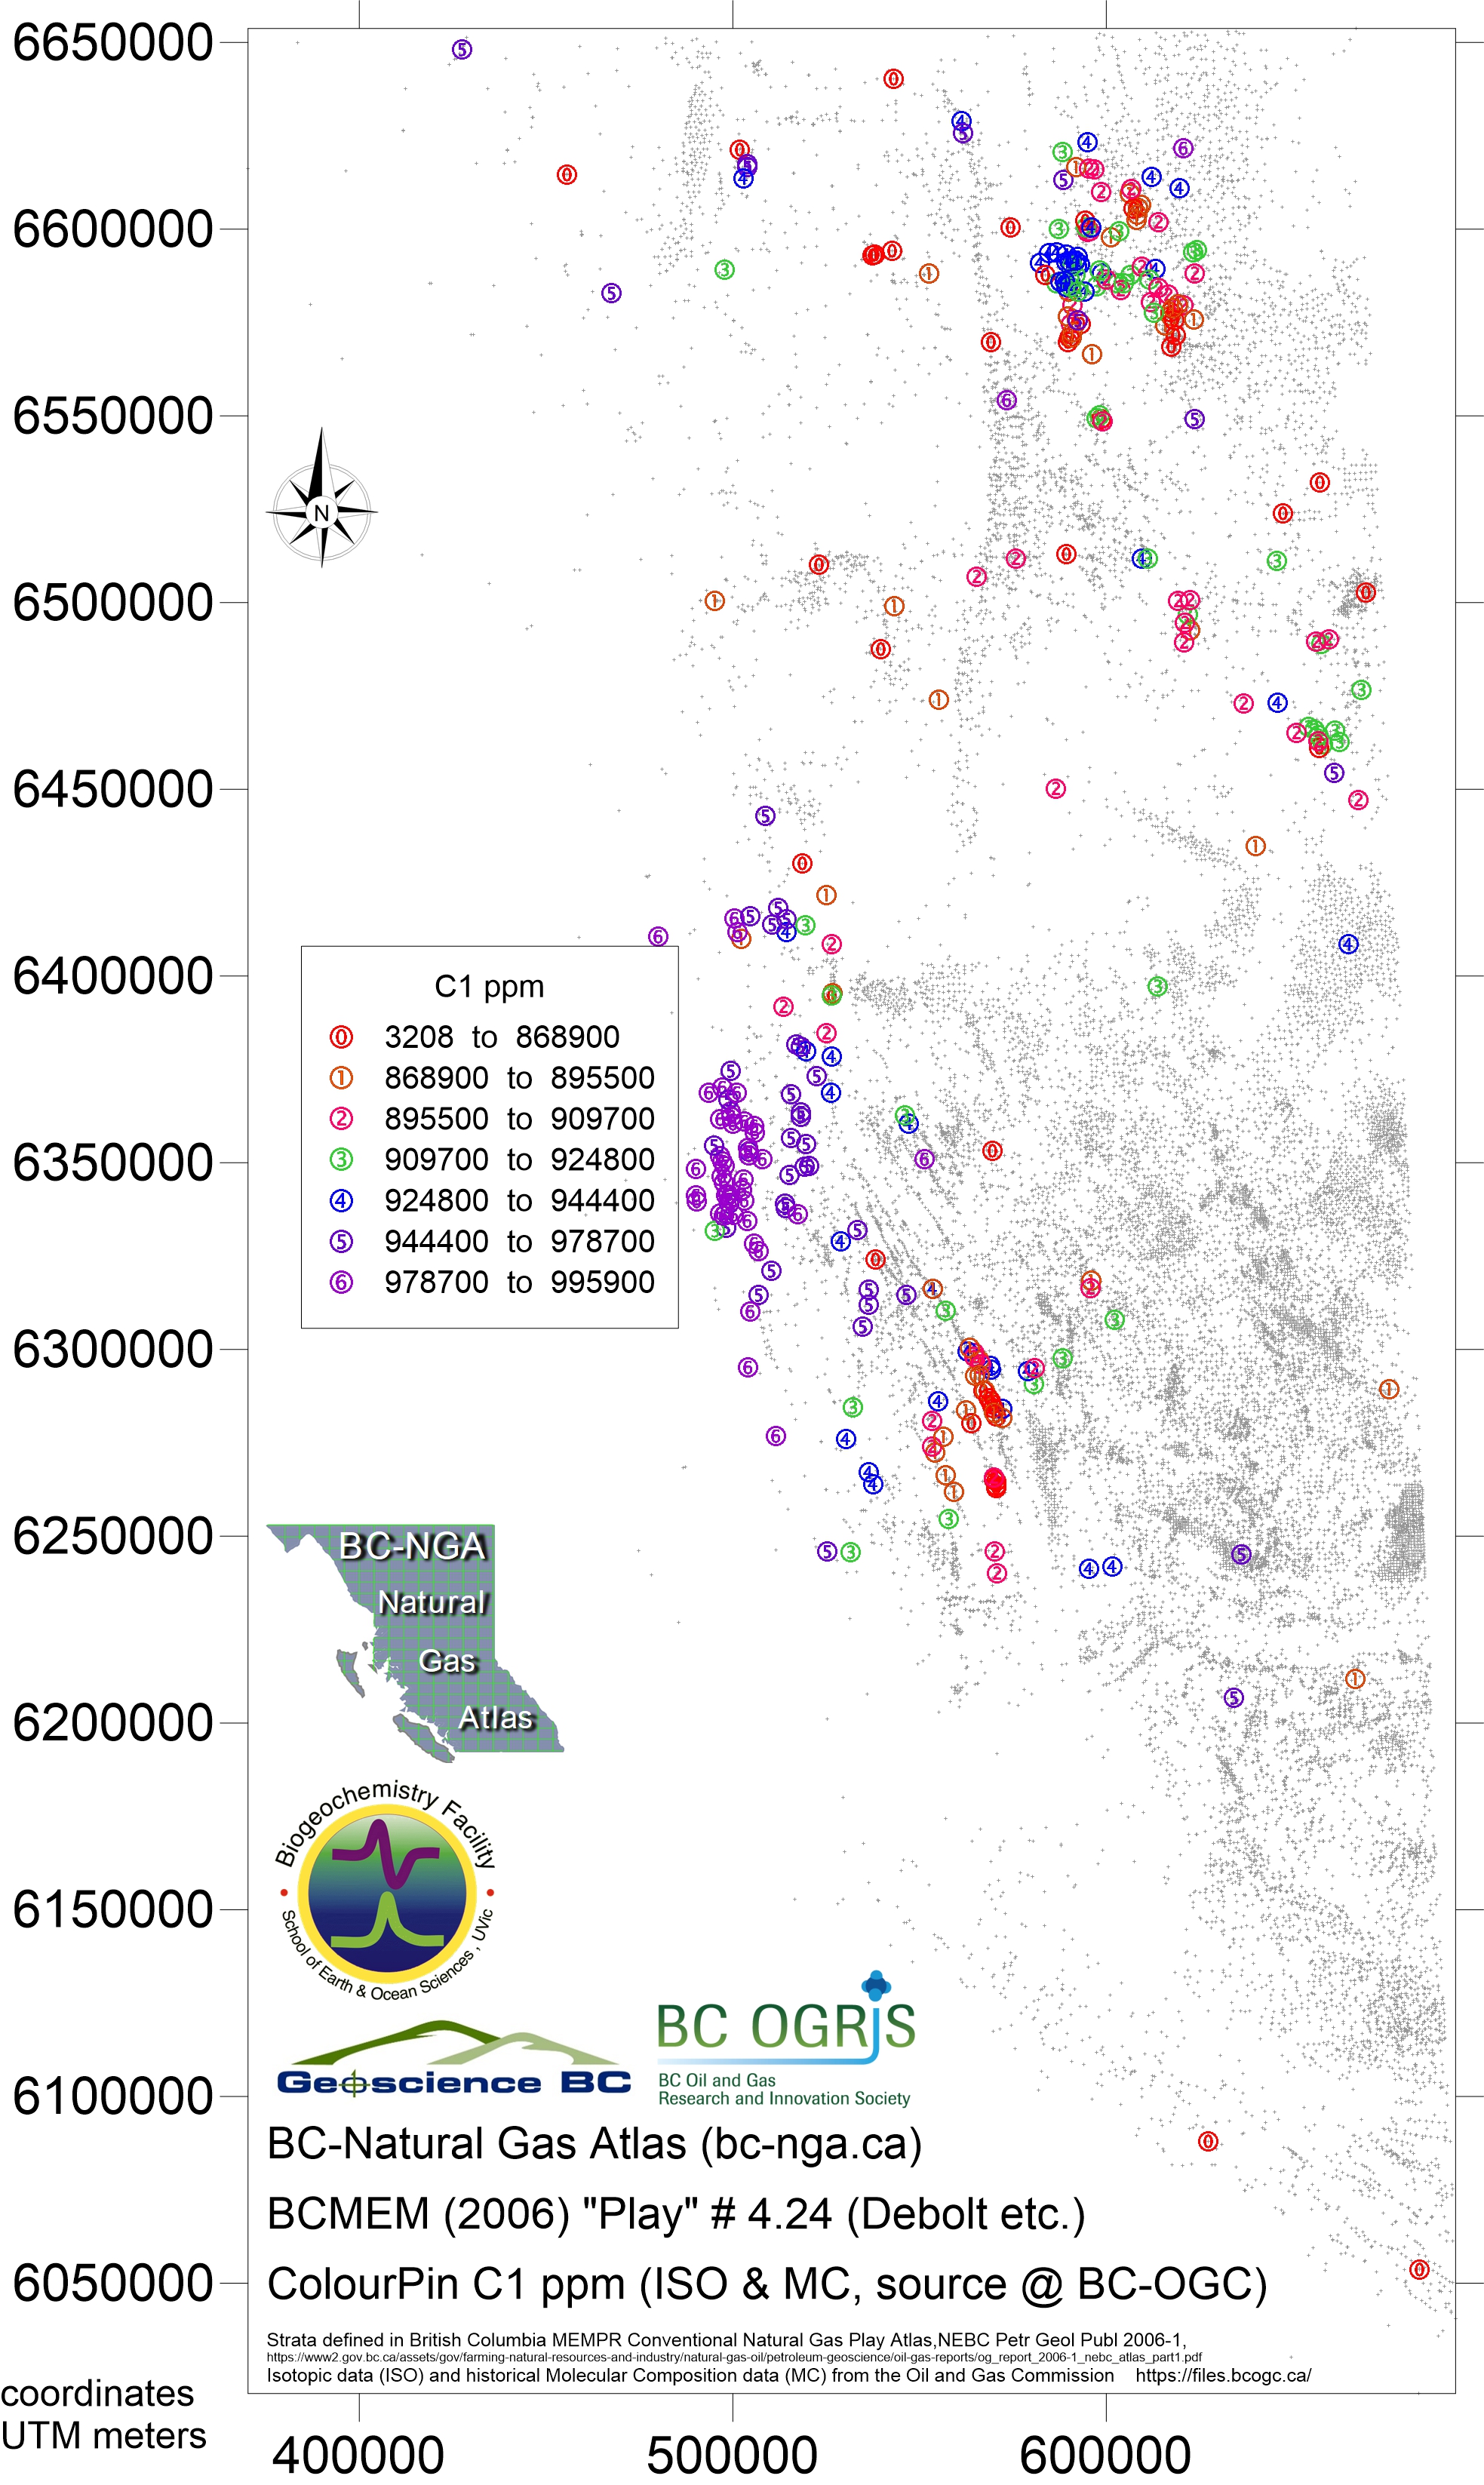
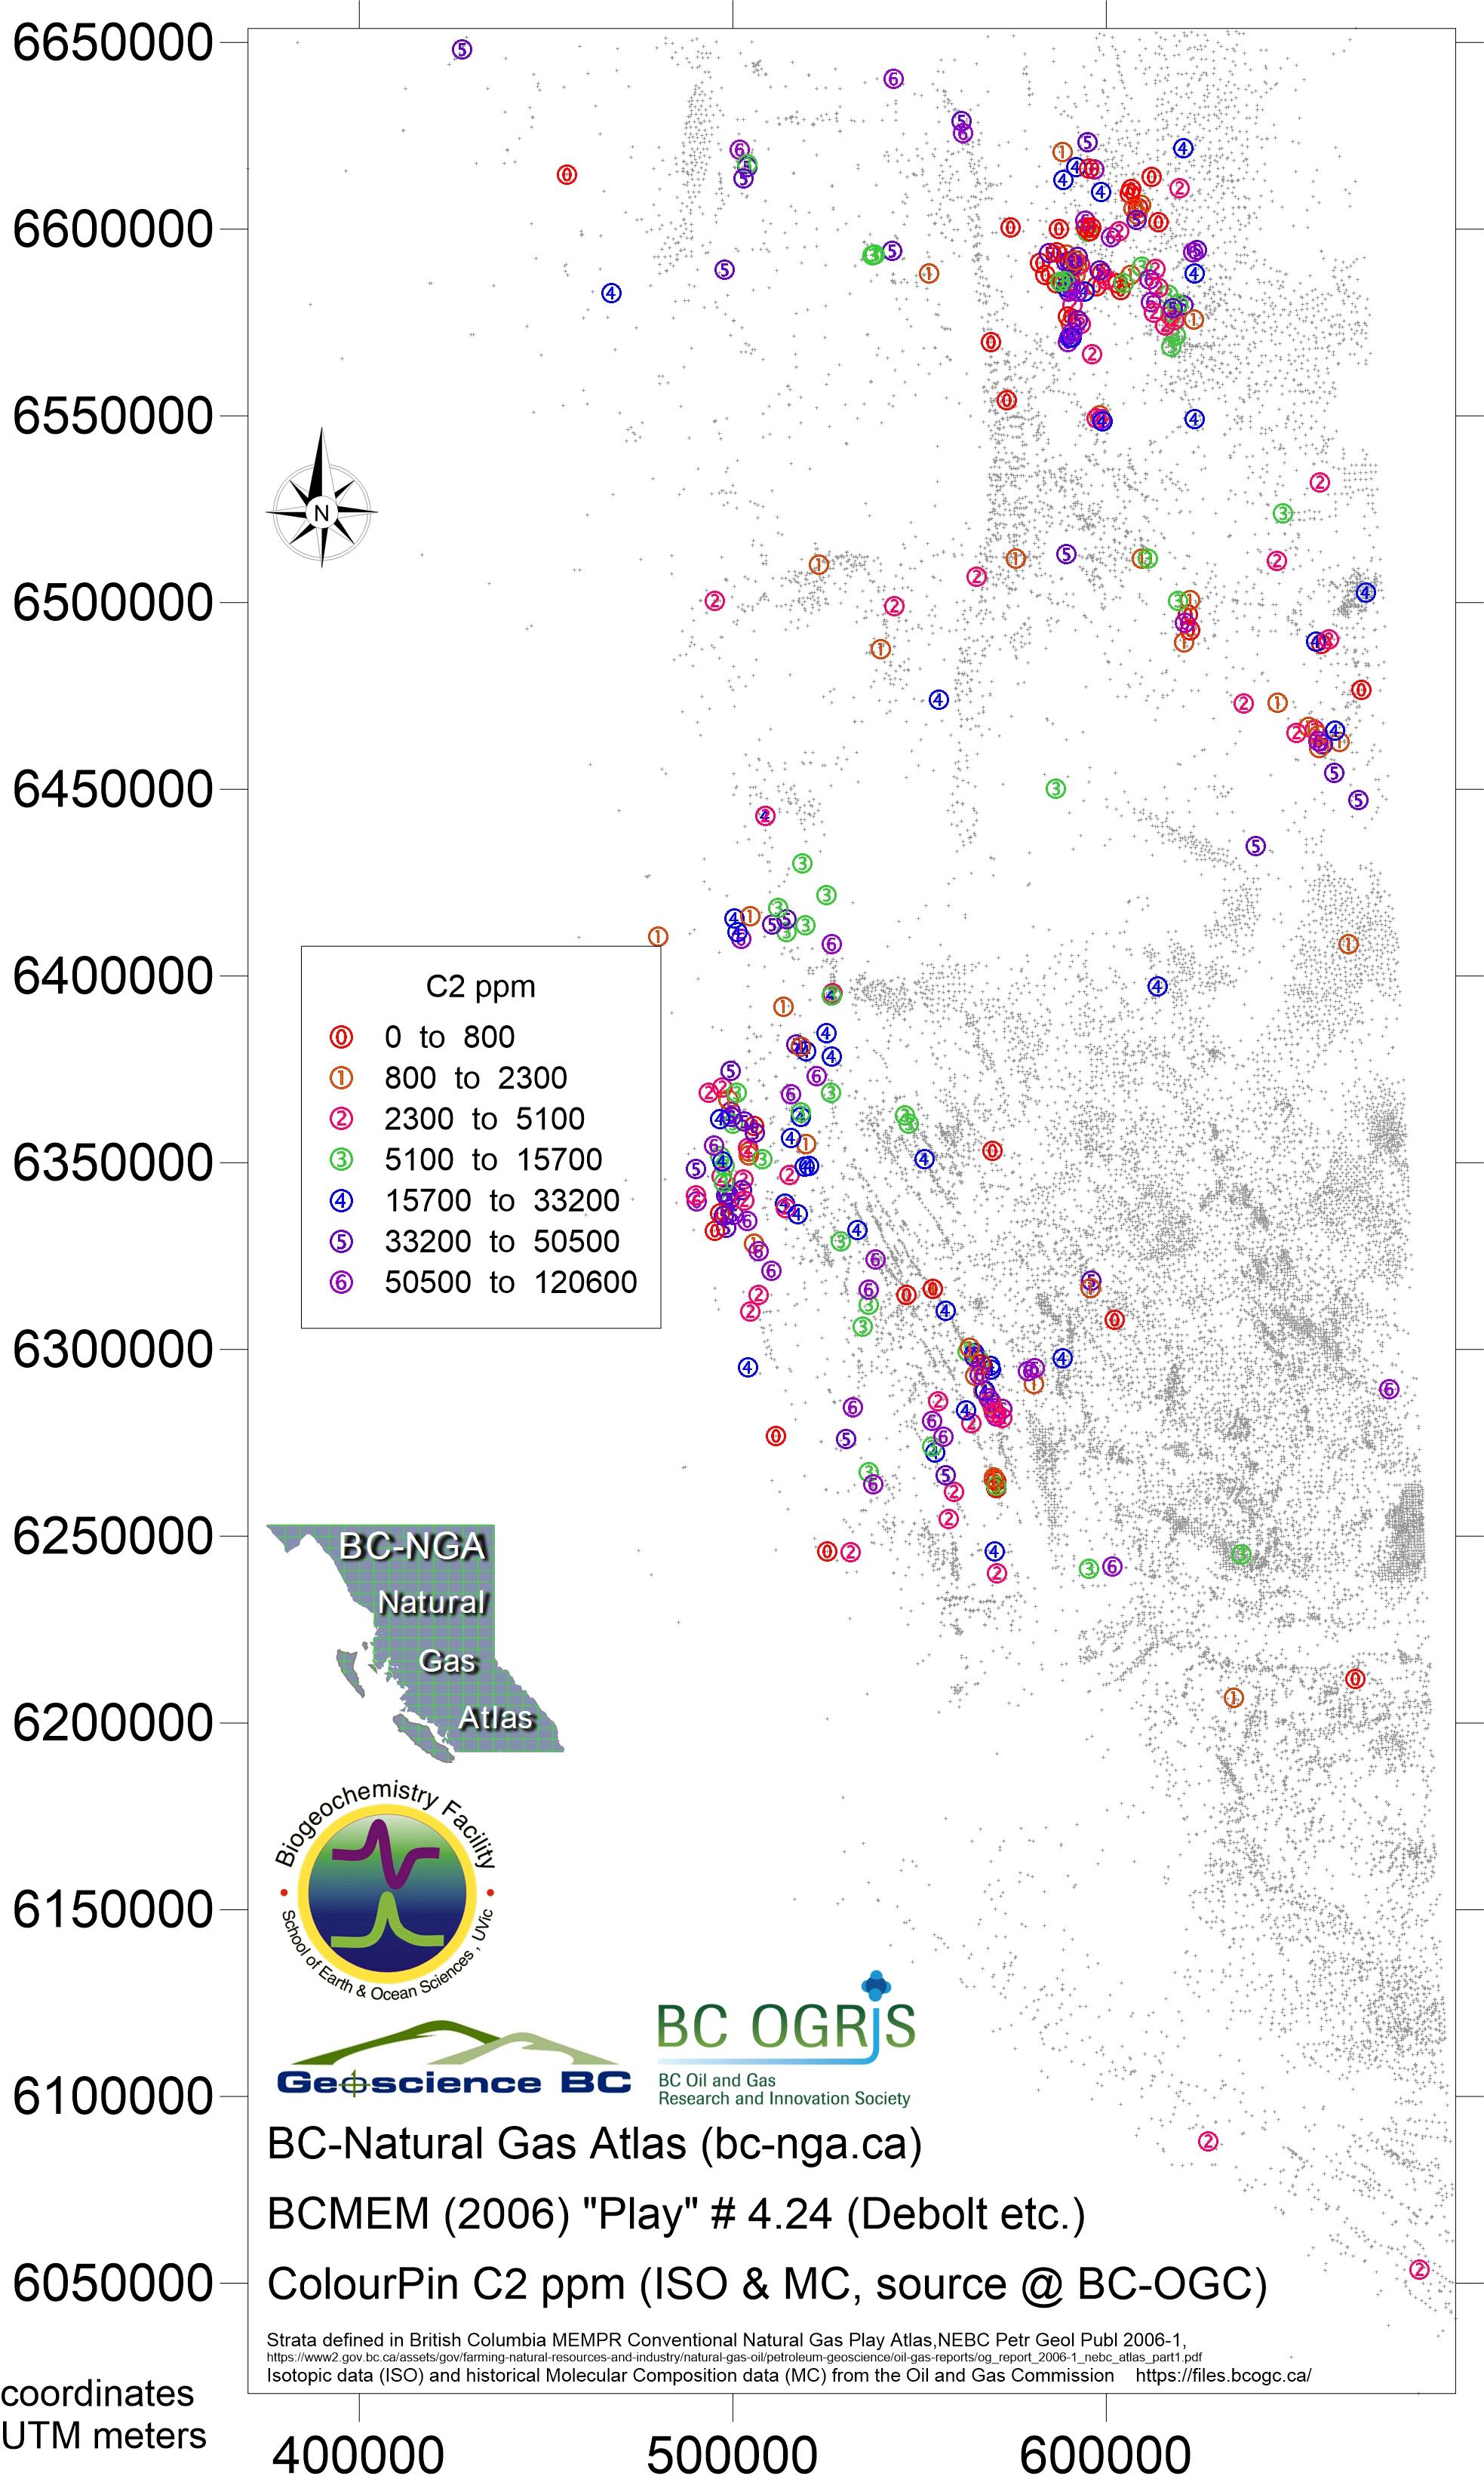
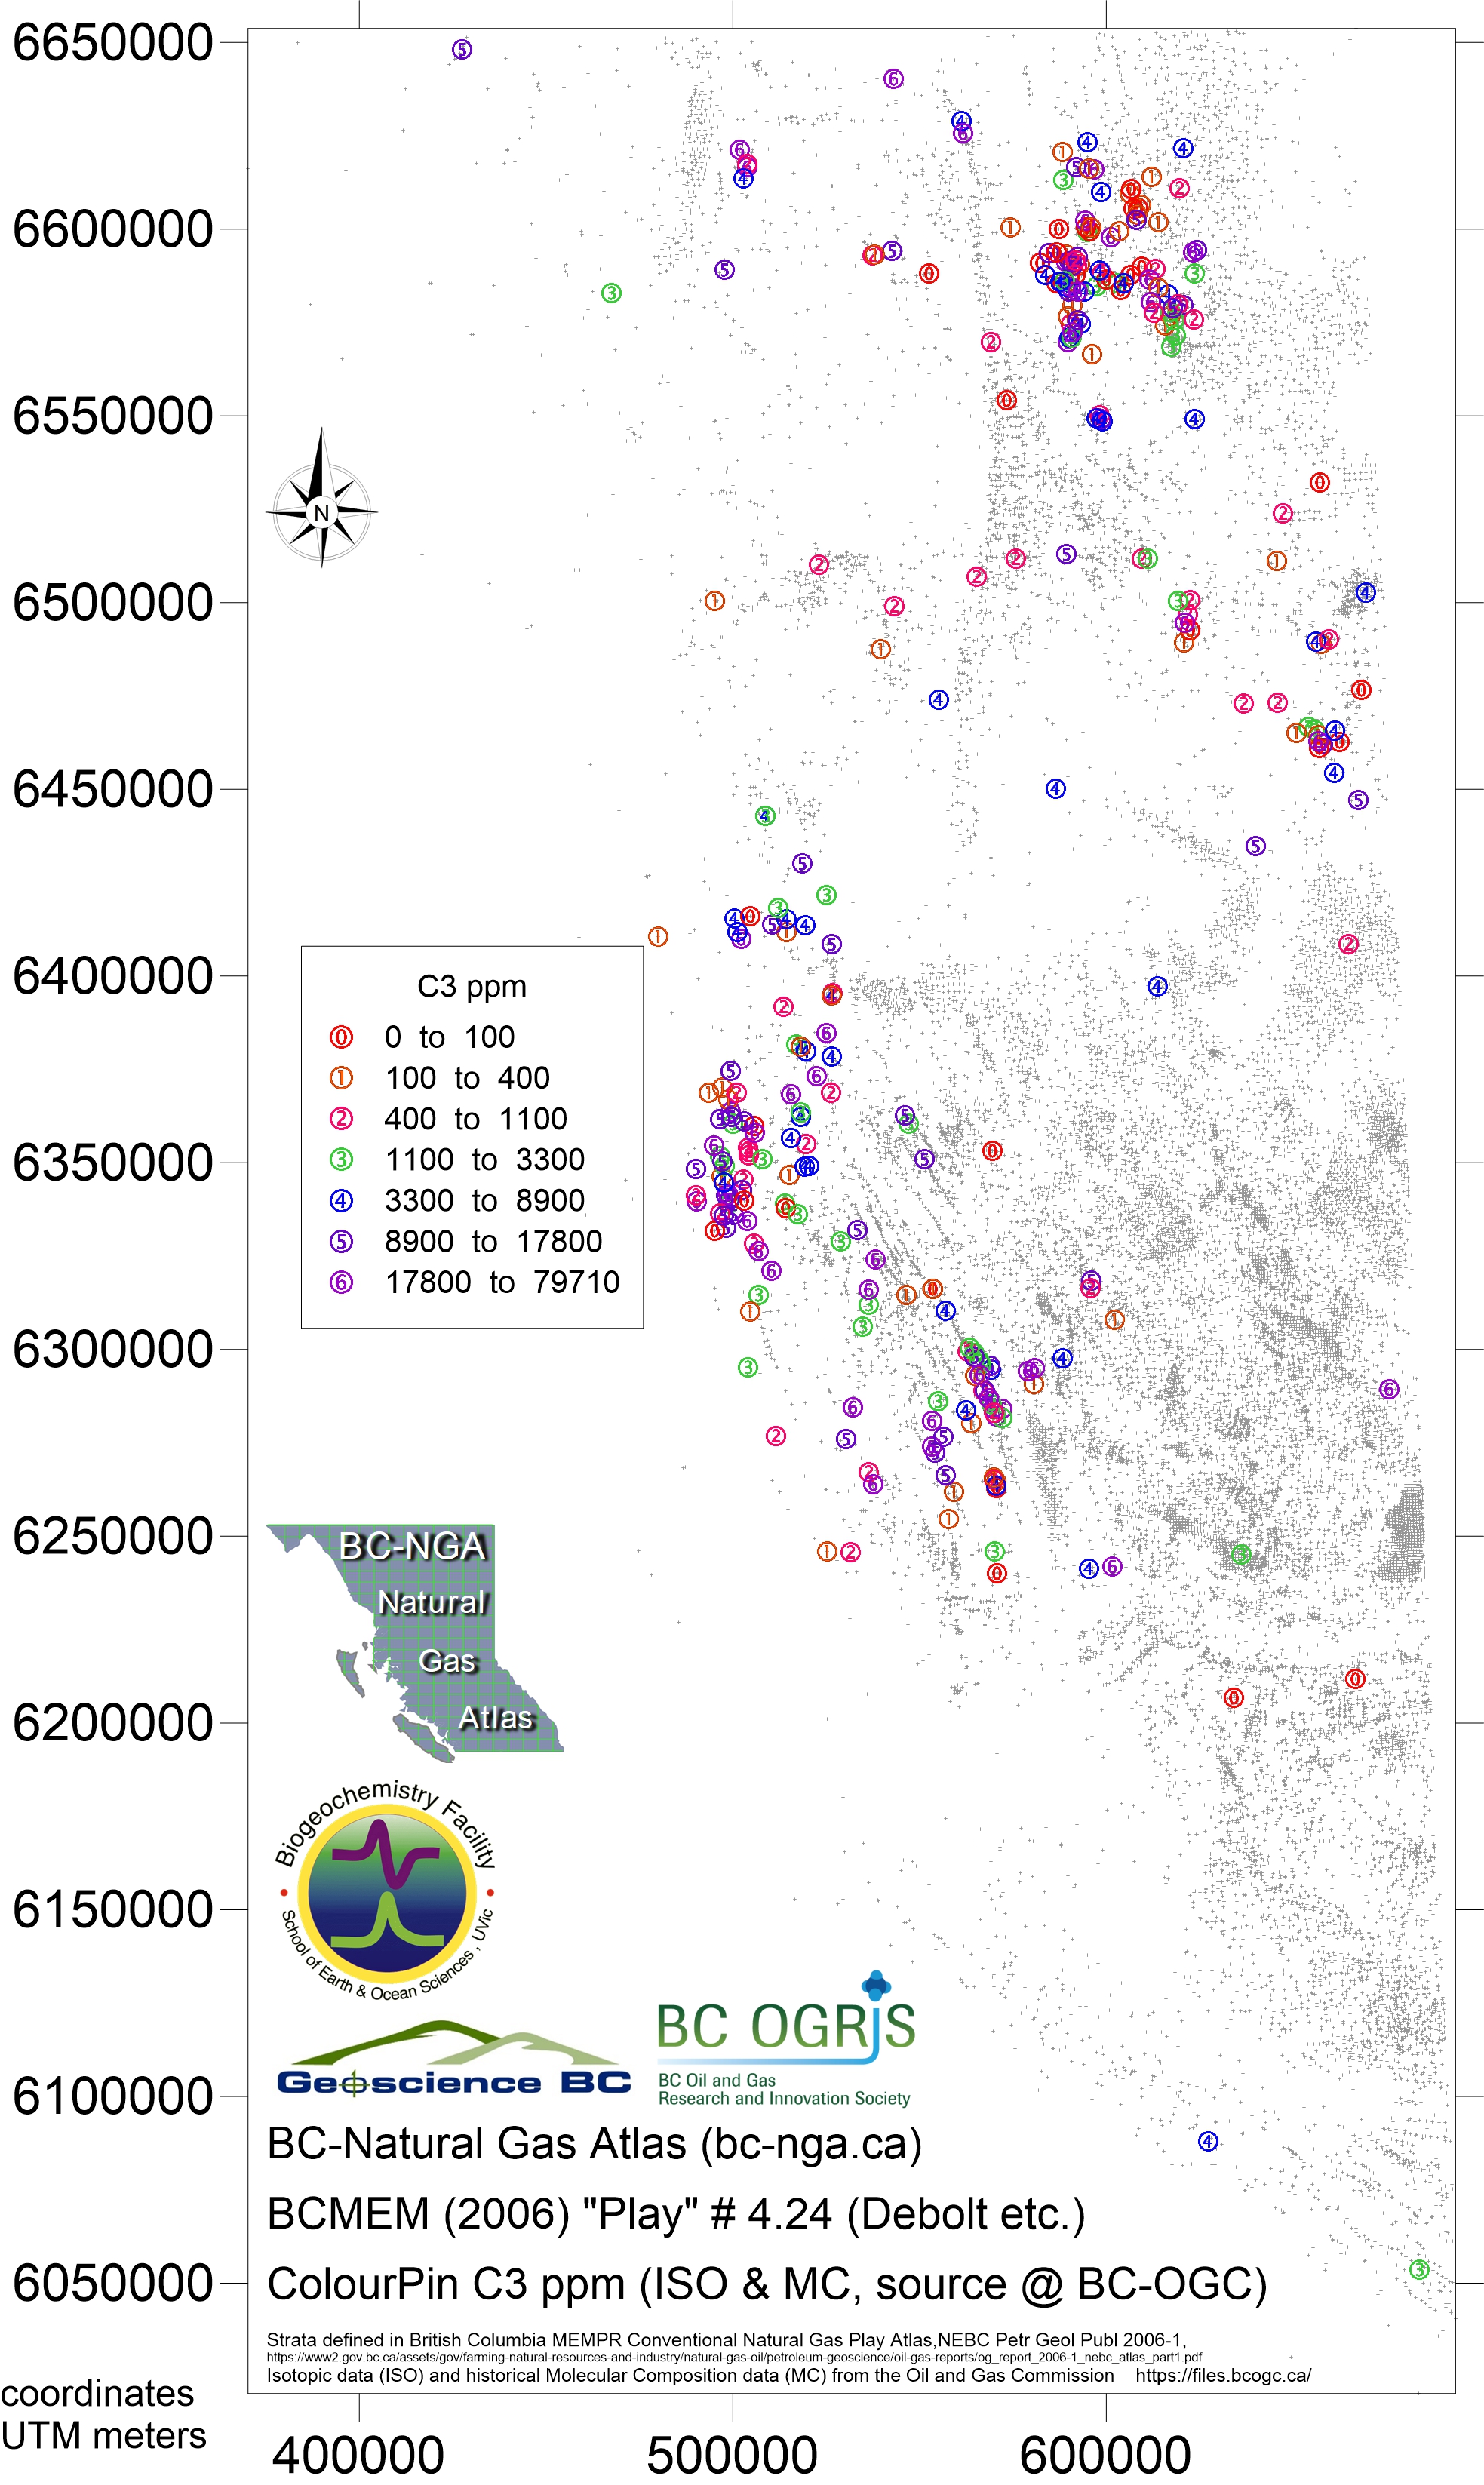
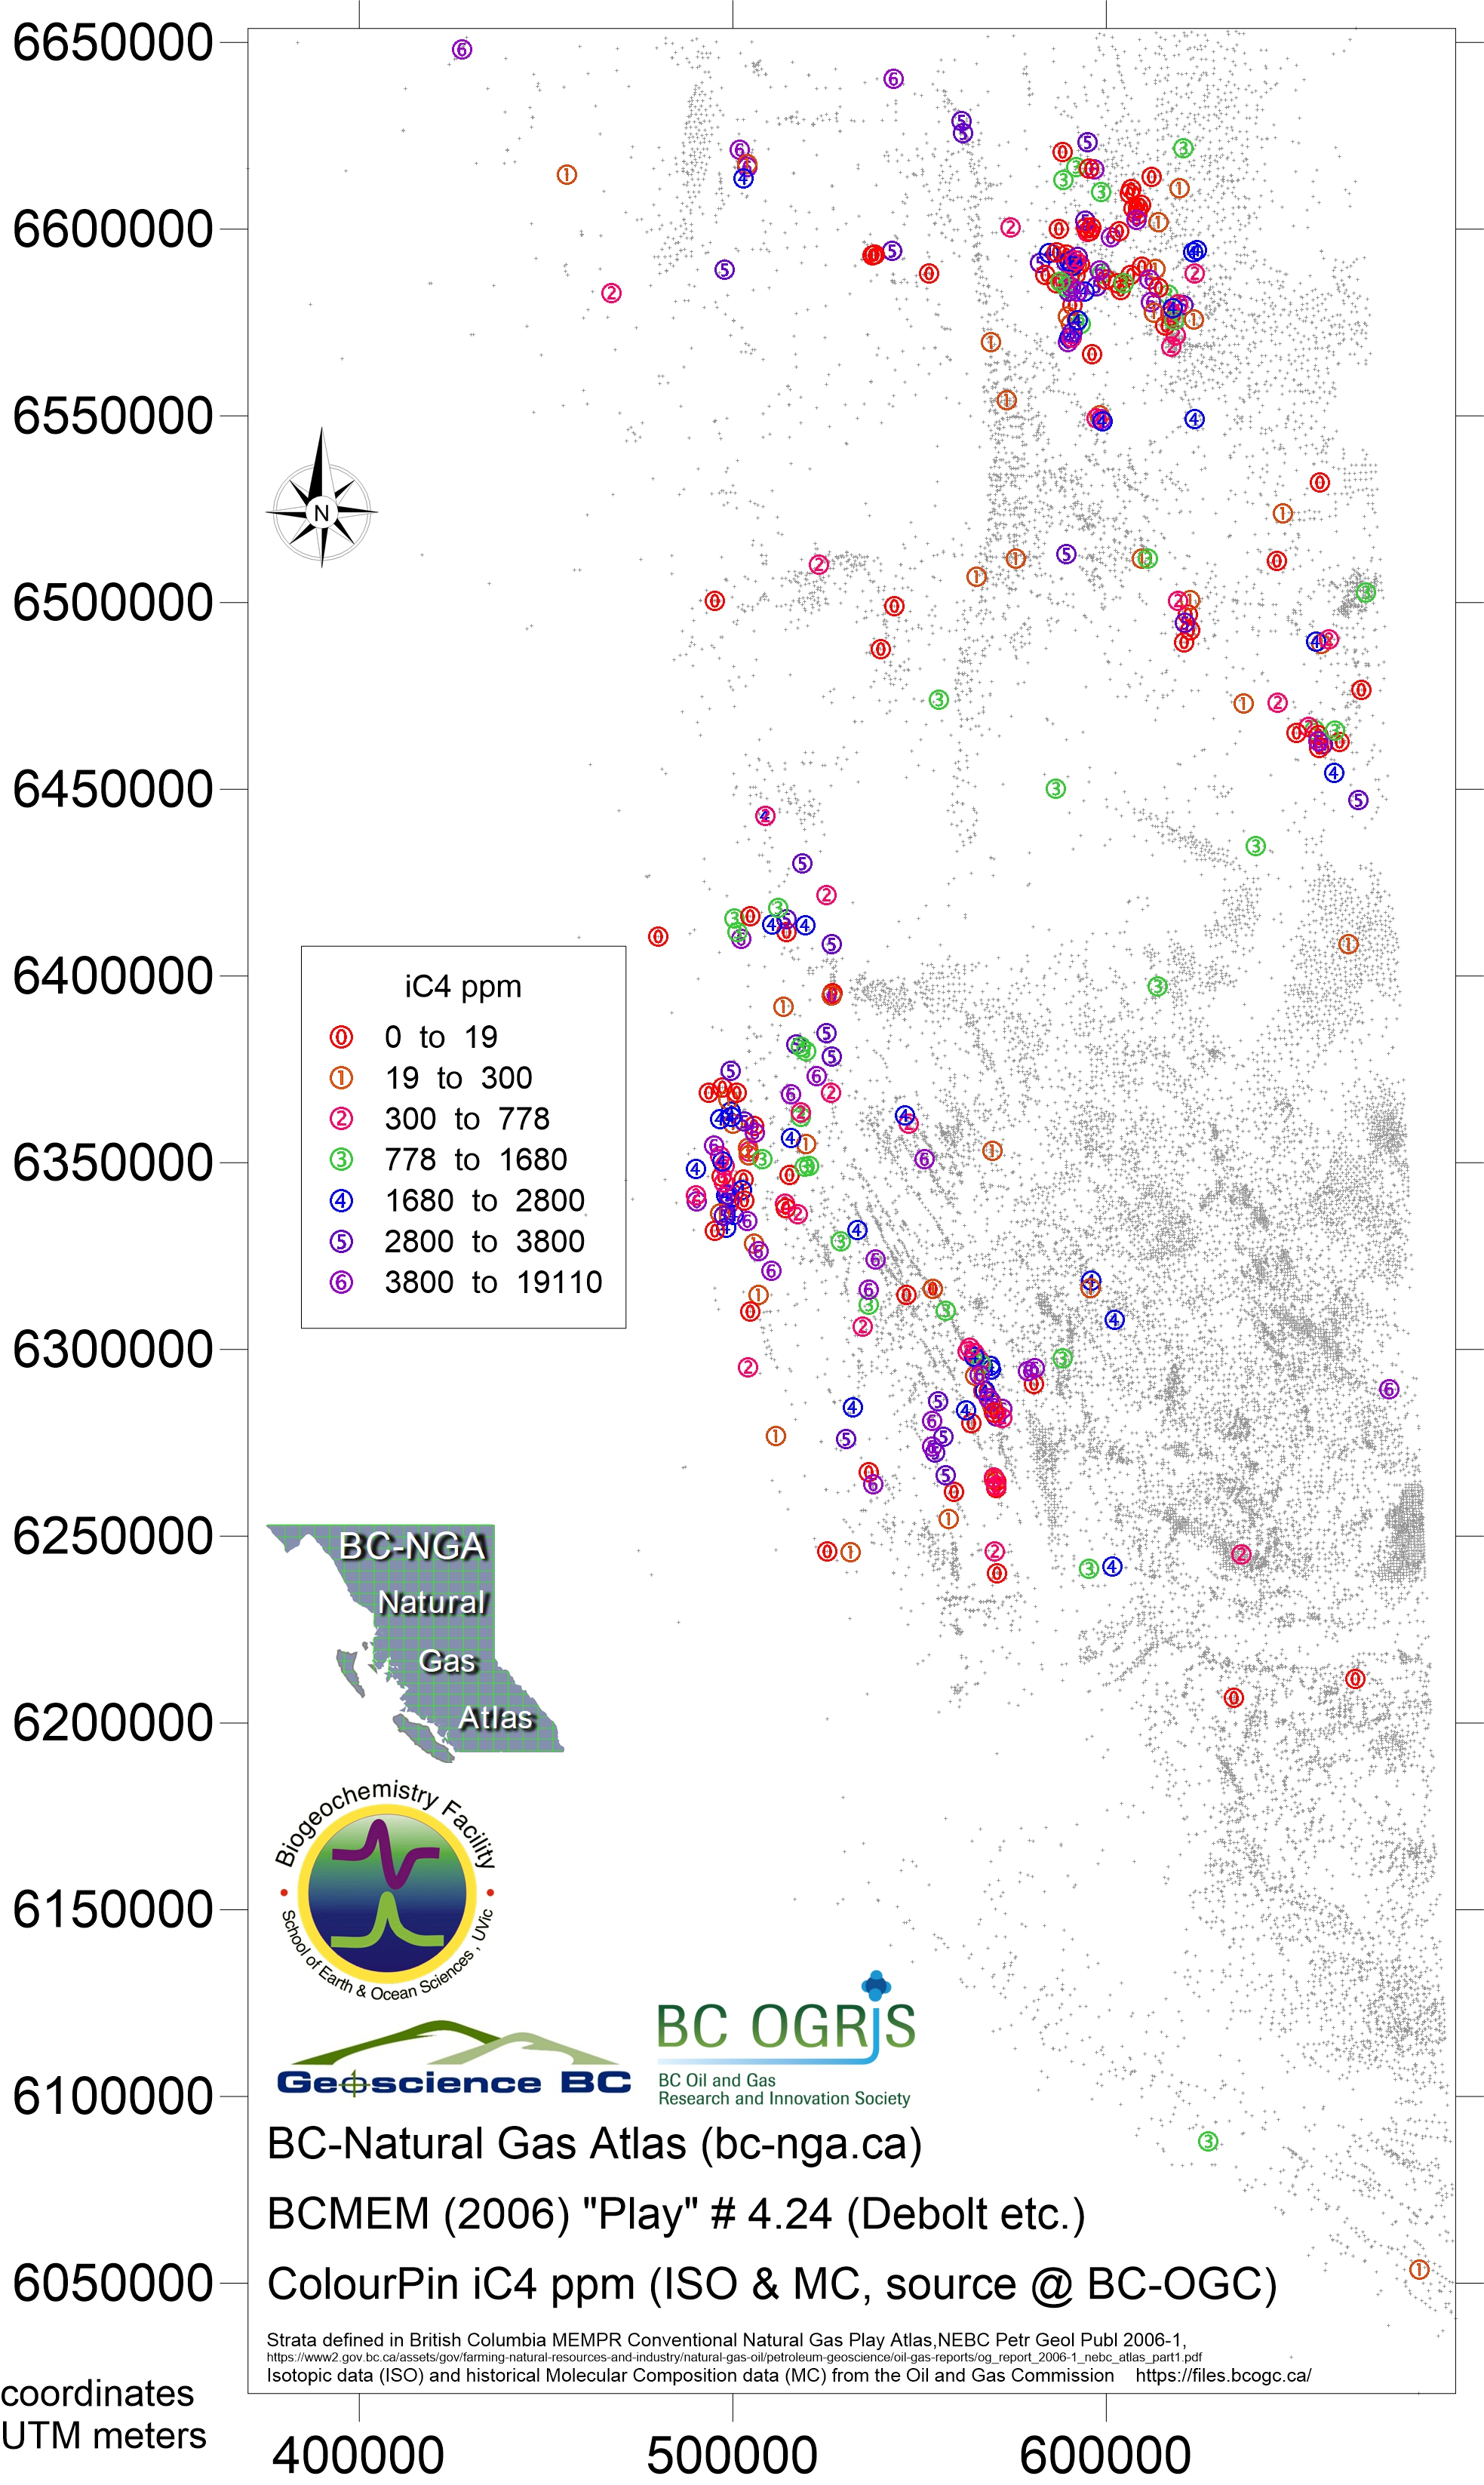
In addition to the profiles shown in the thesis, the data was also represented in a series of maps where each play had a different number of variables being mapped depending on what data was available.
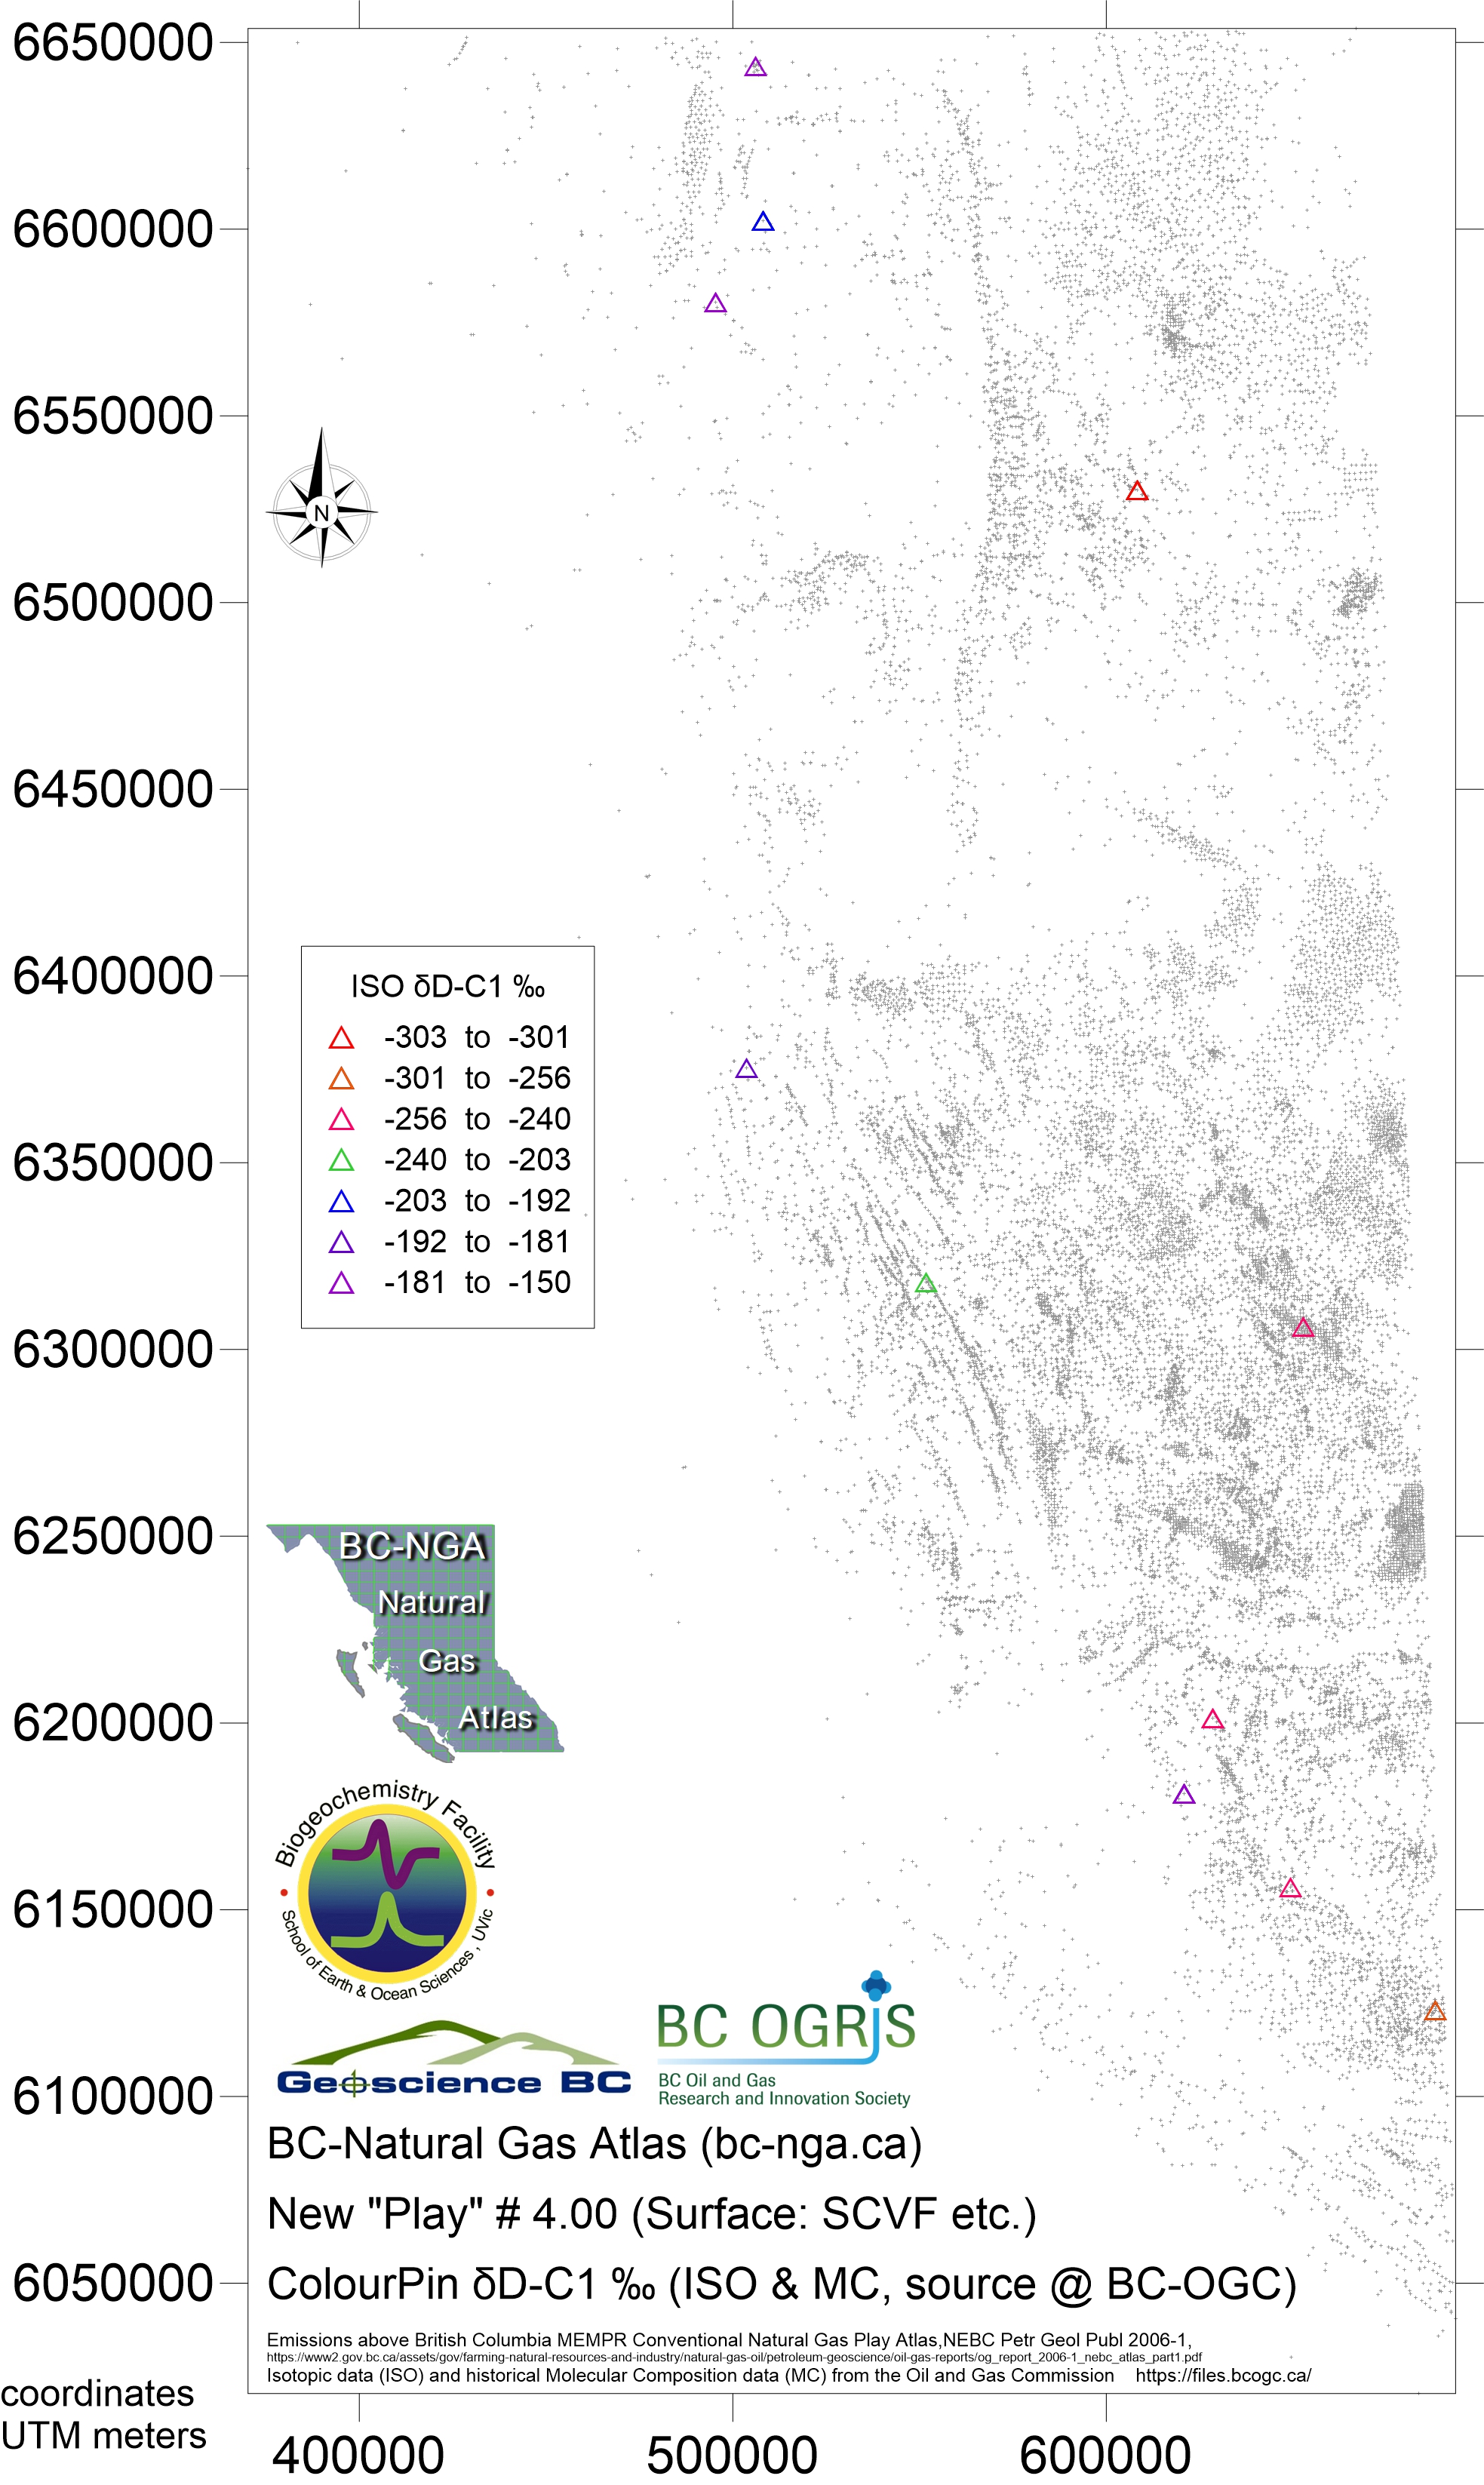
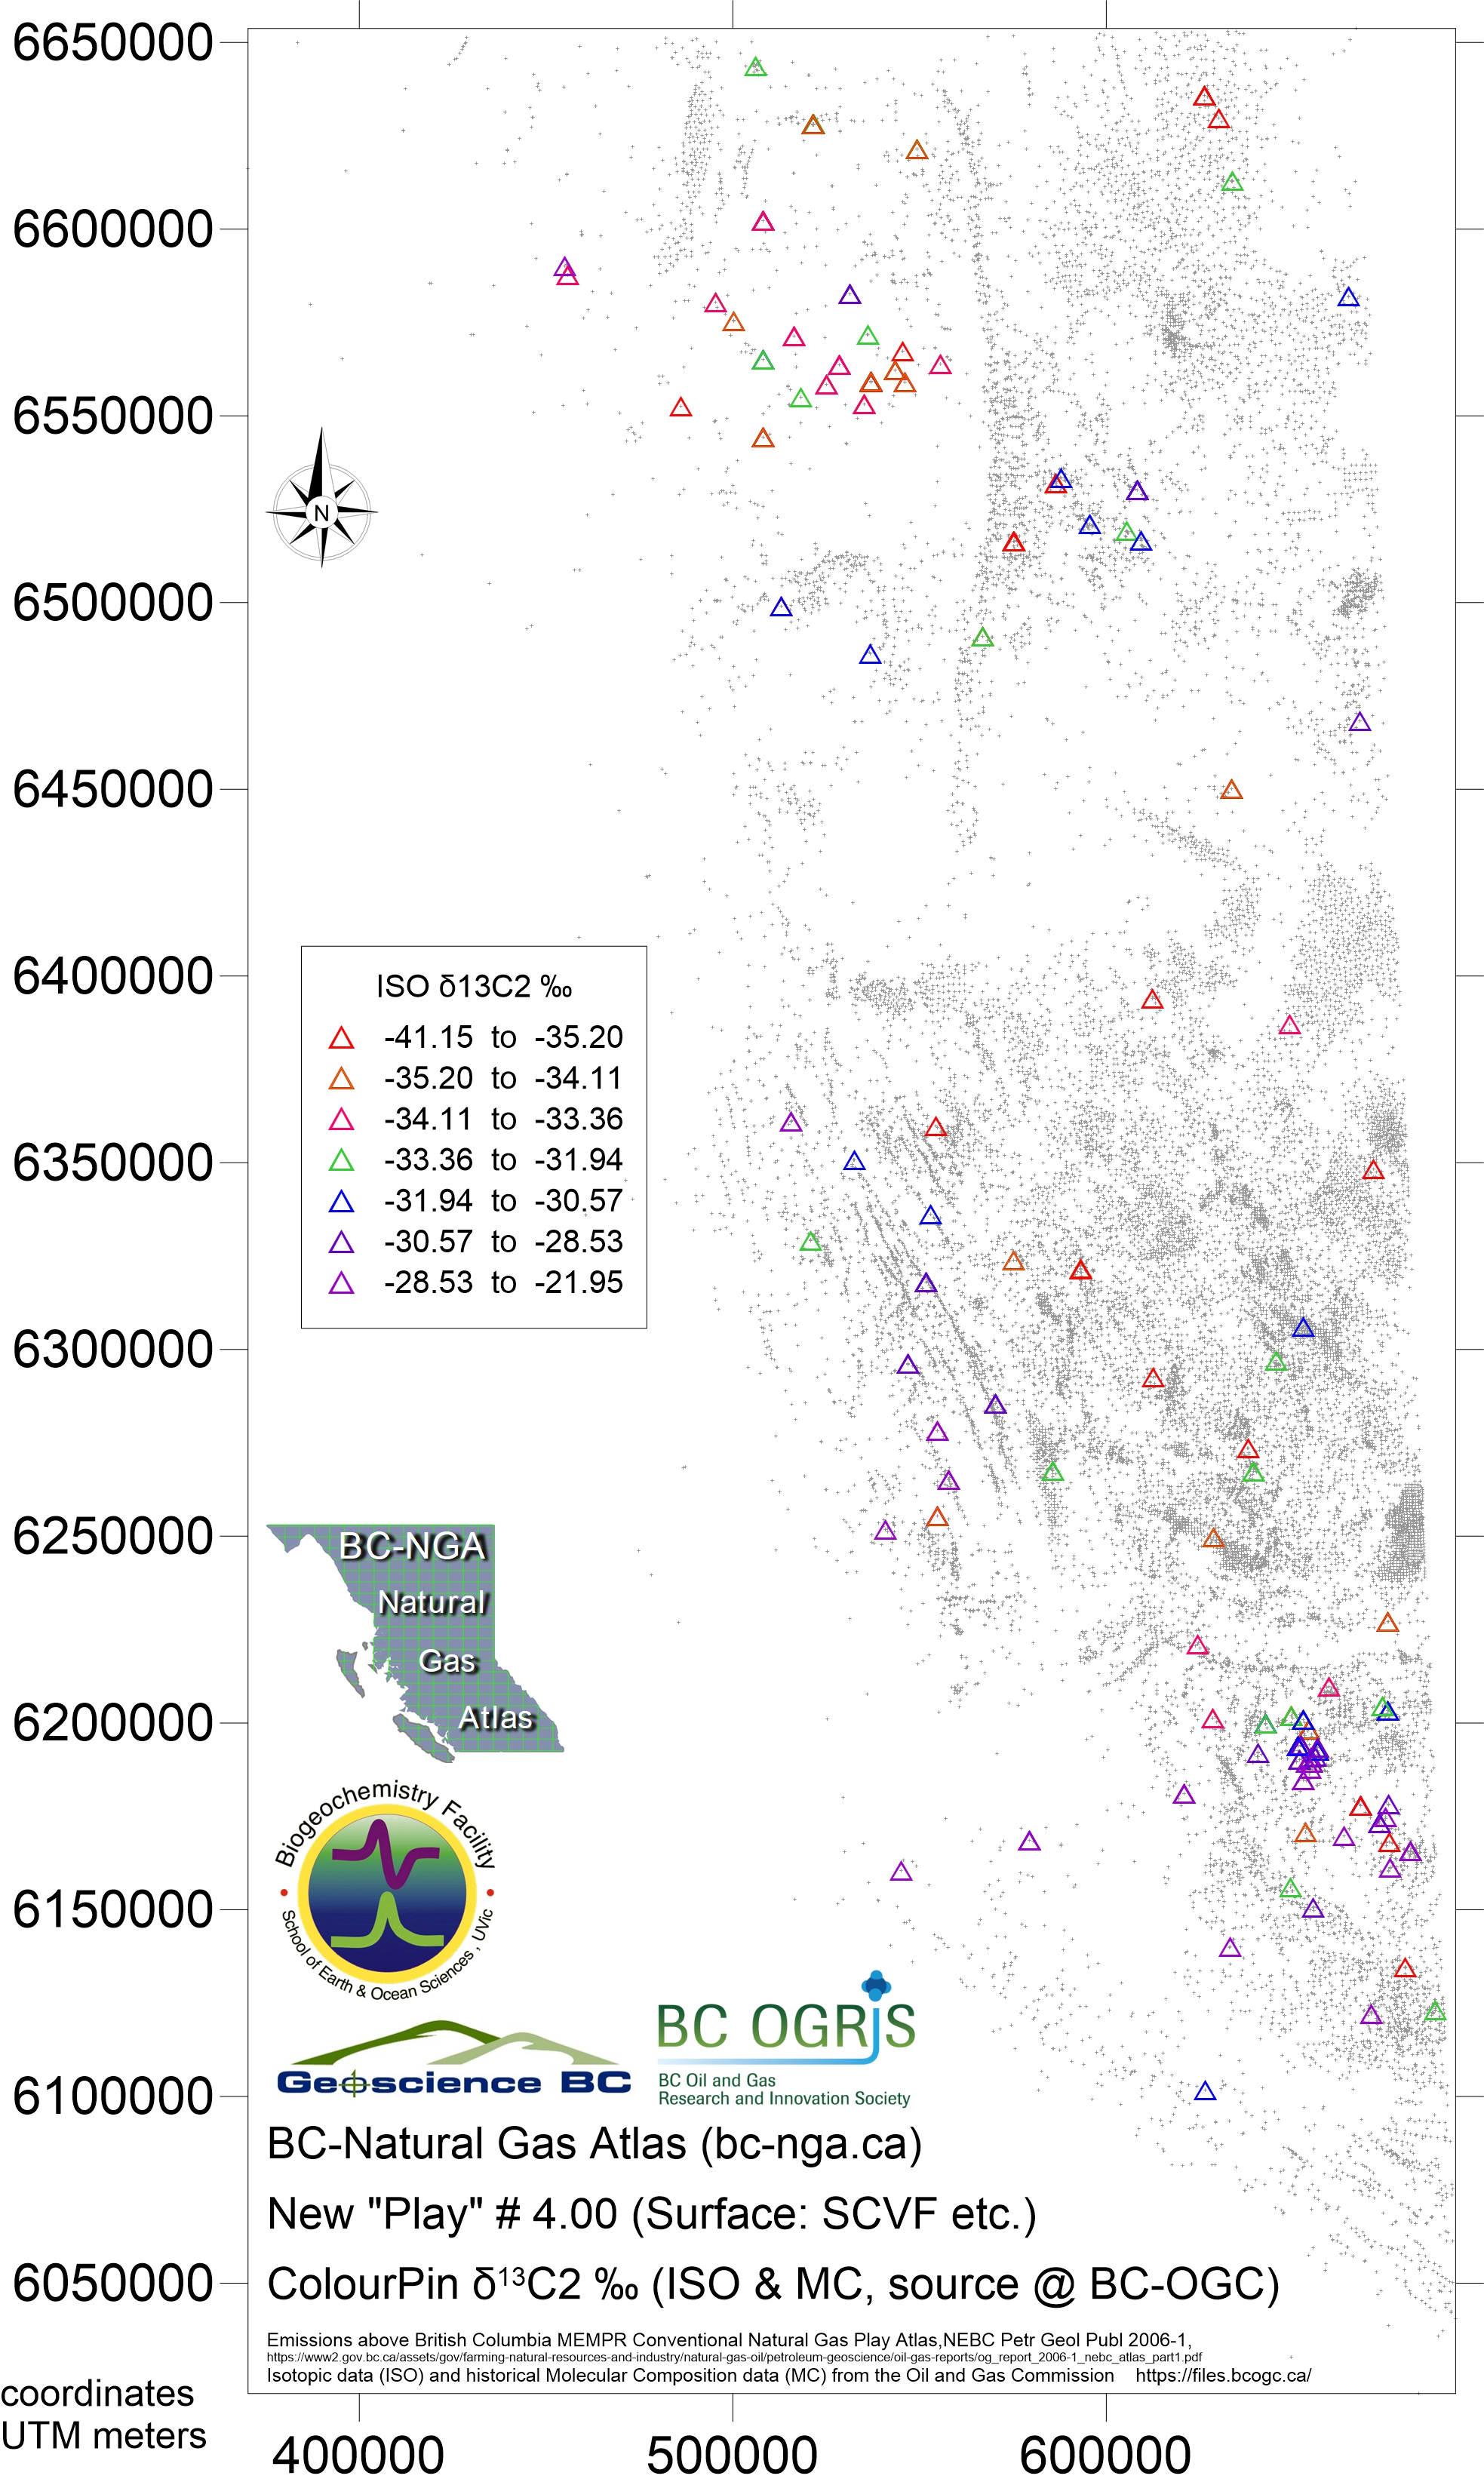
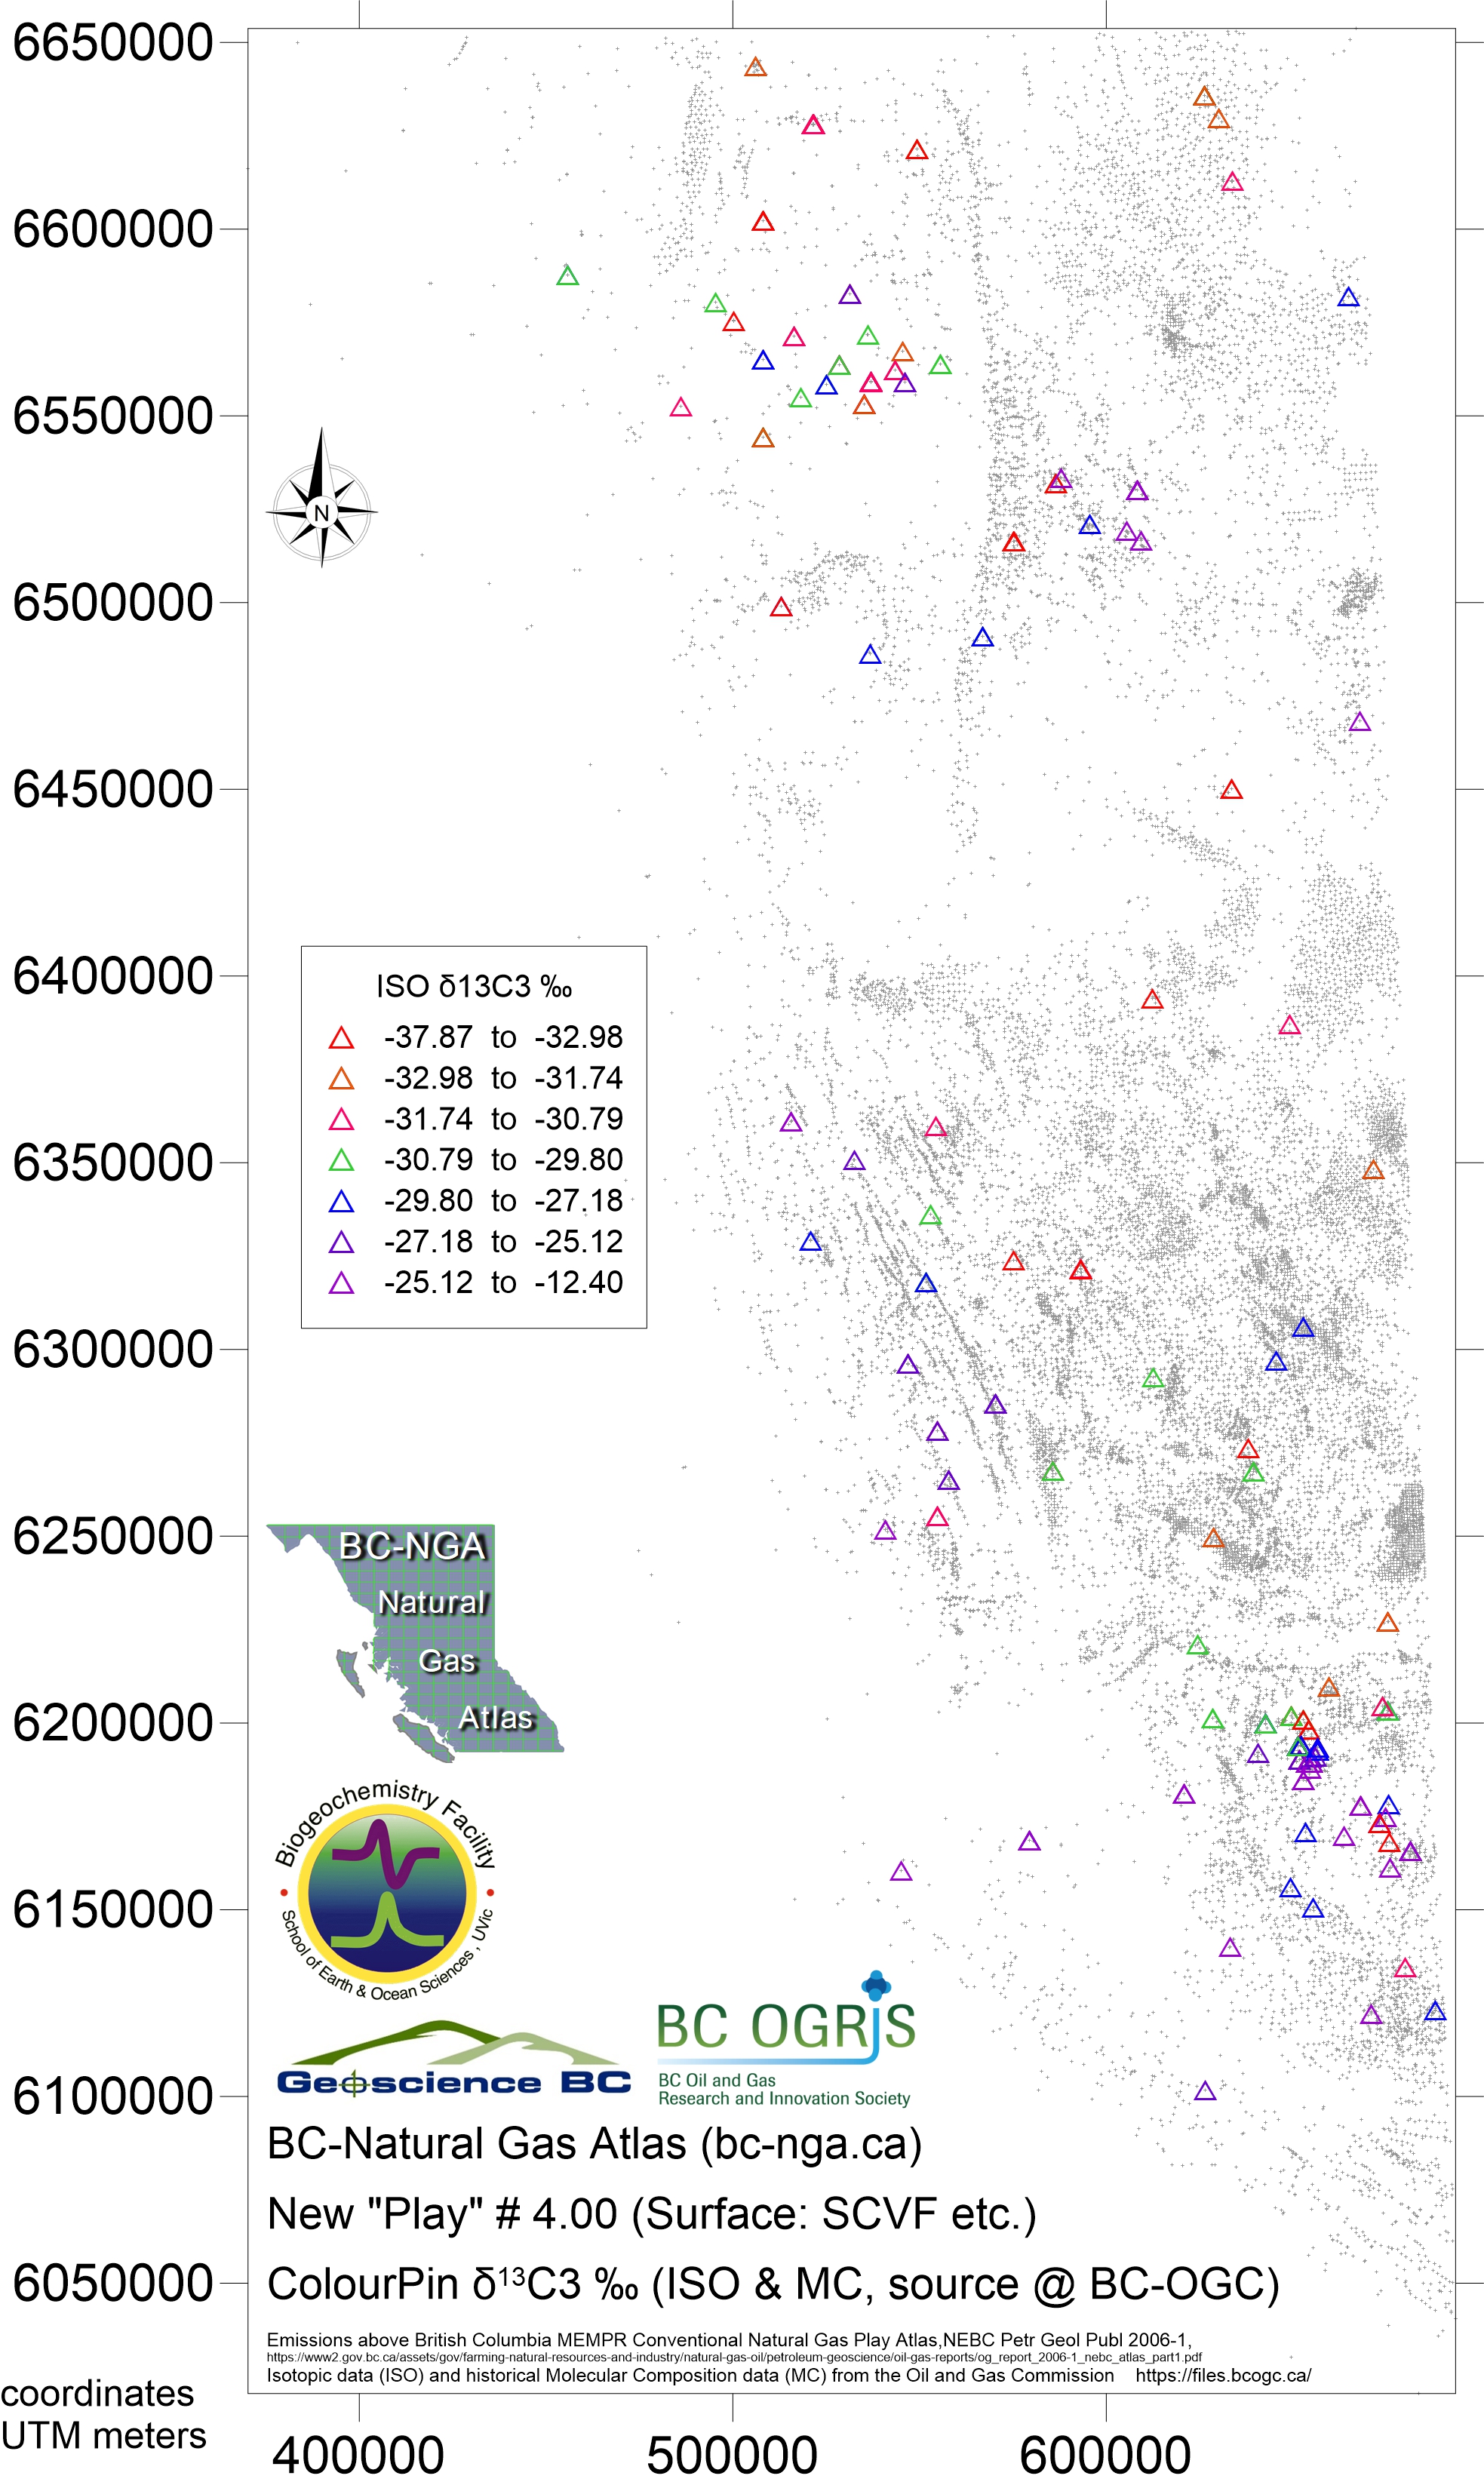
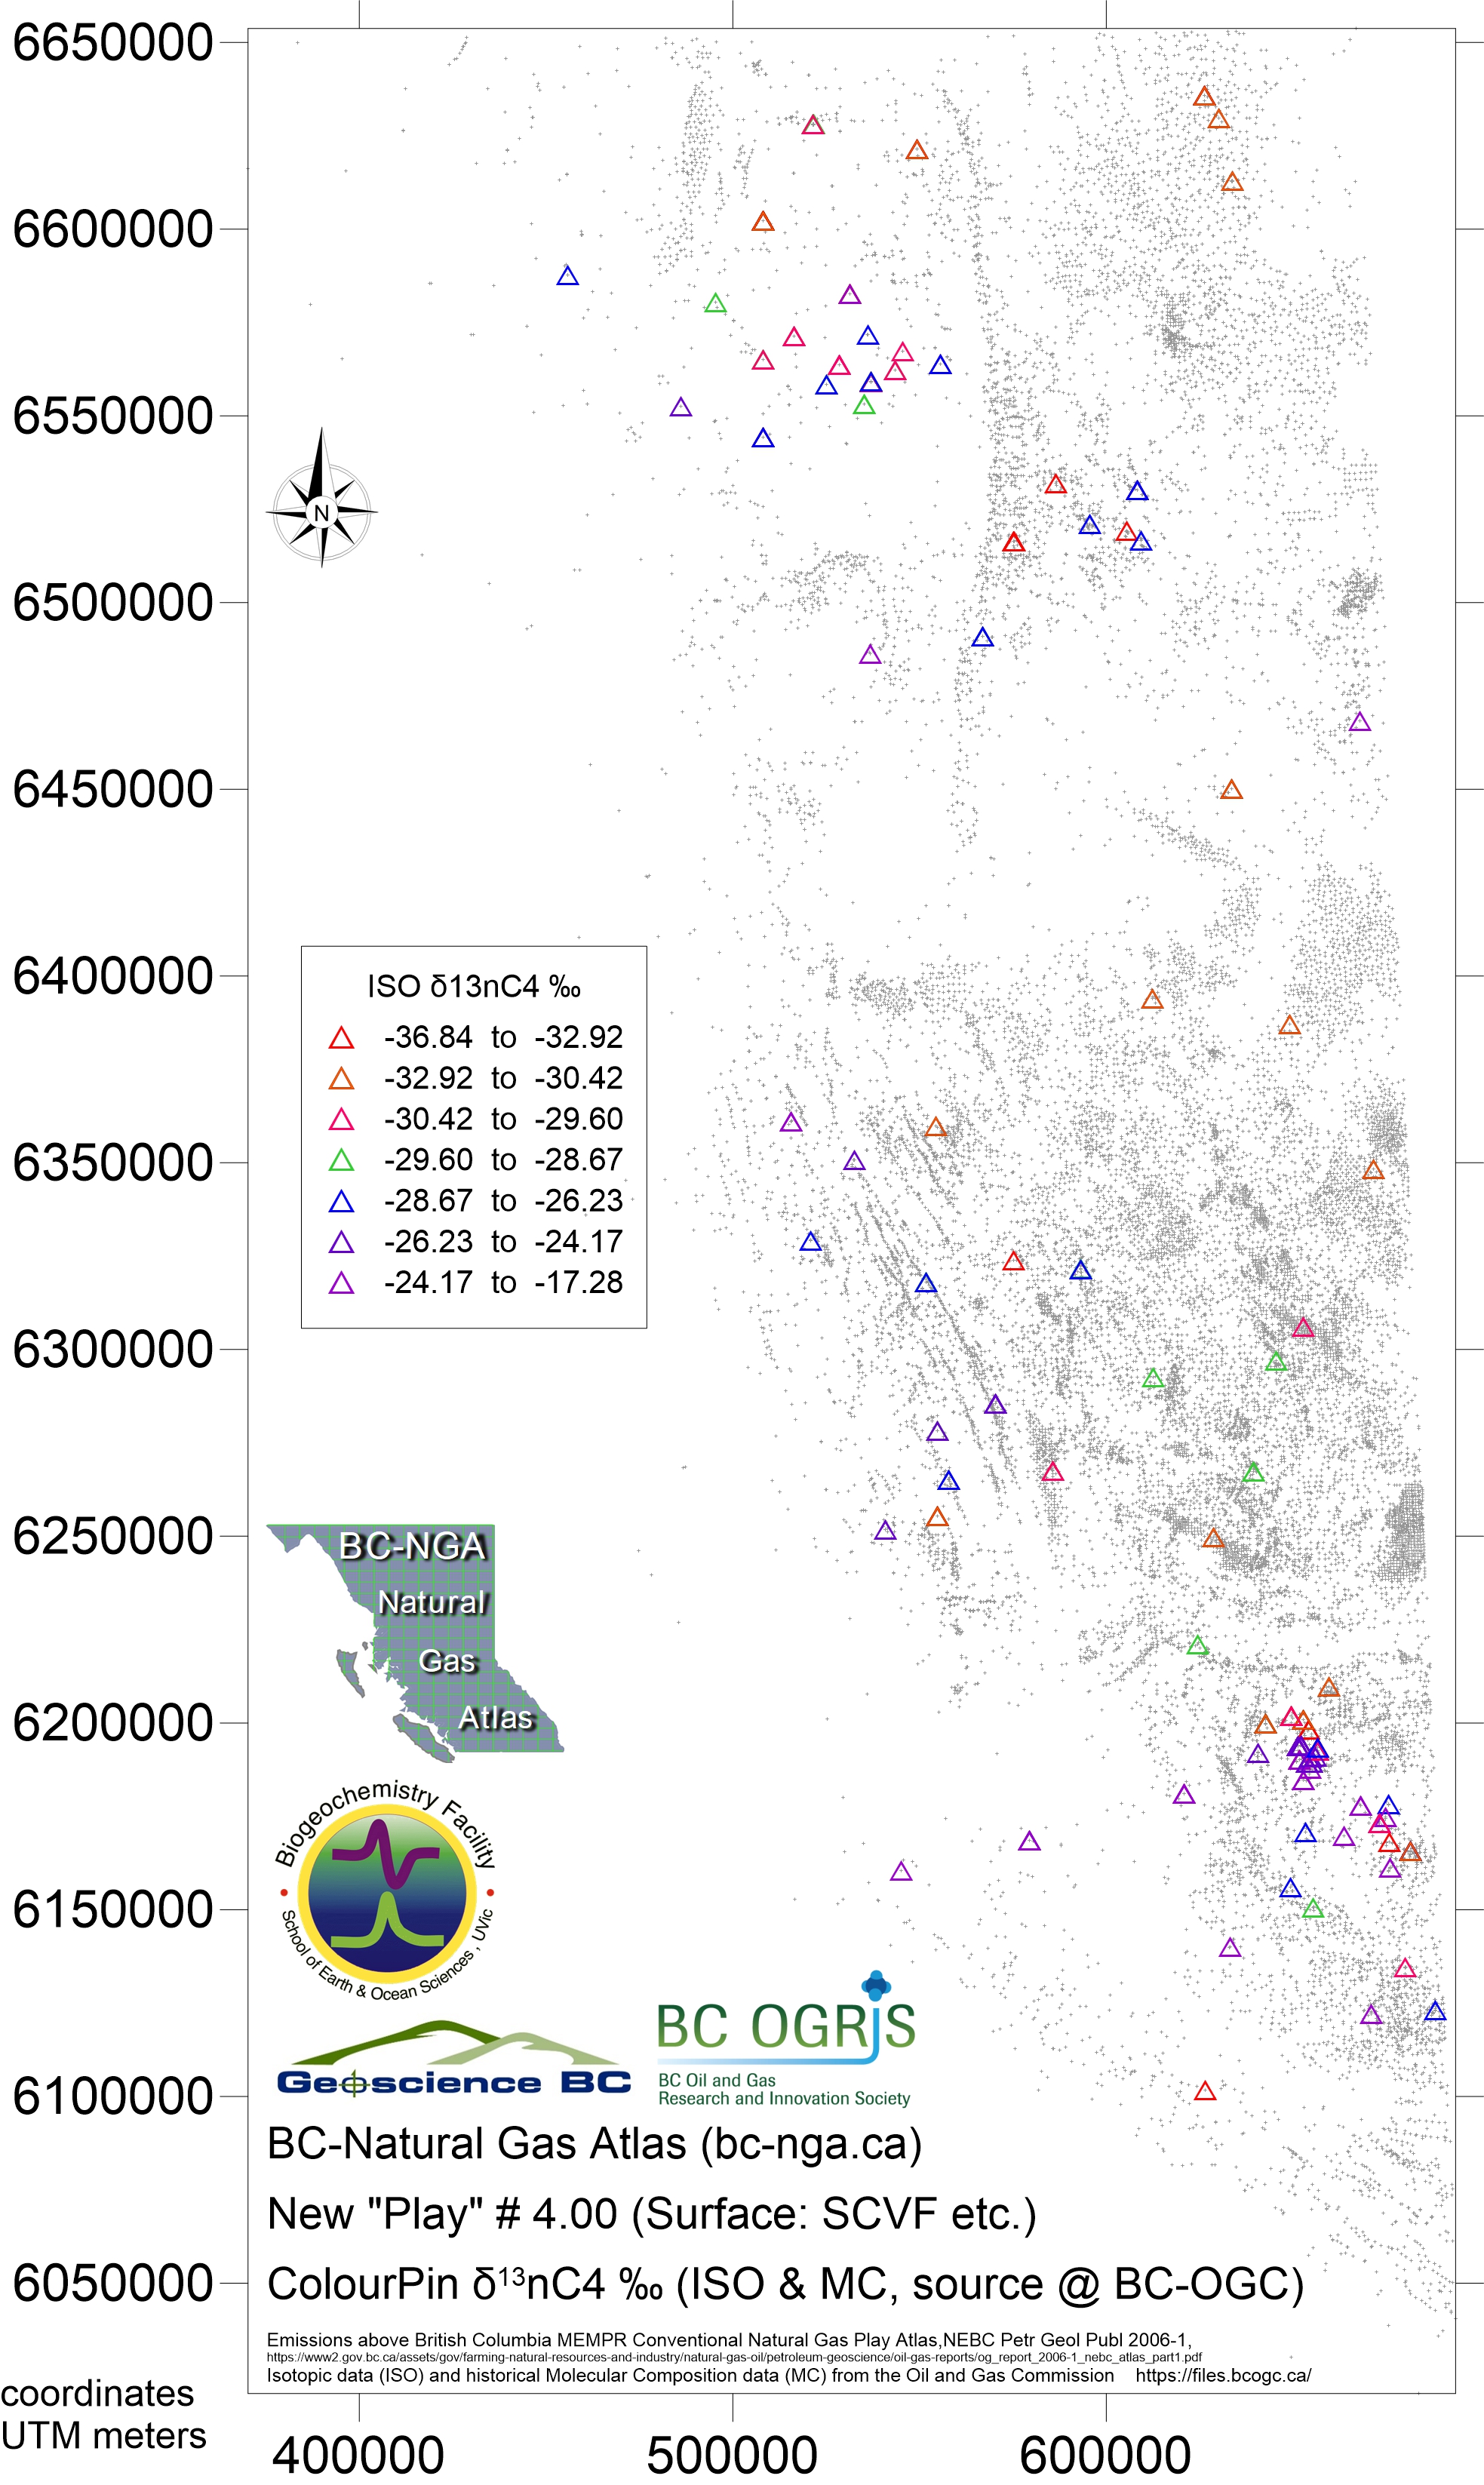
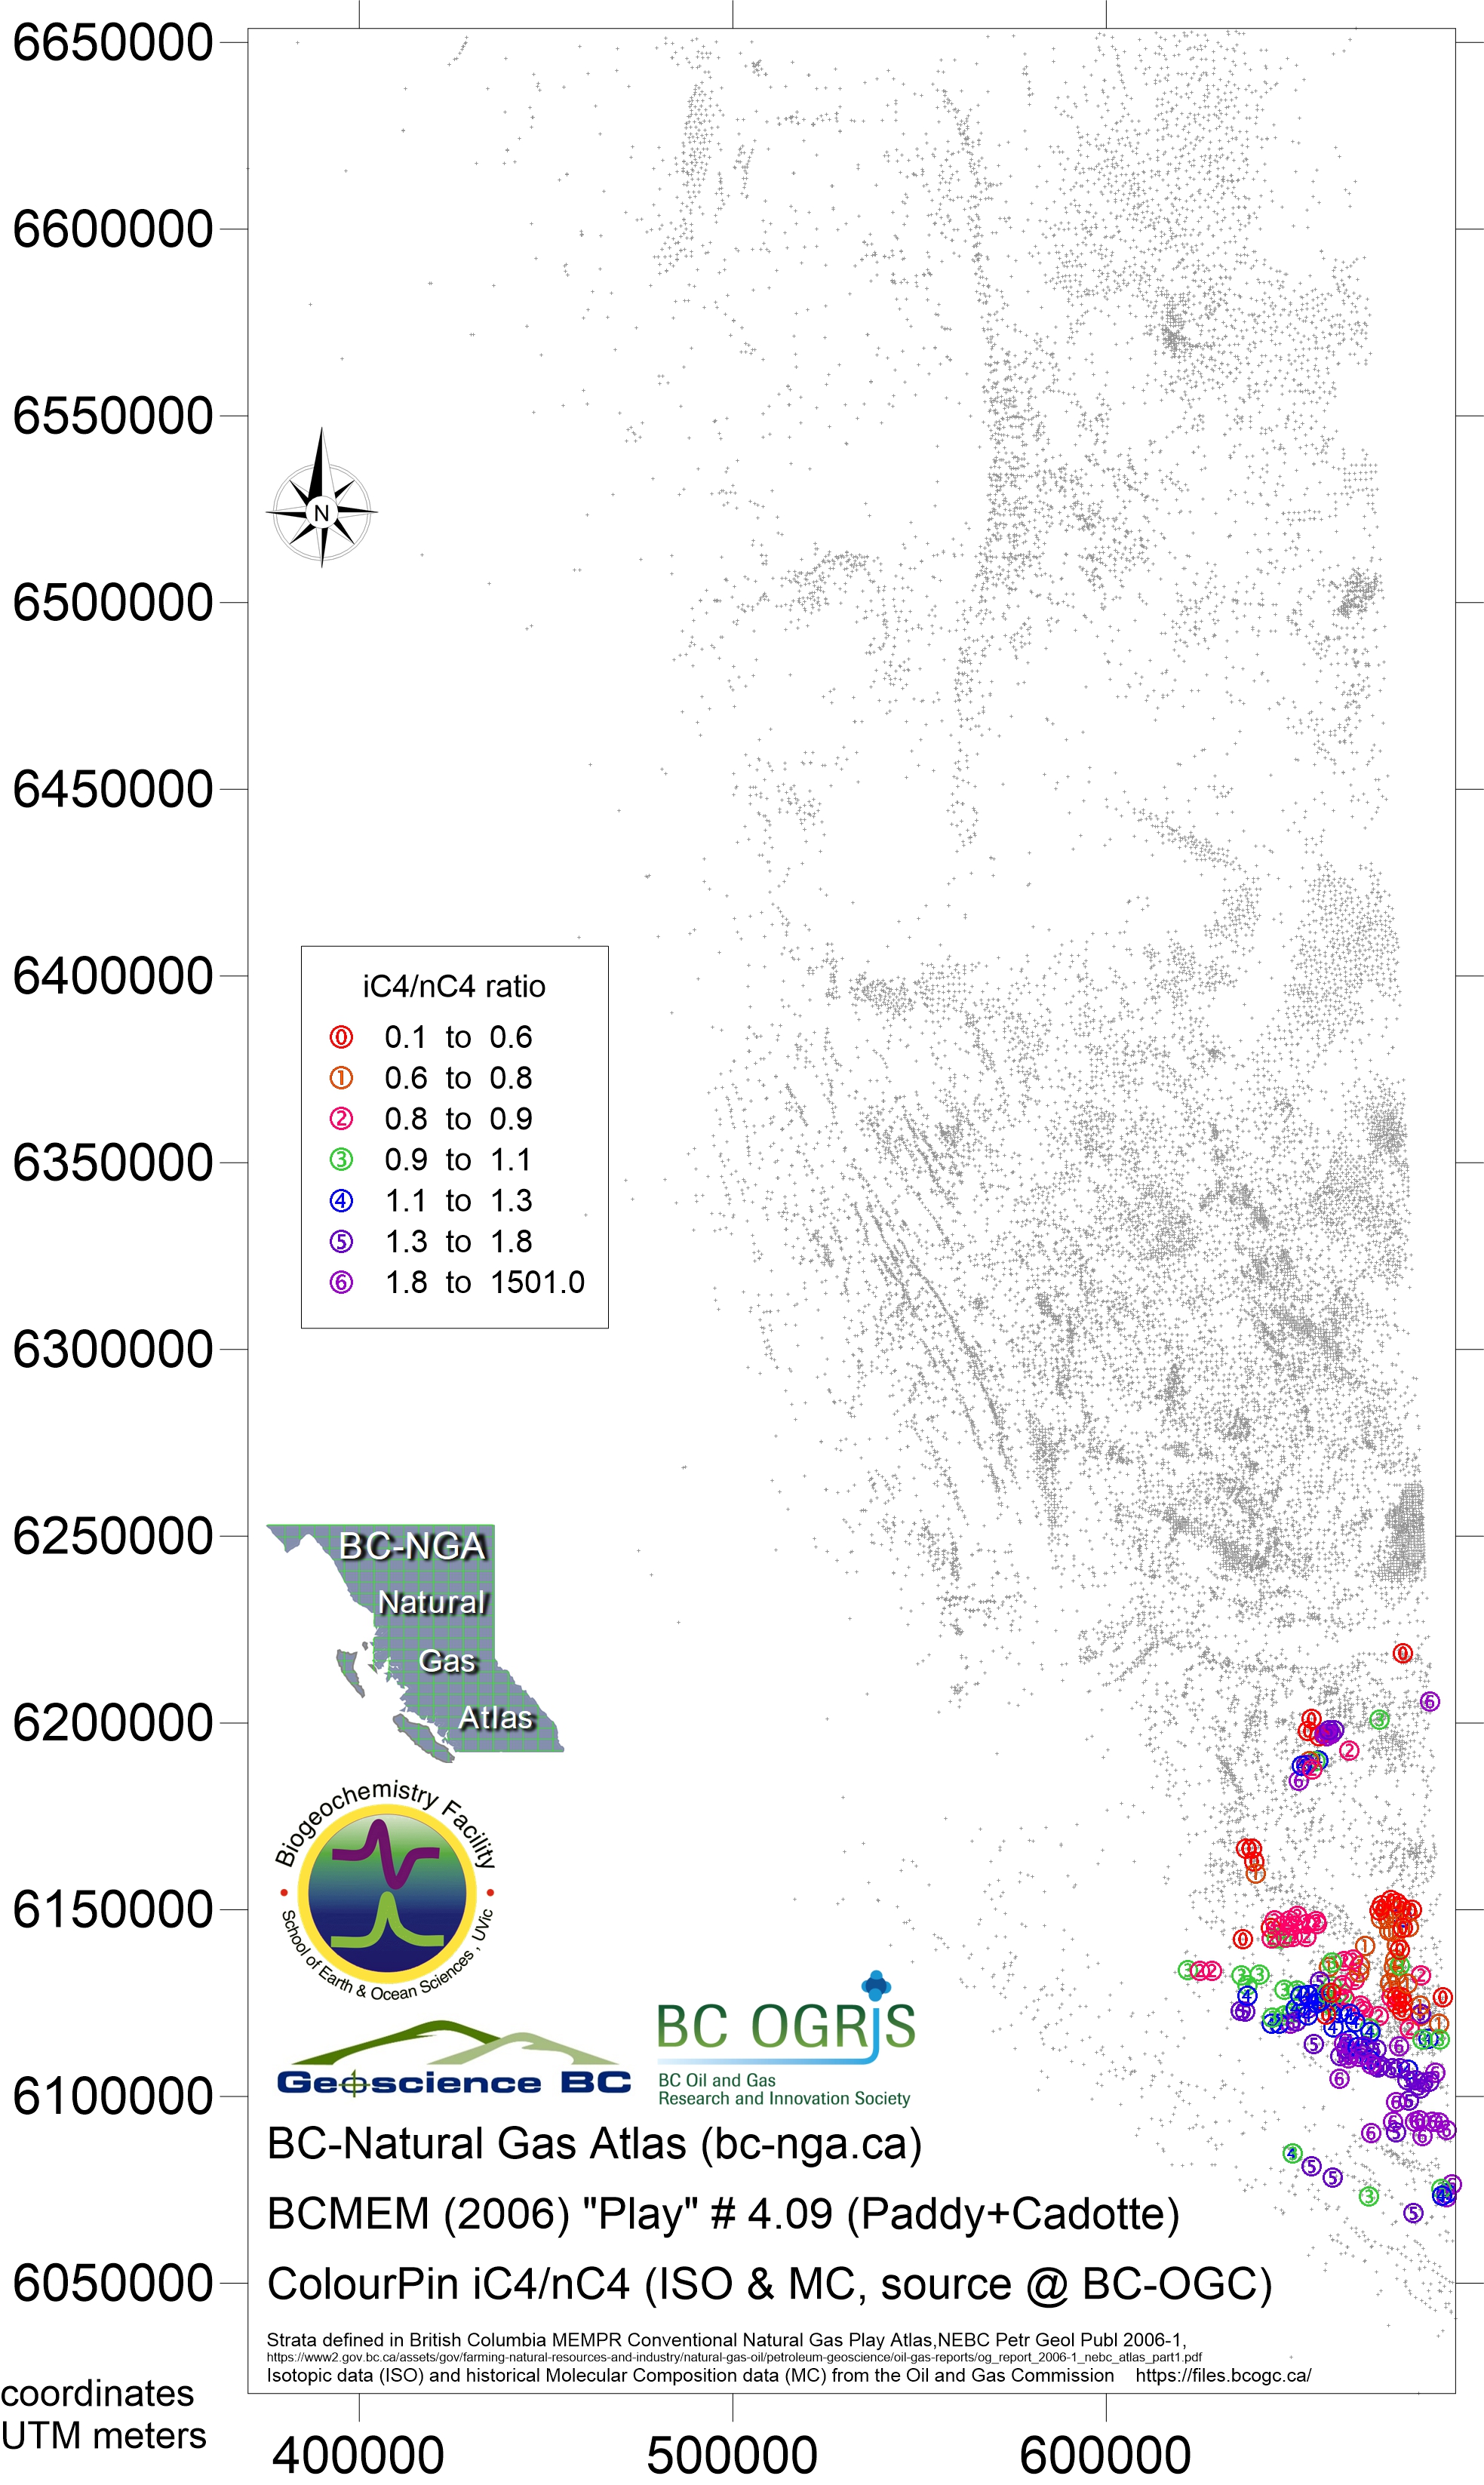
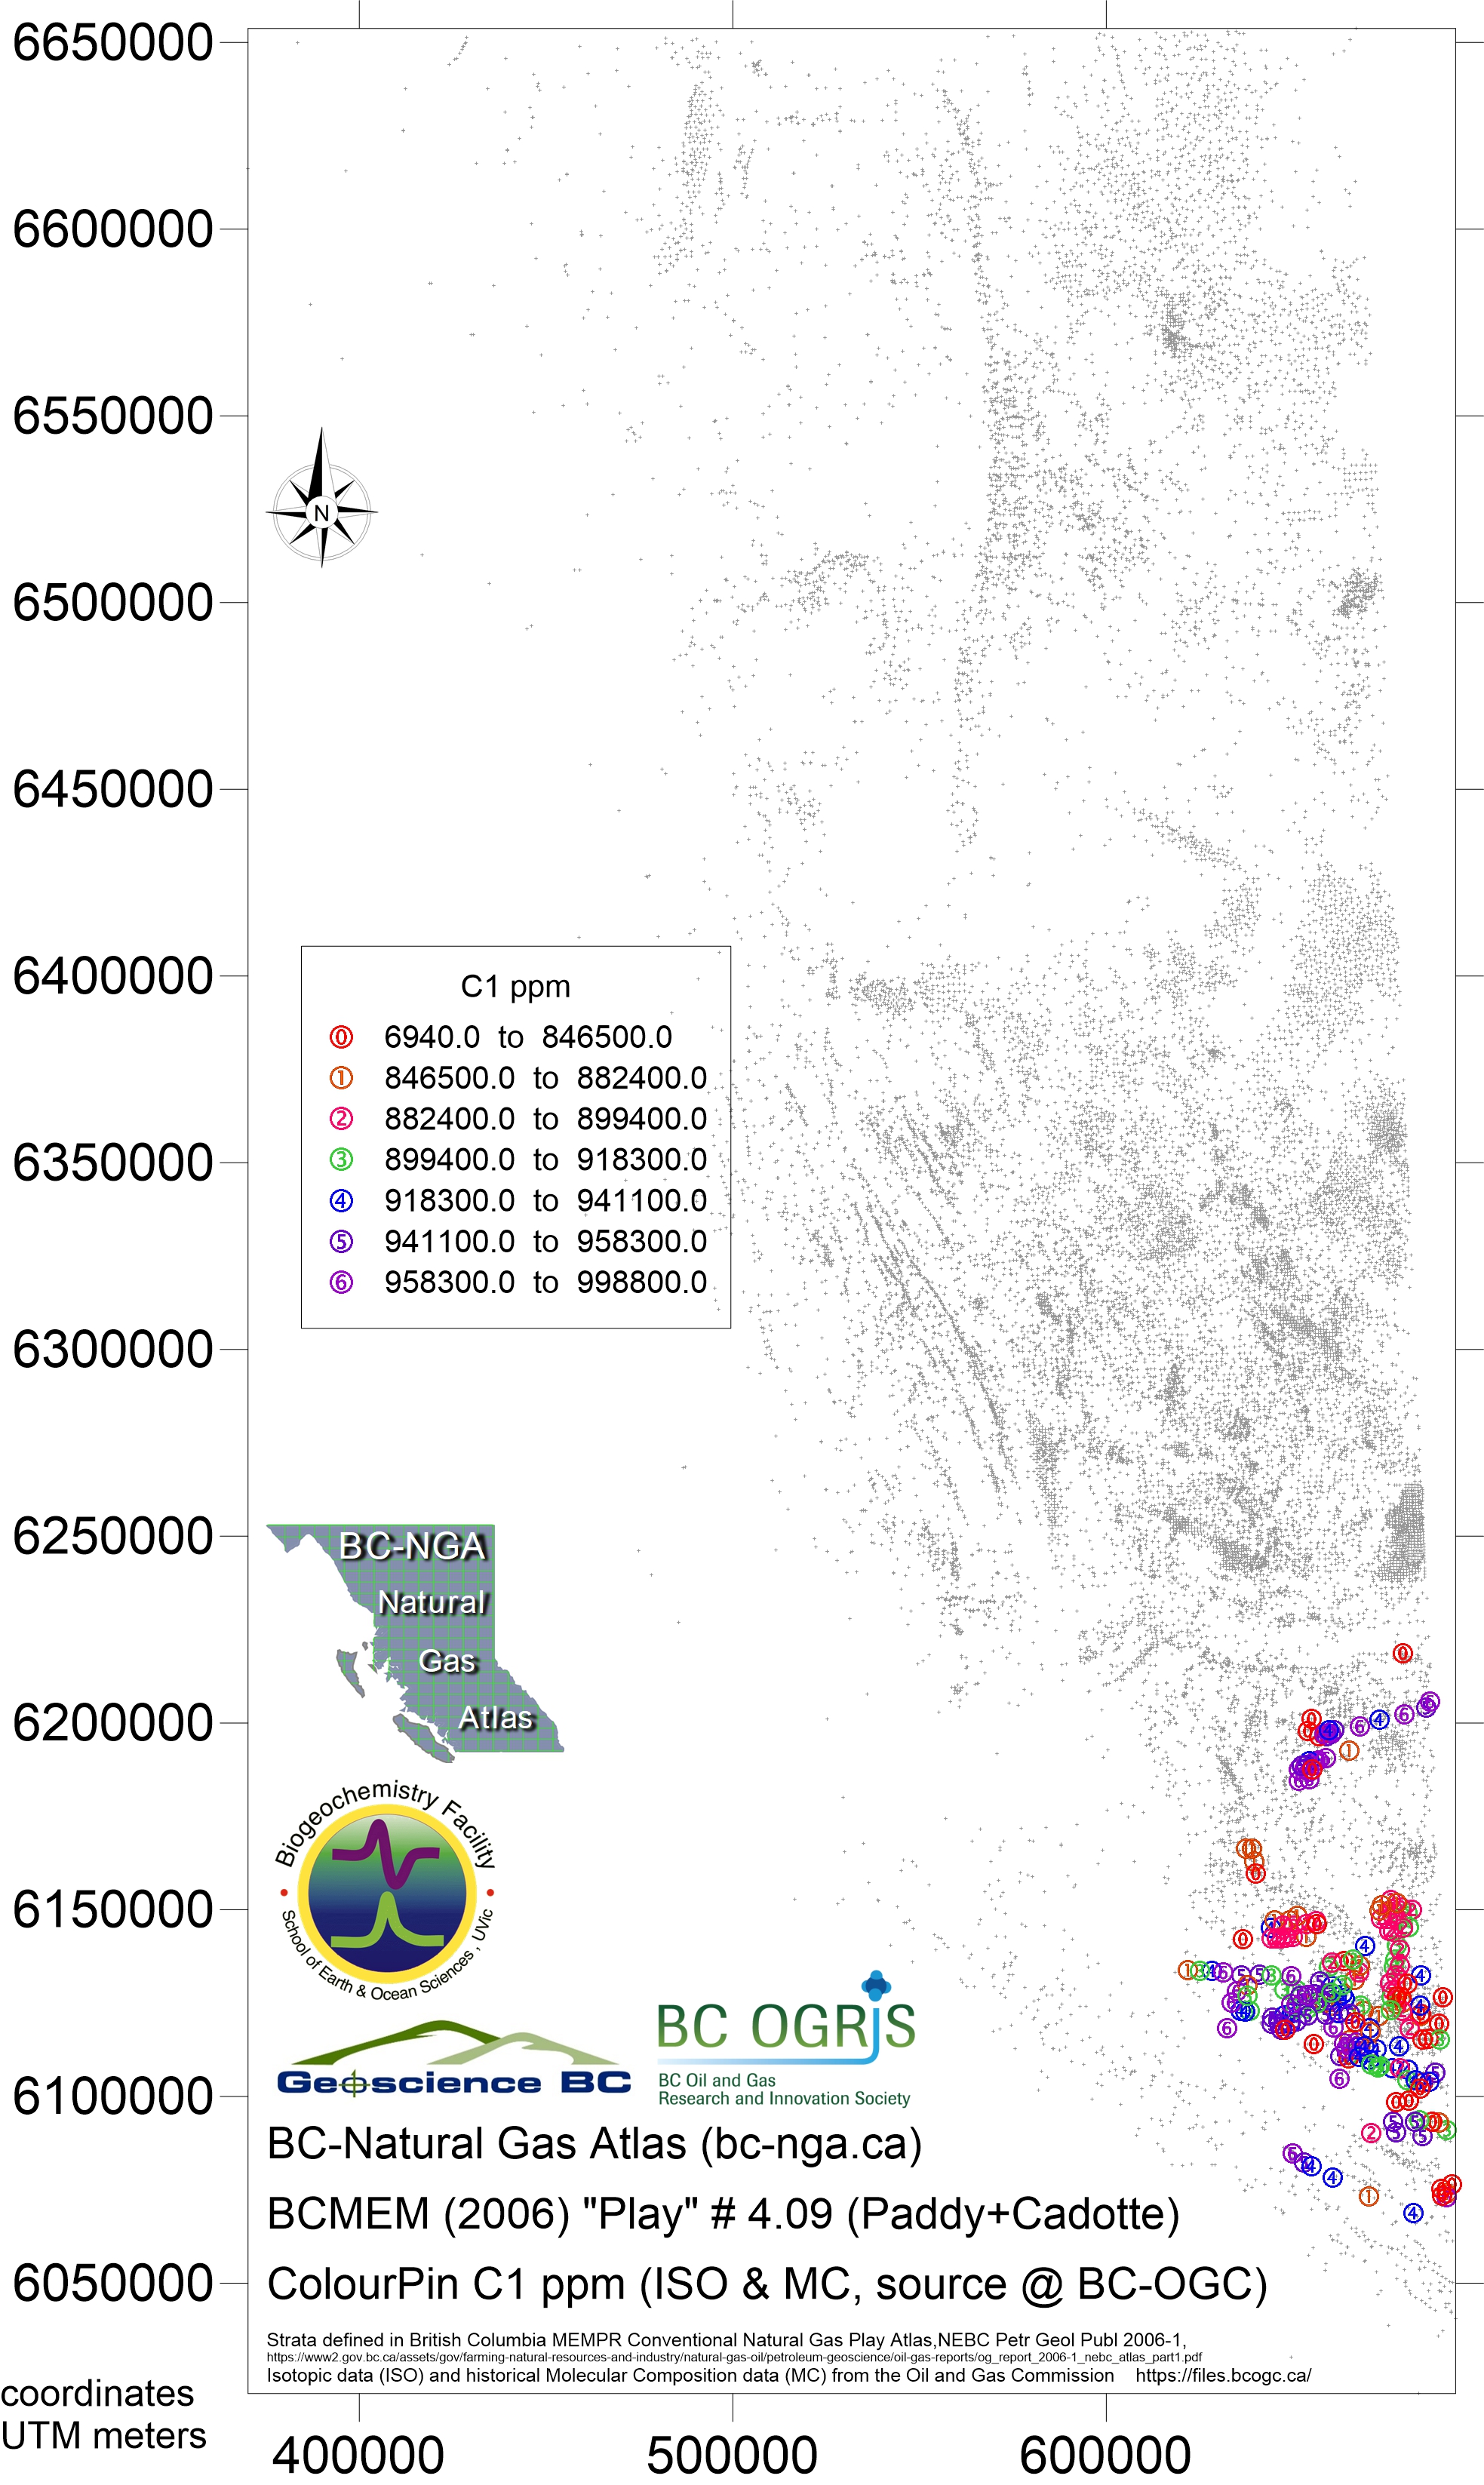
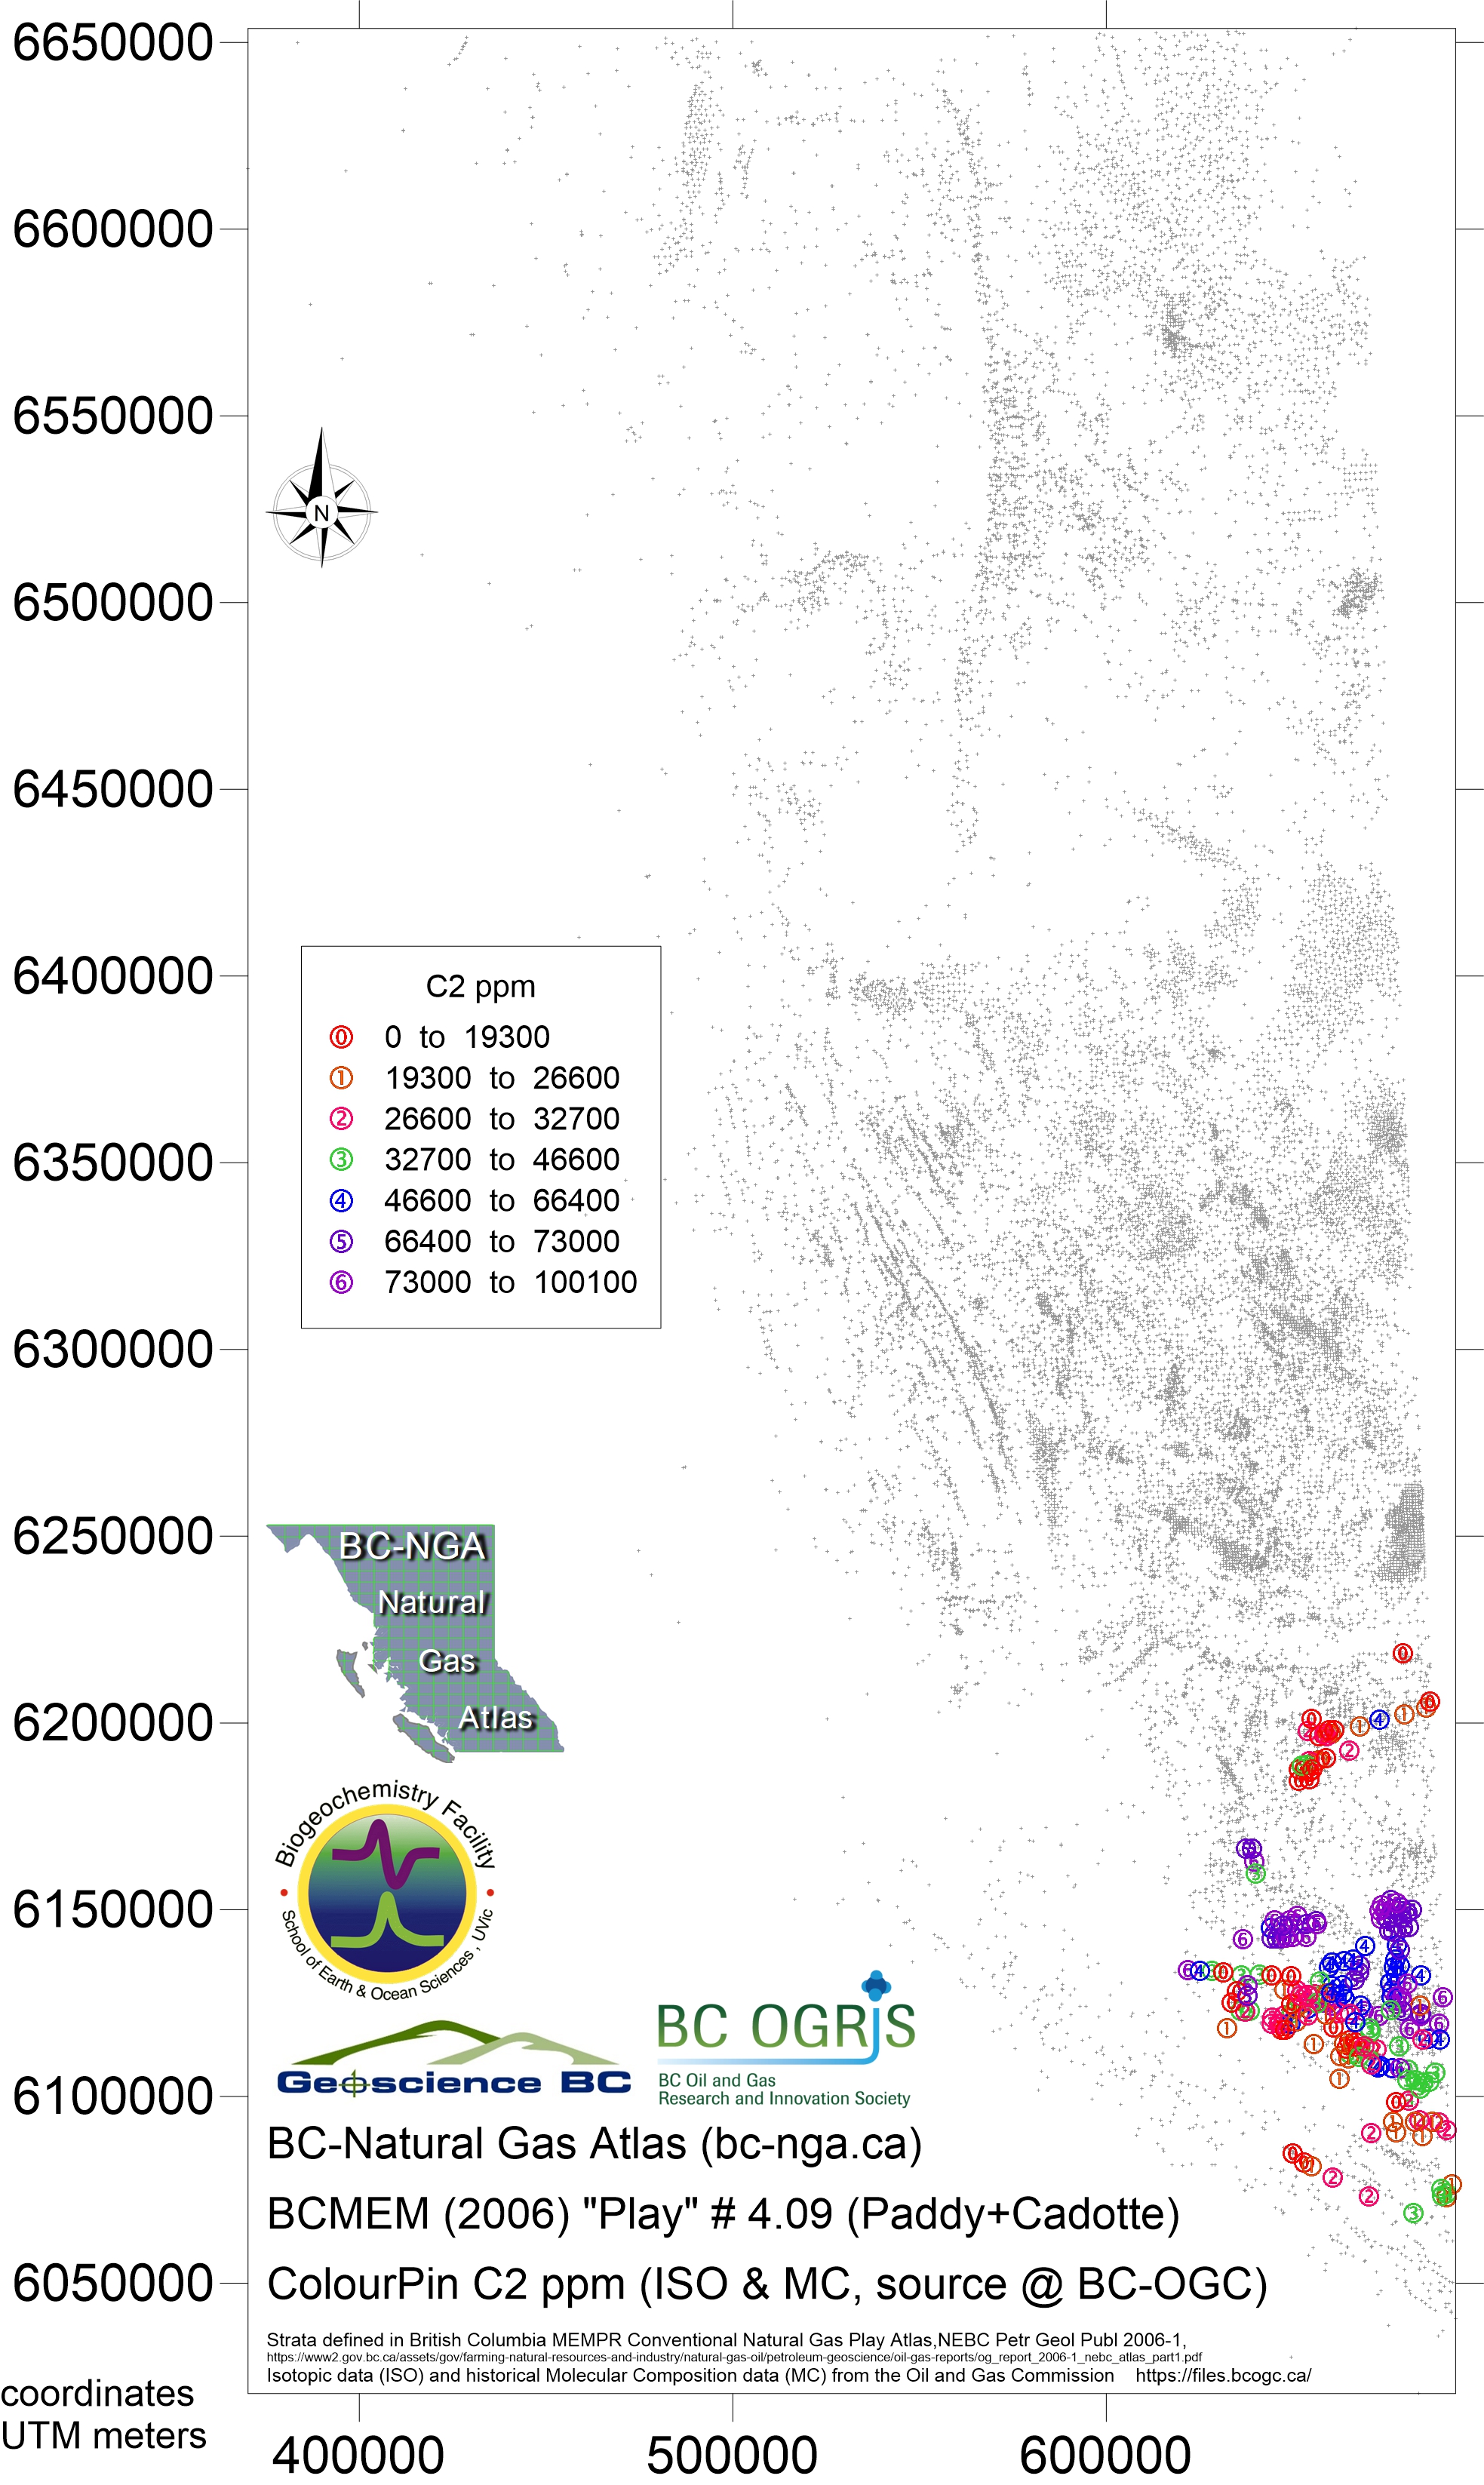
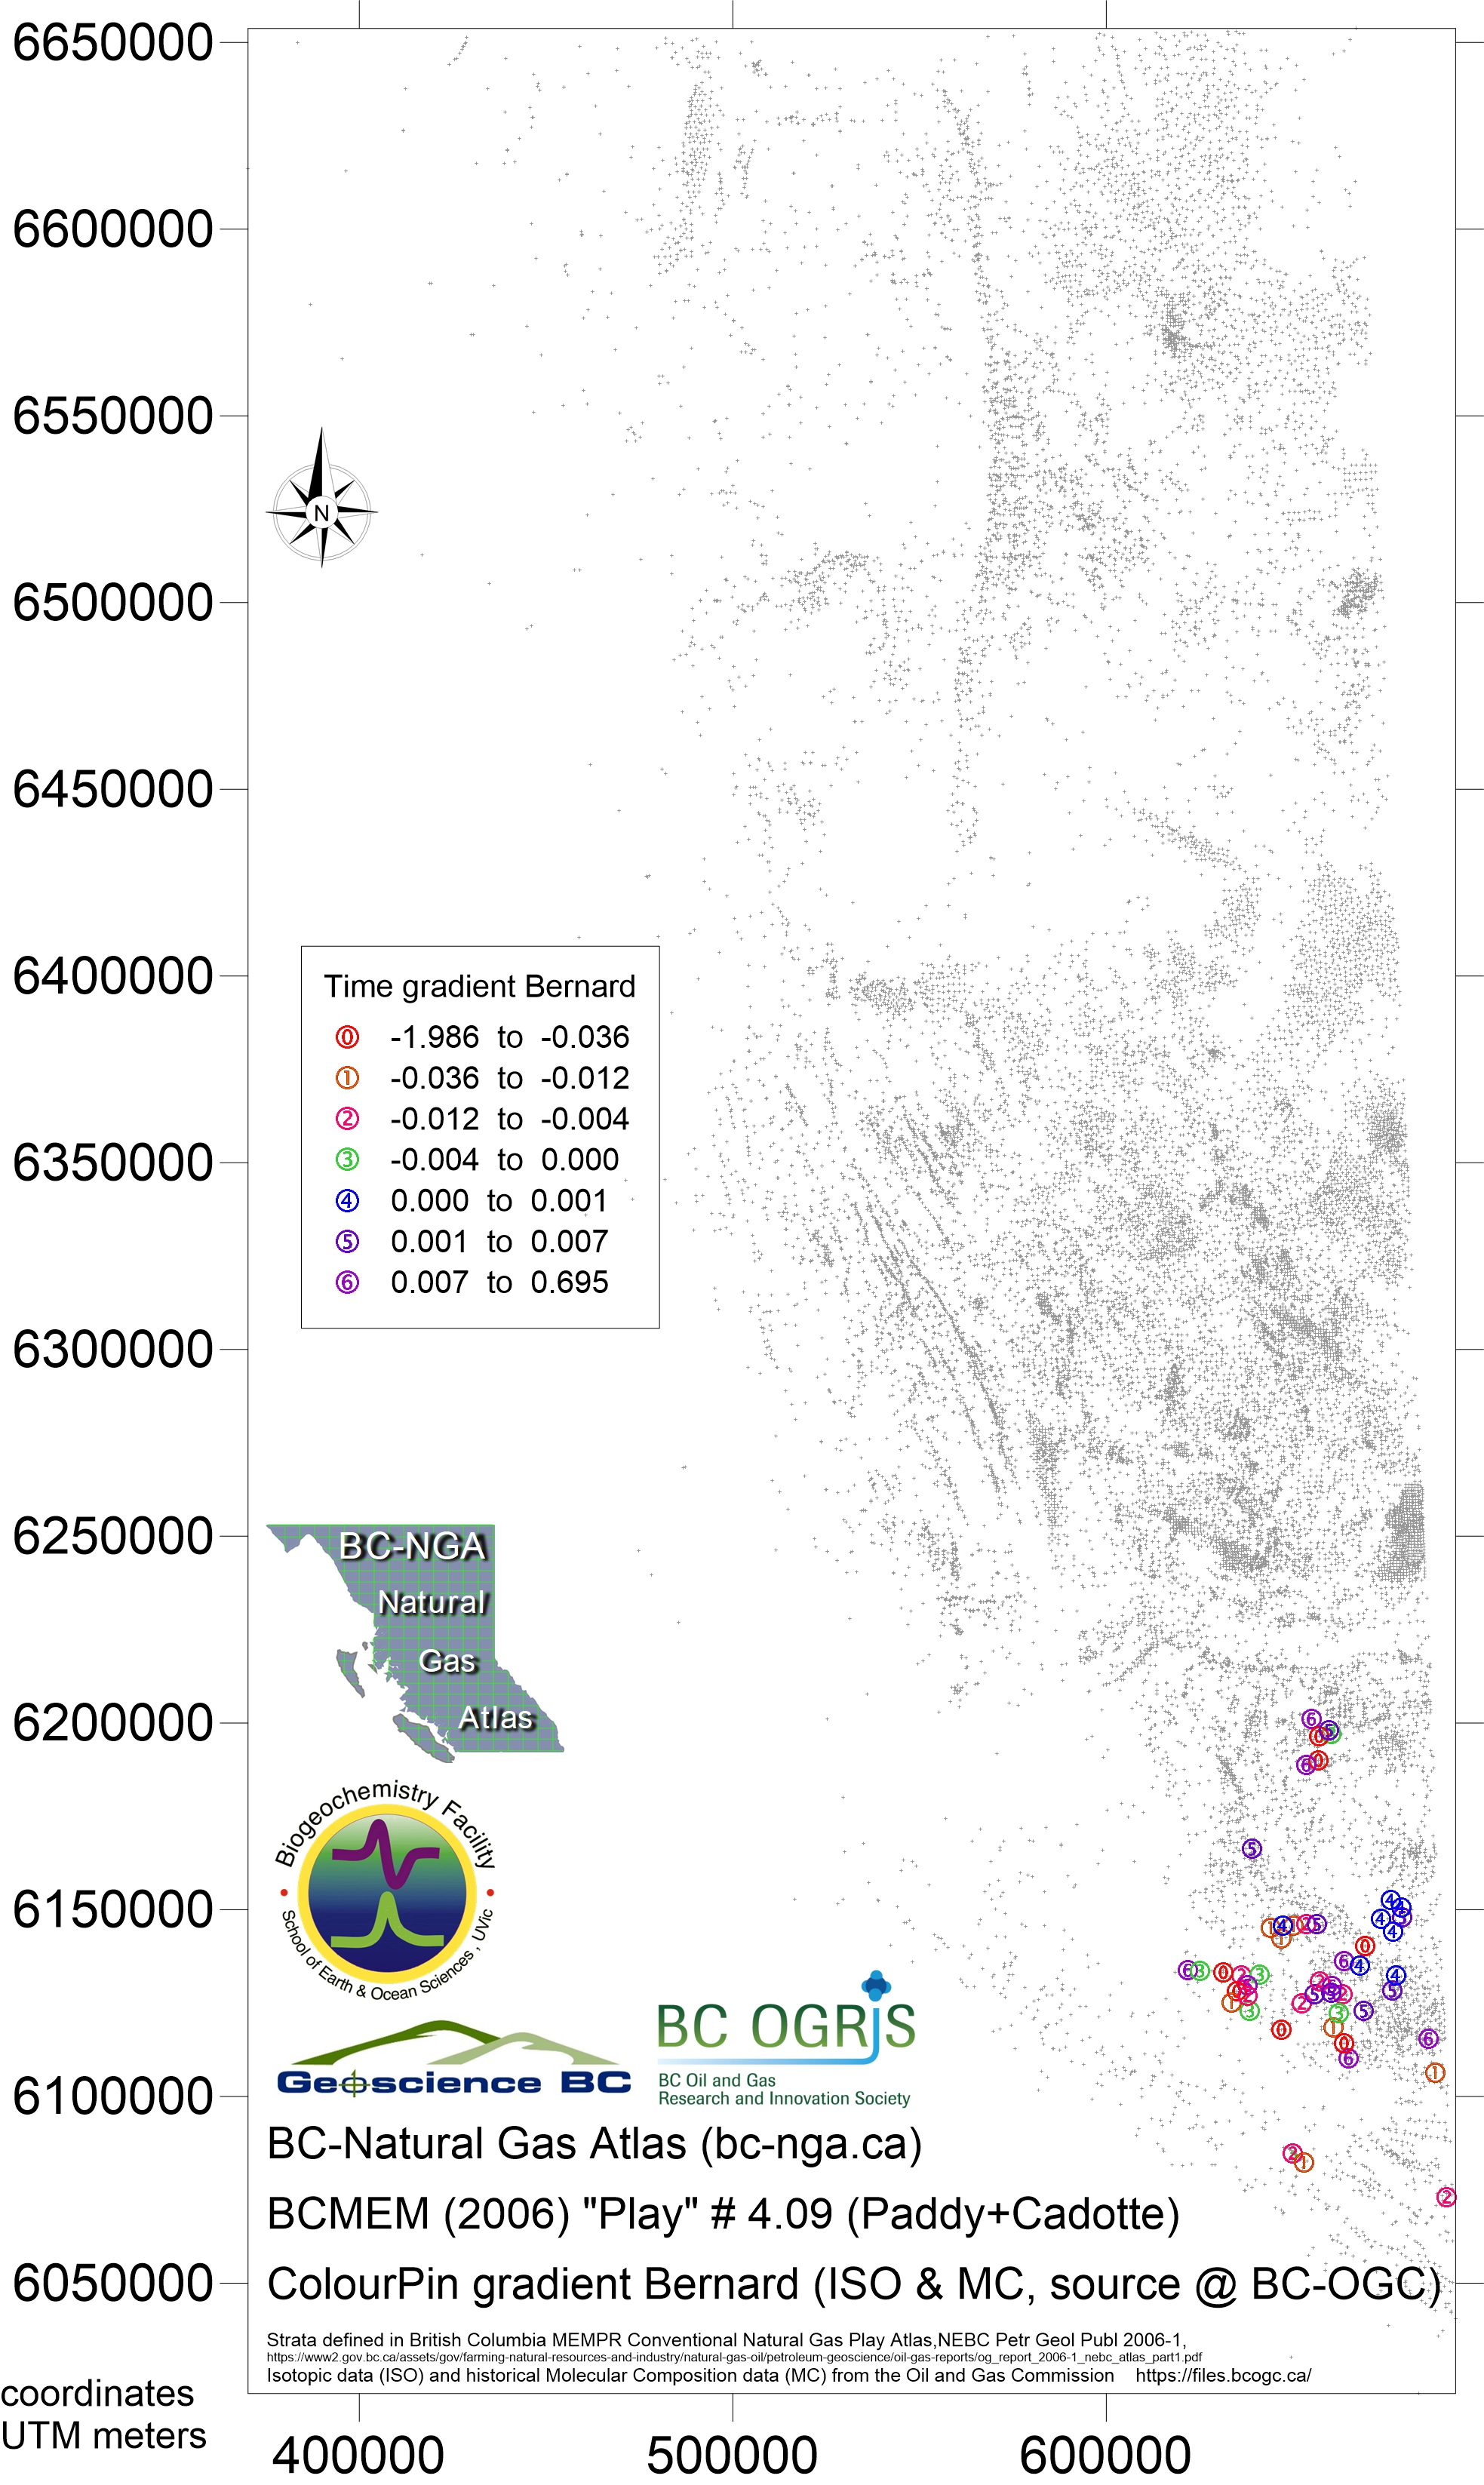
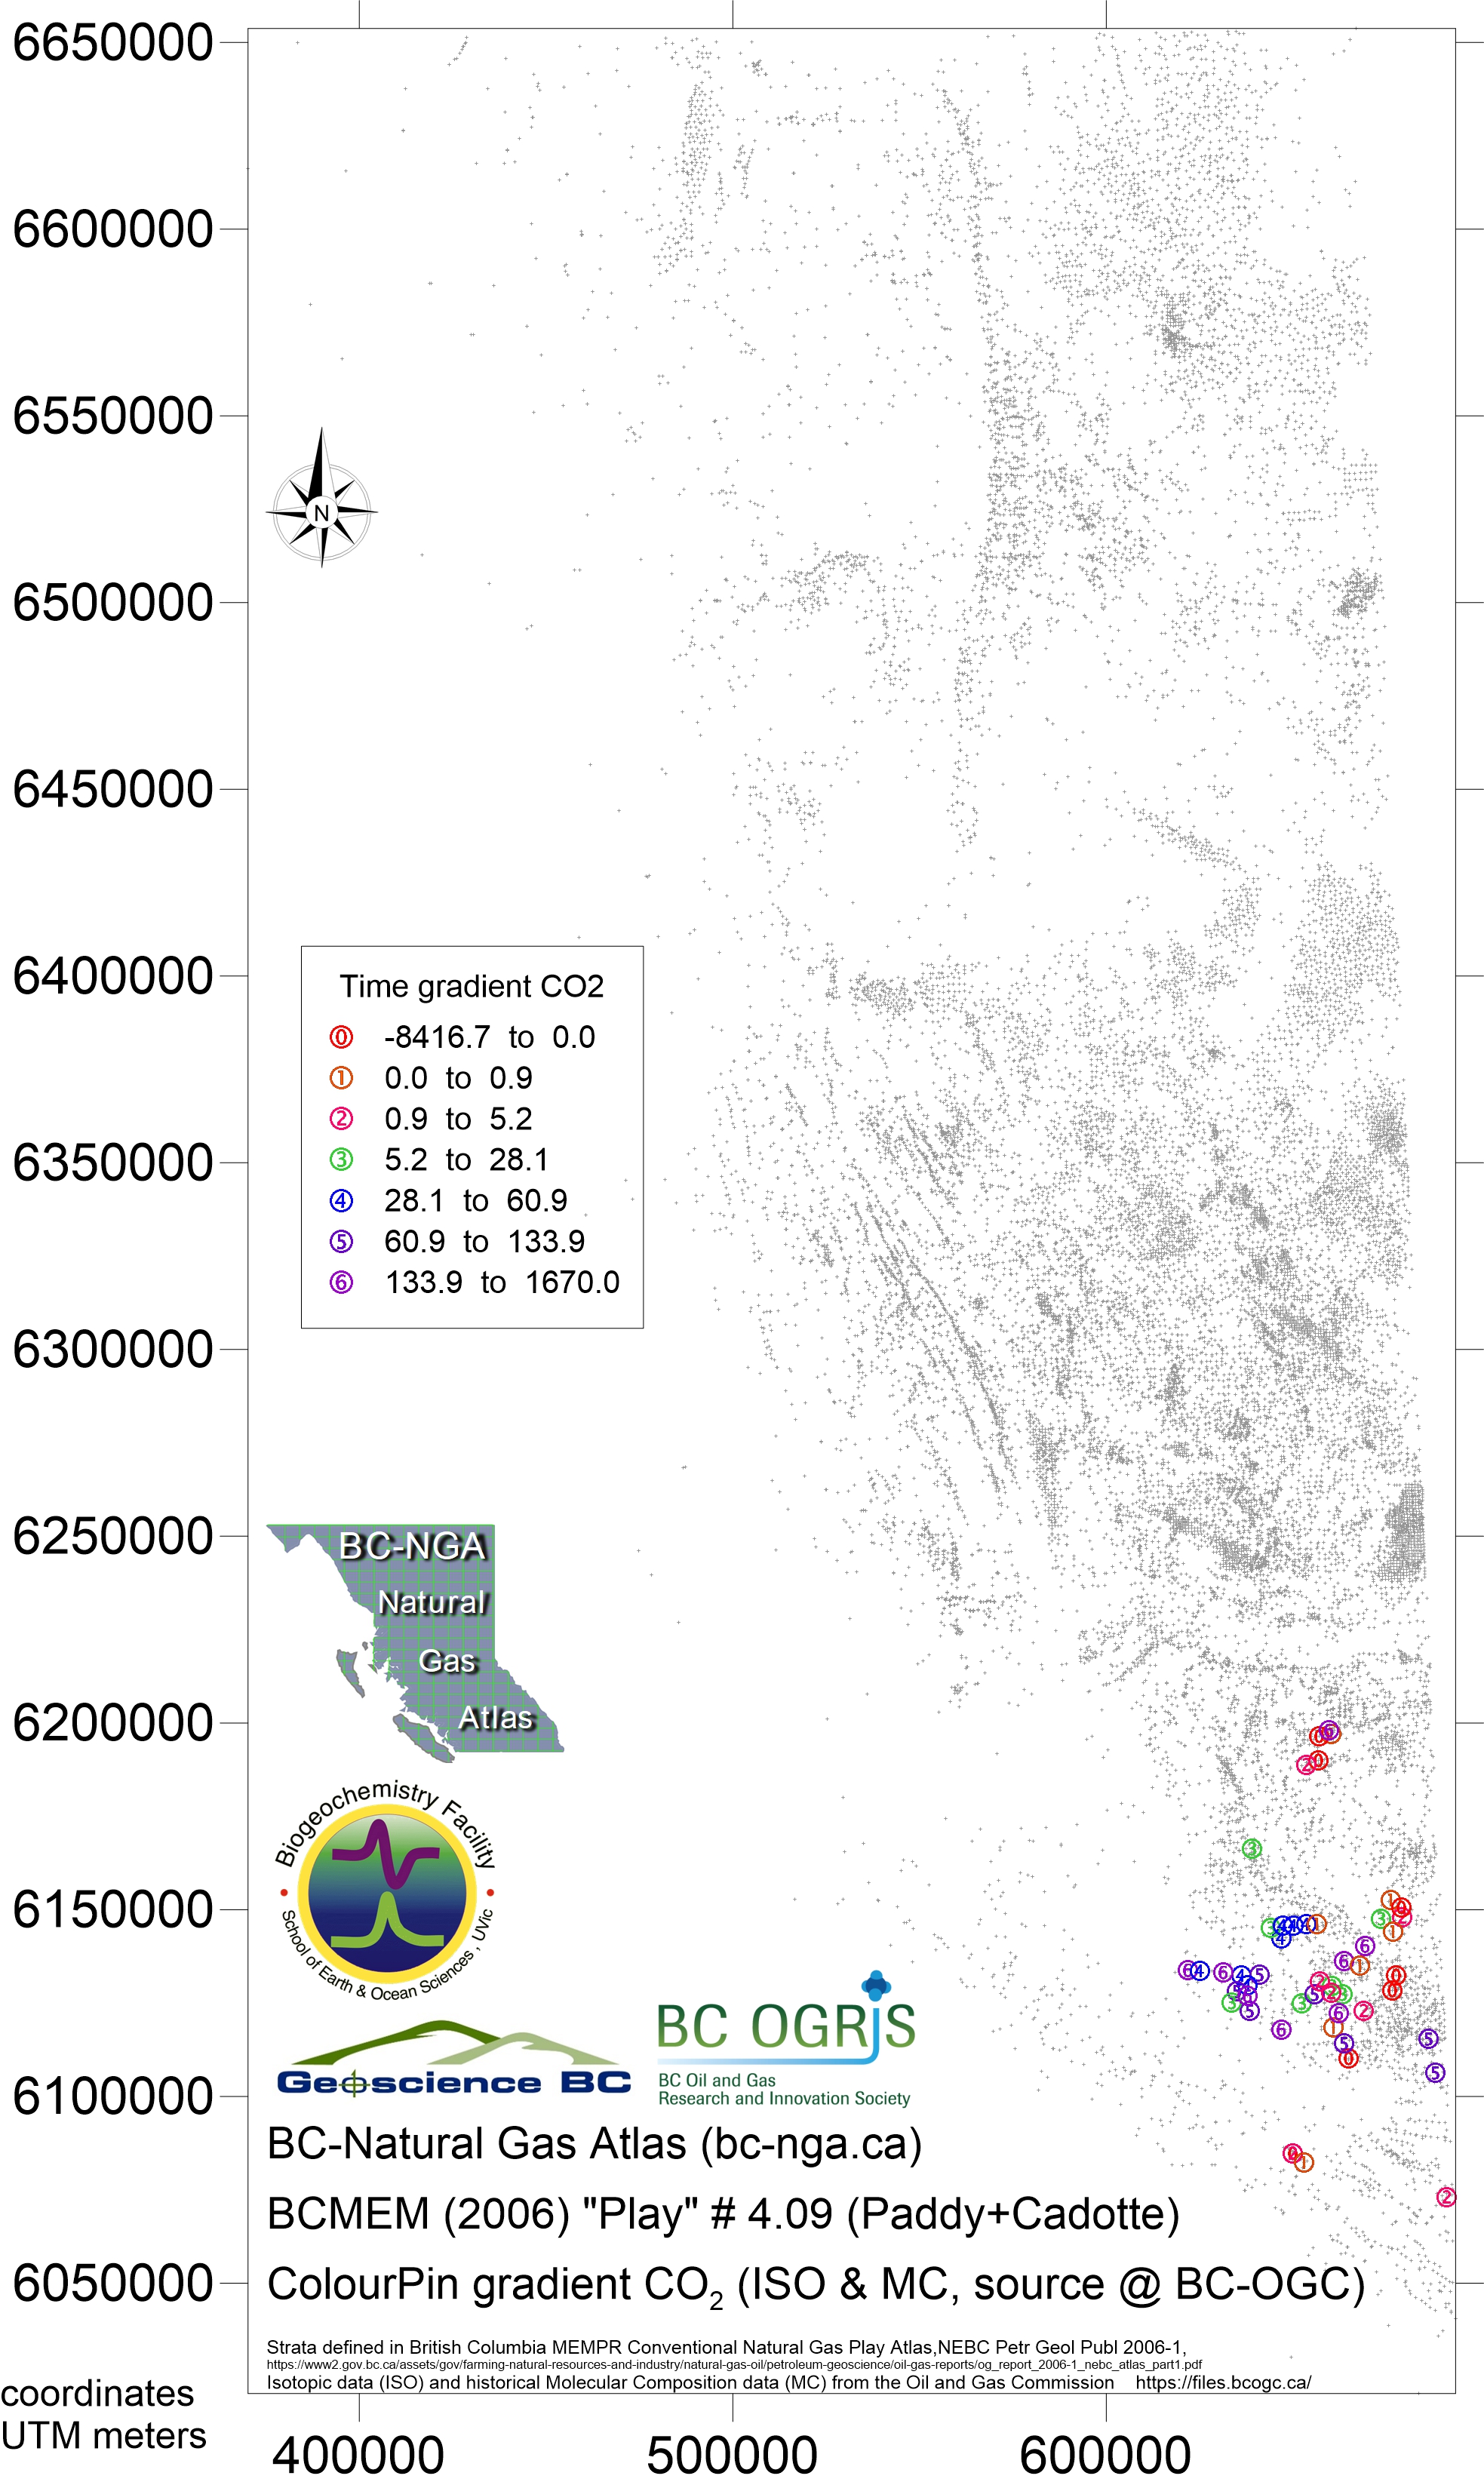
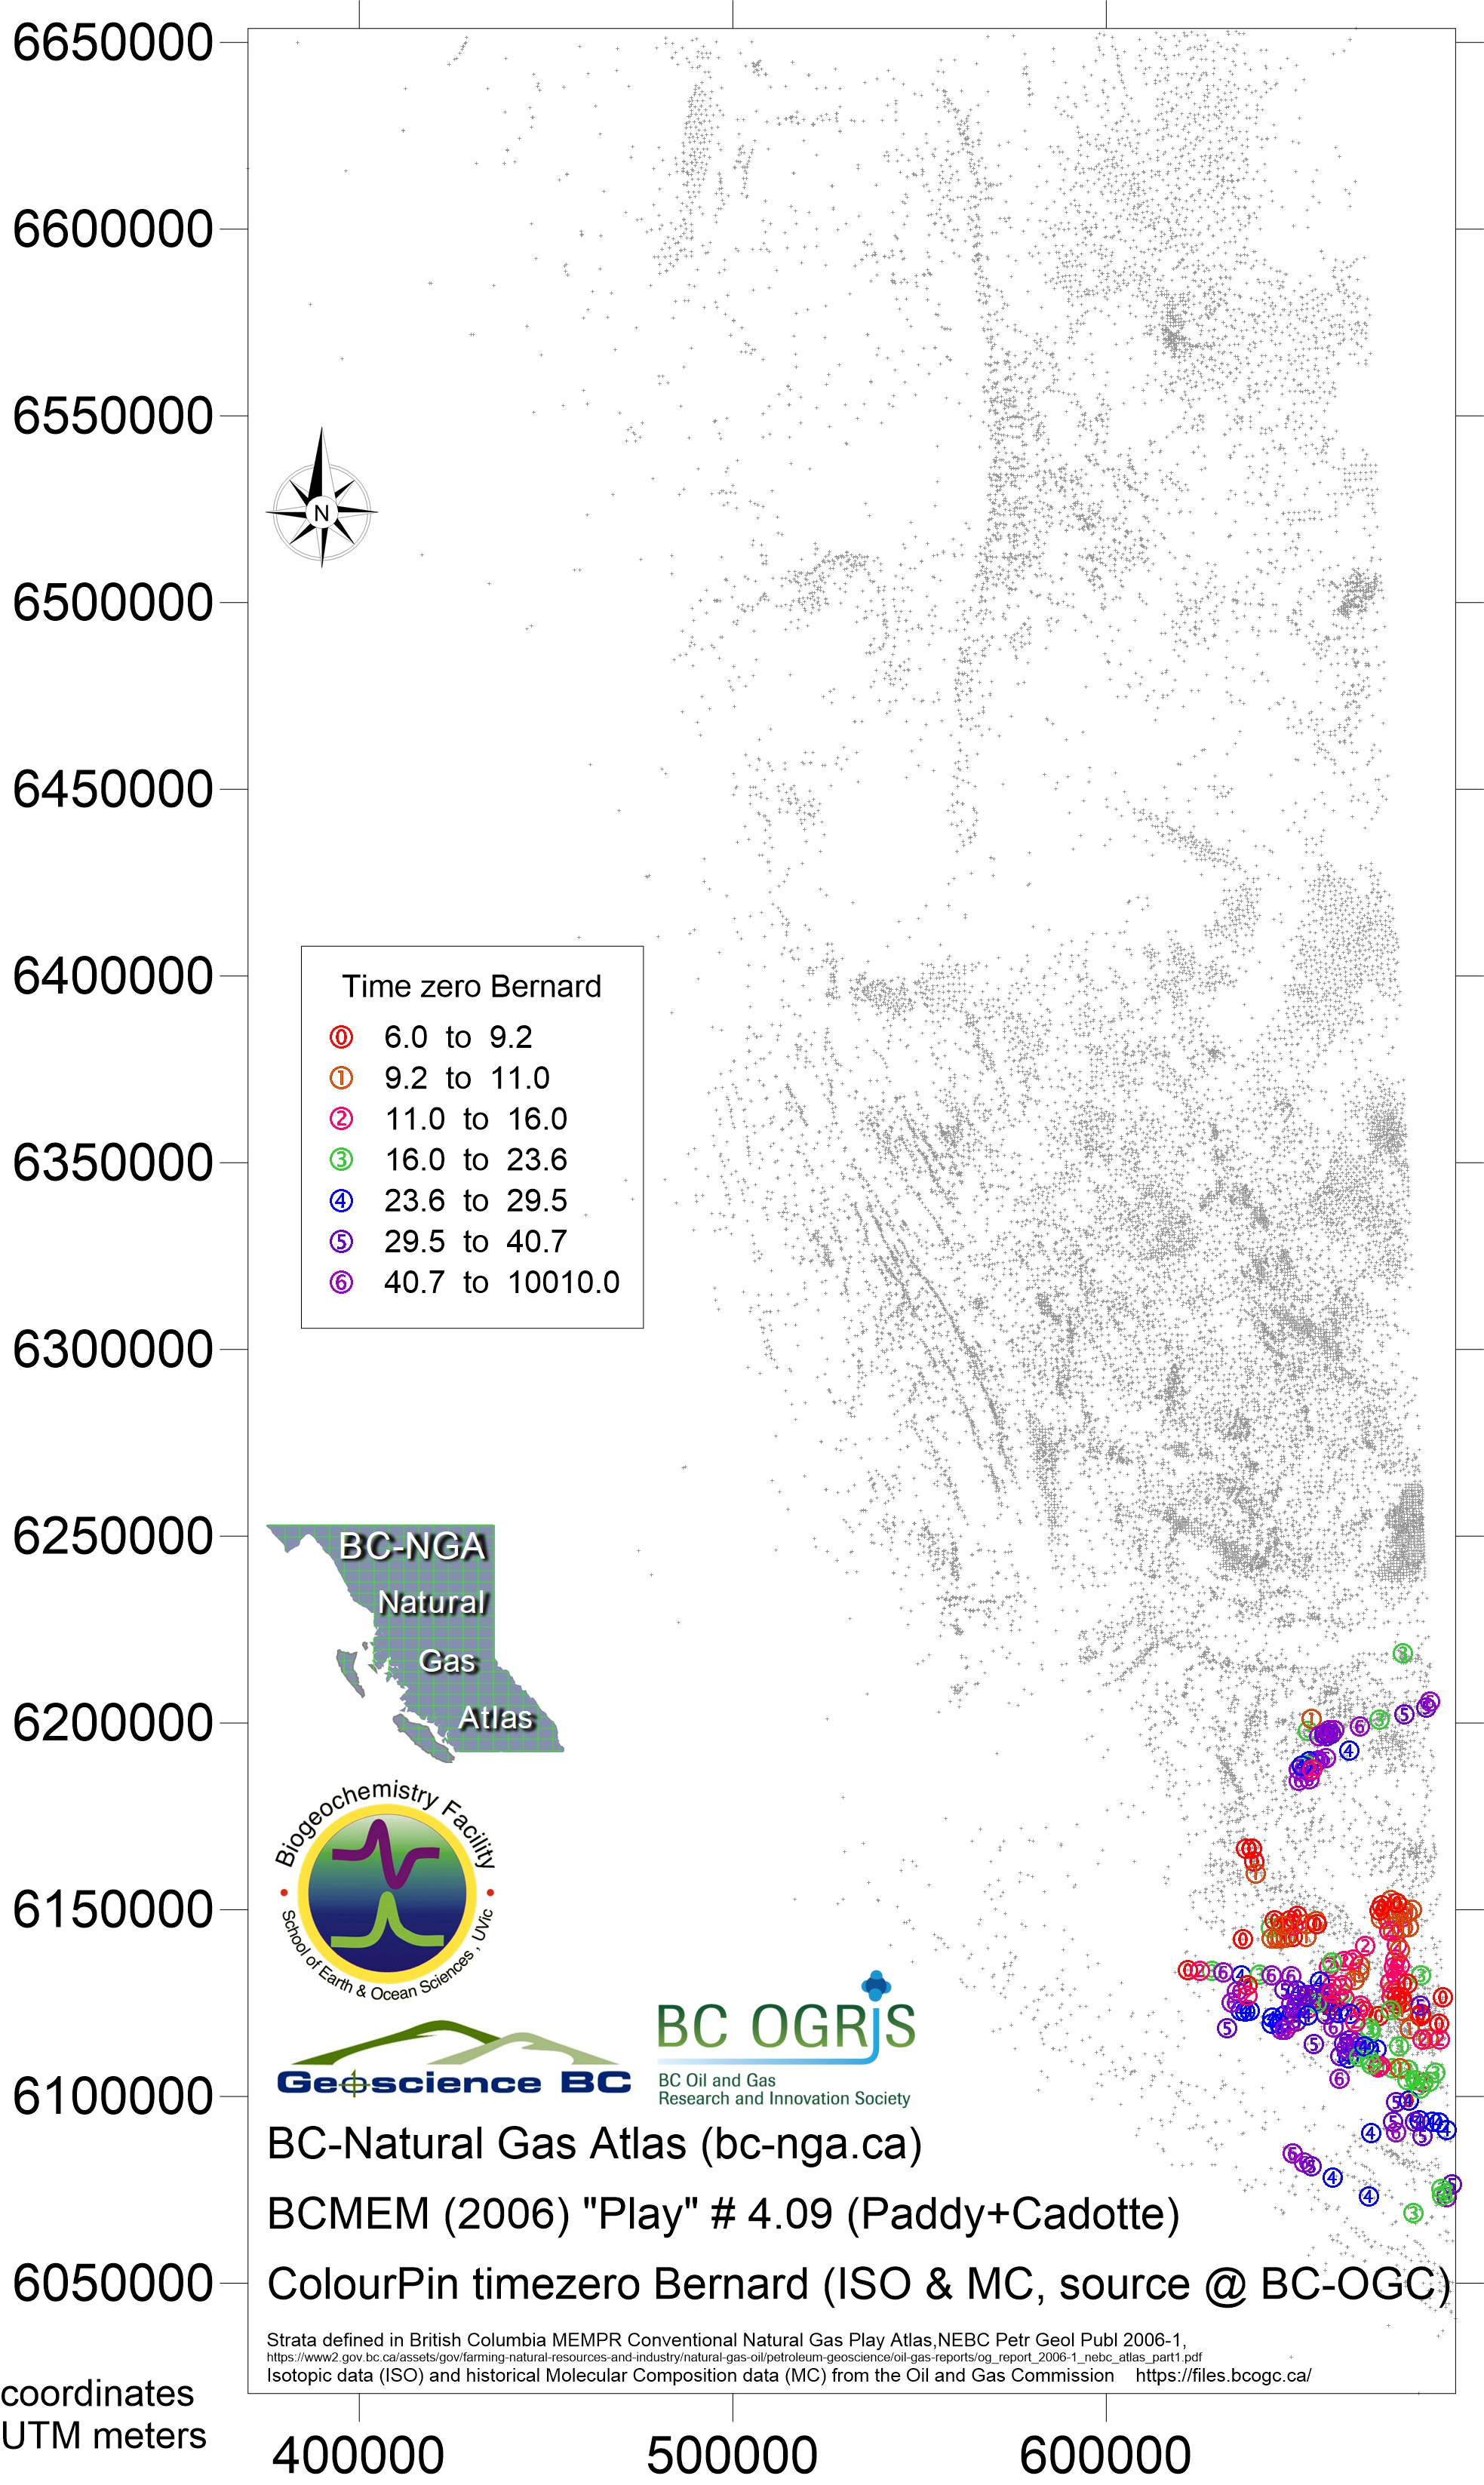
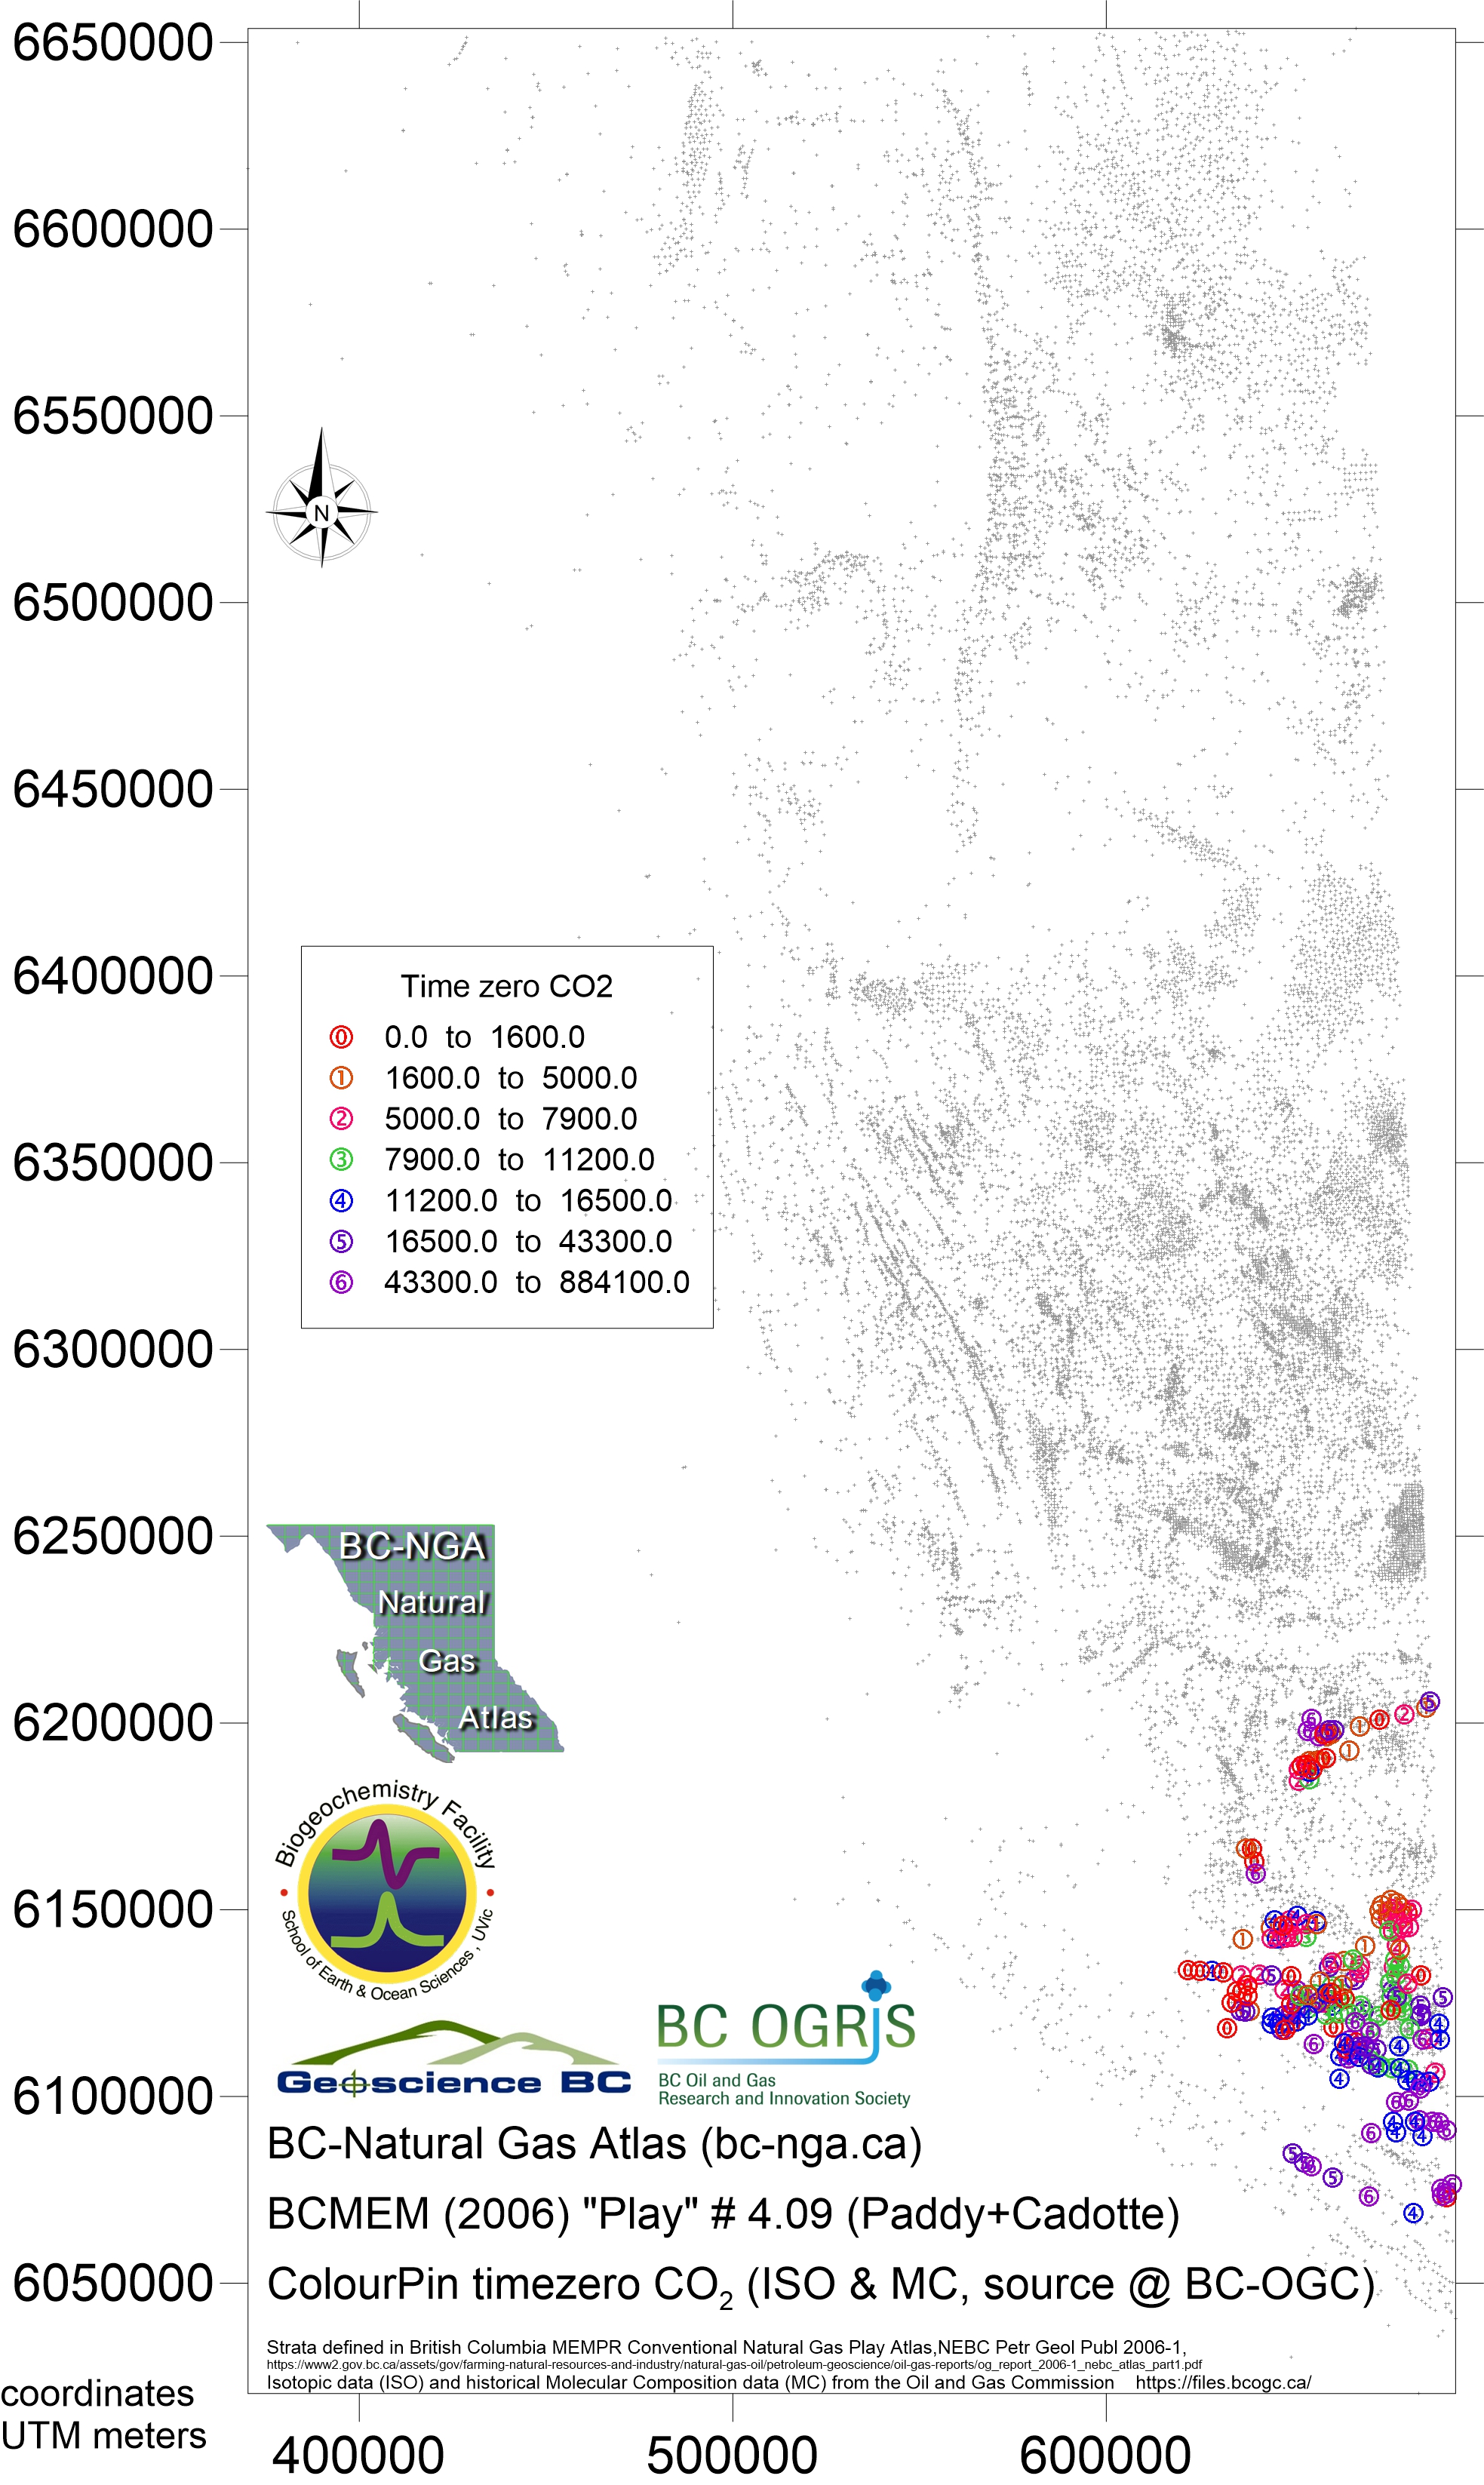
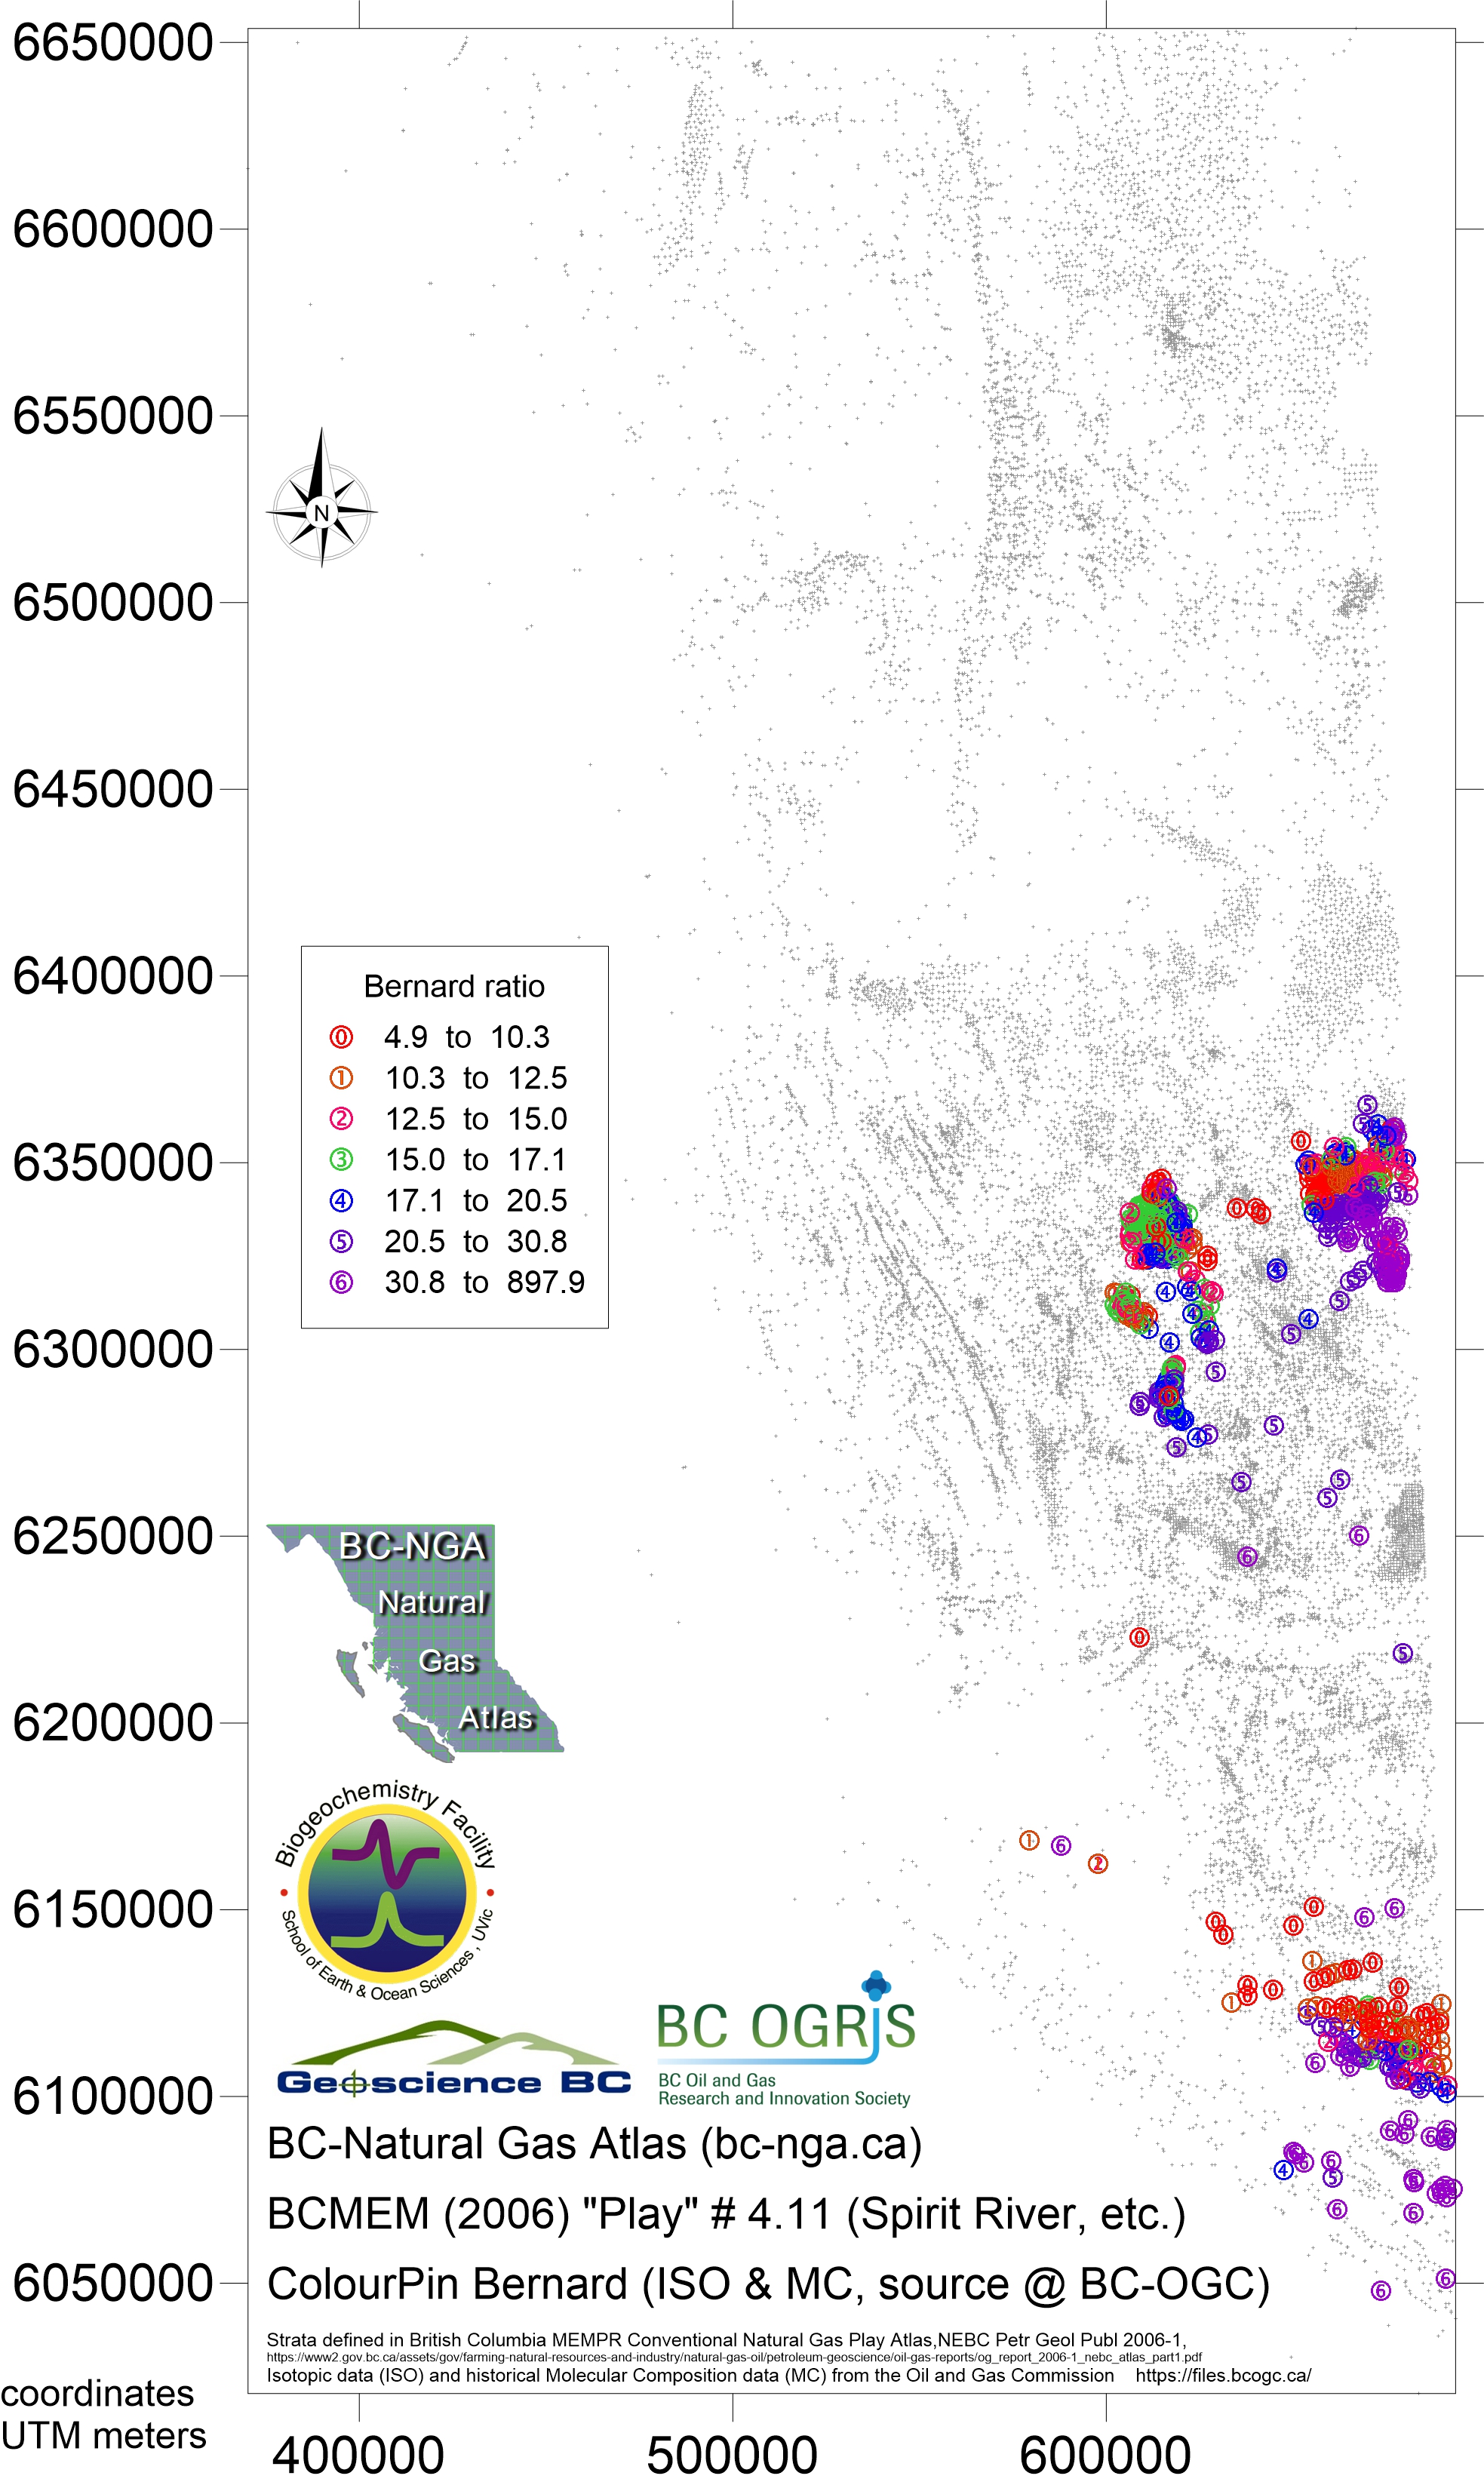
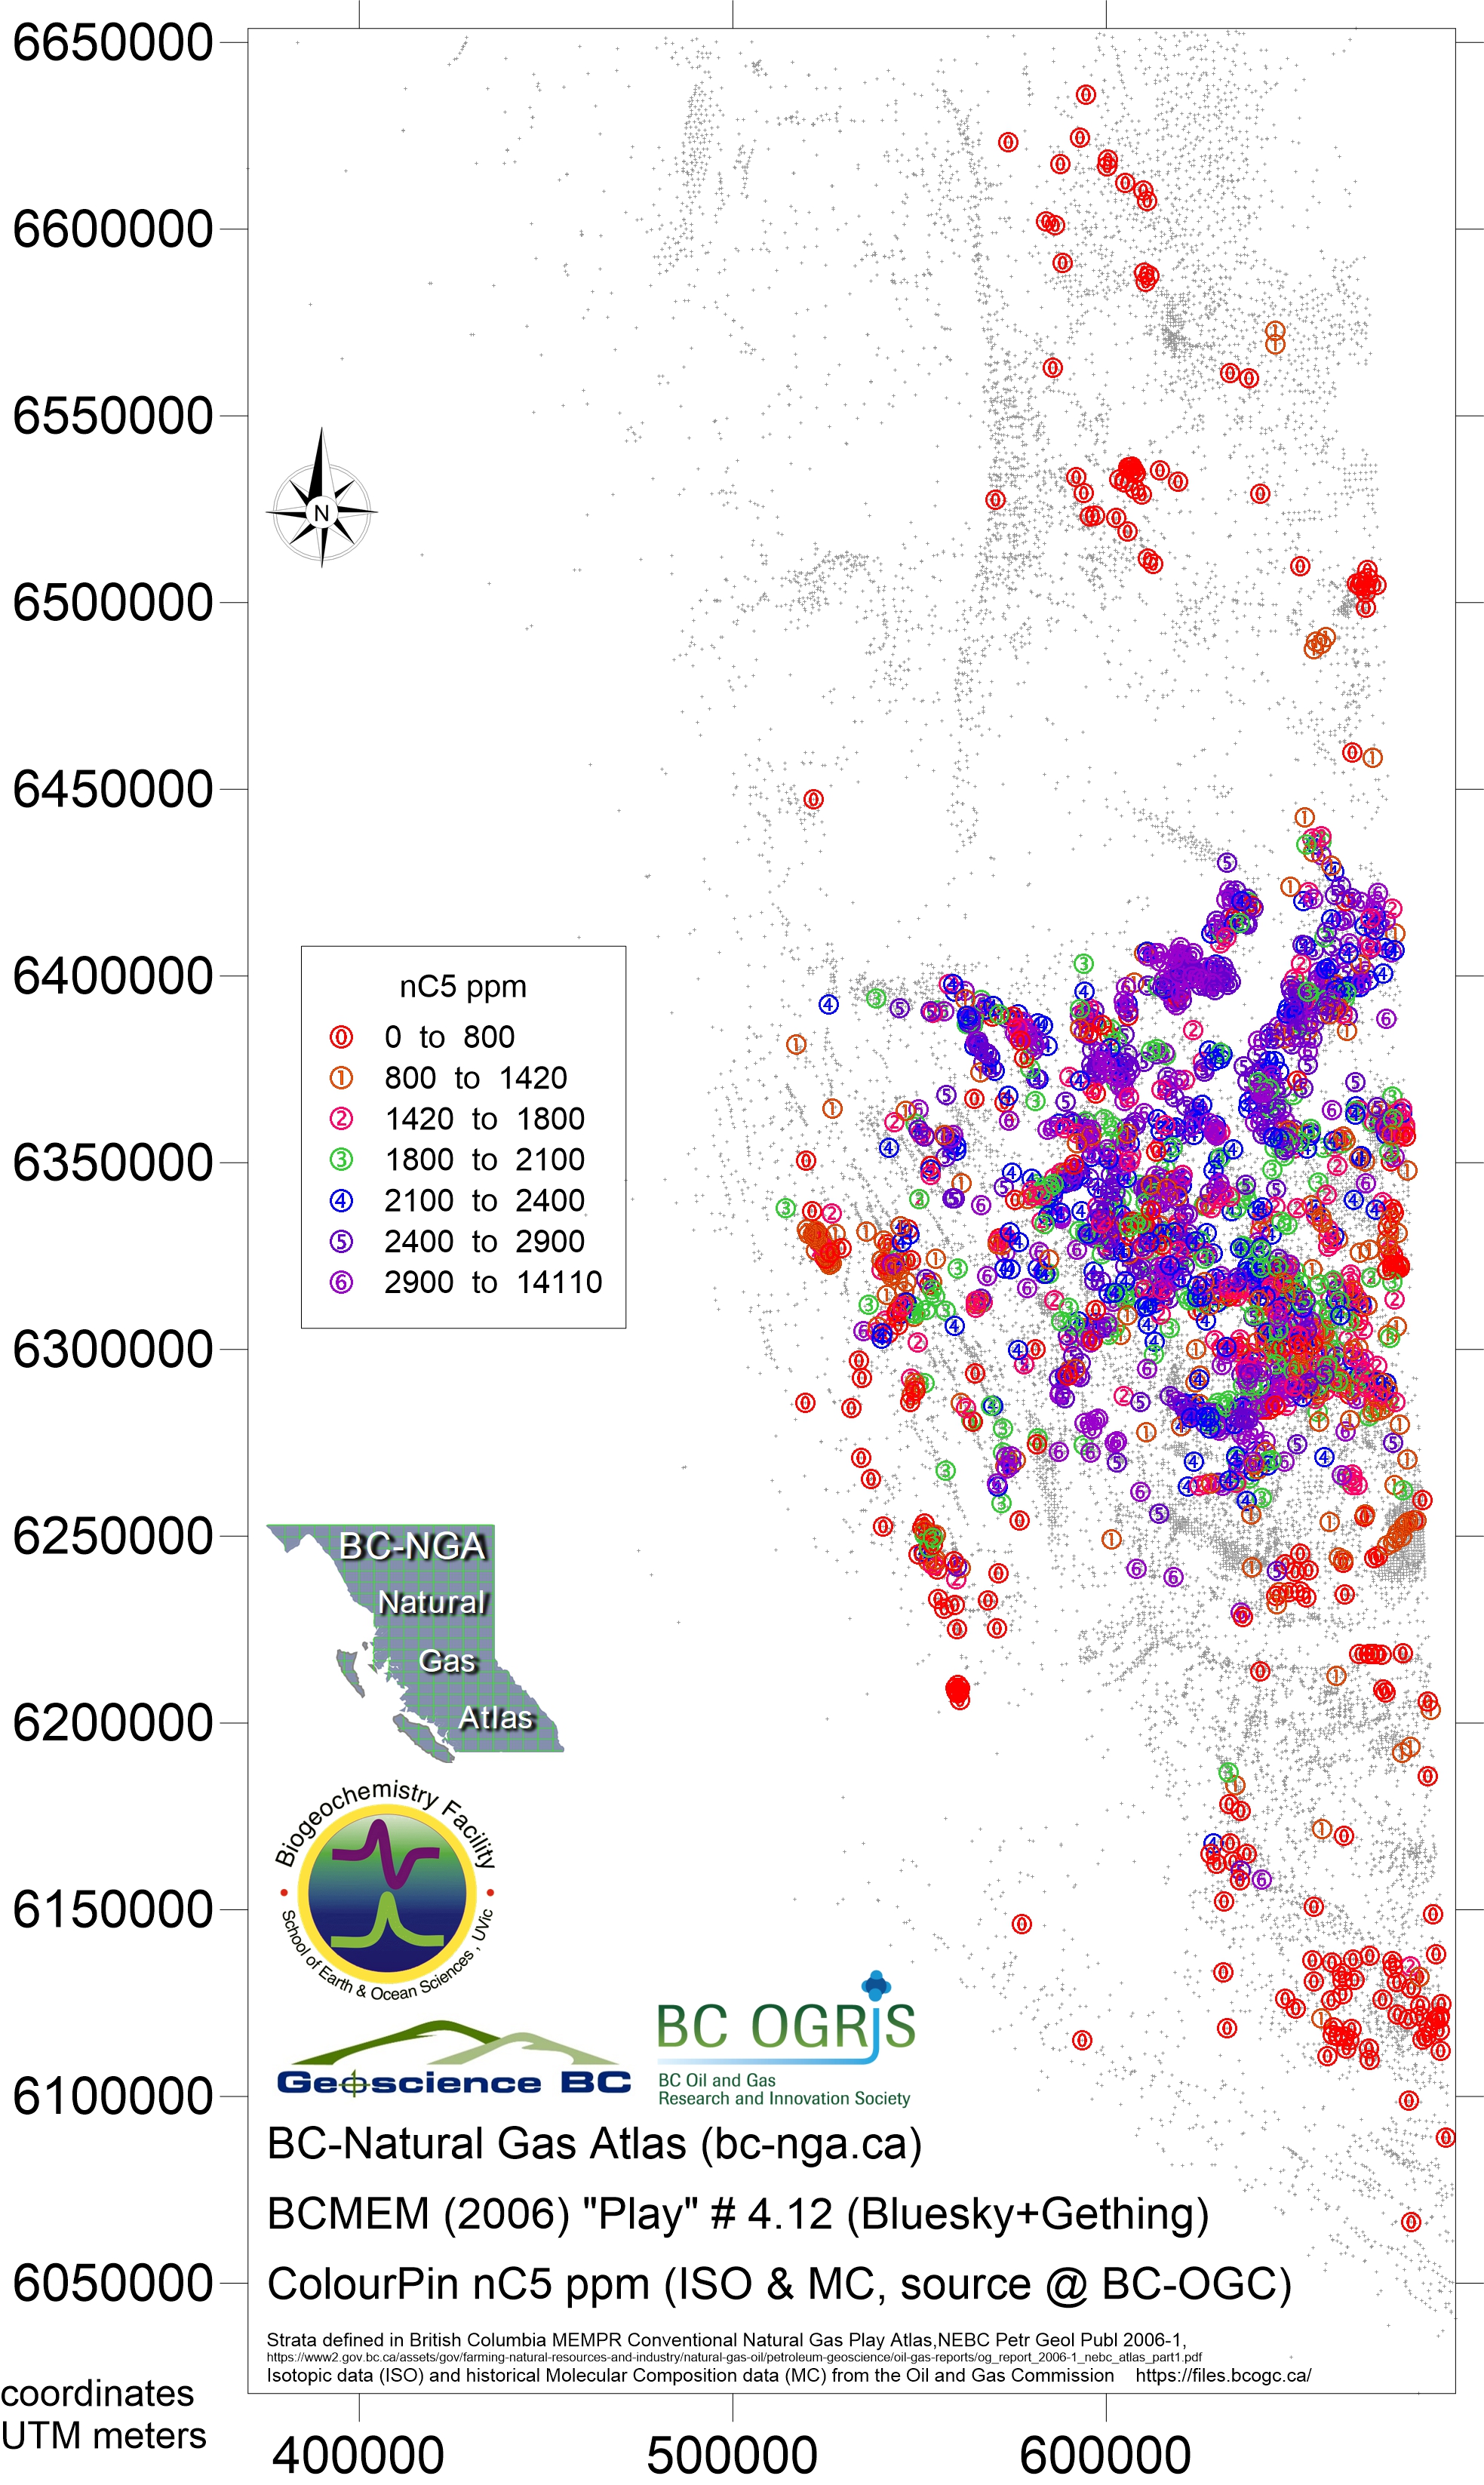
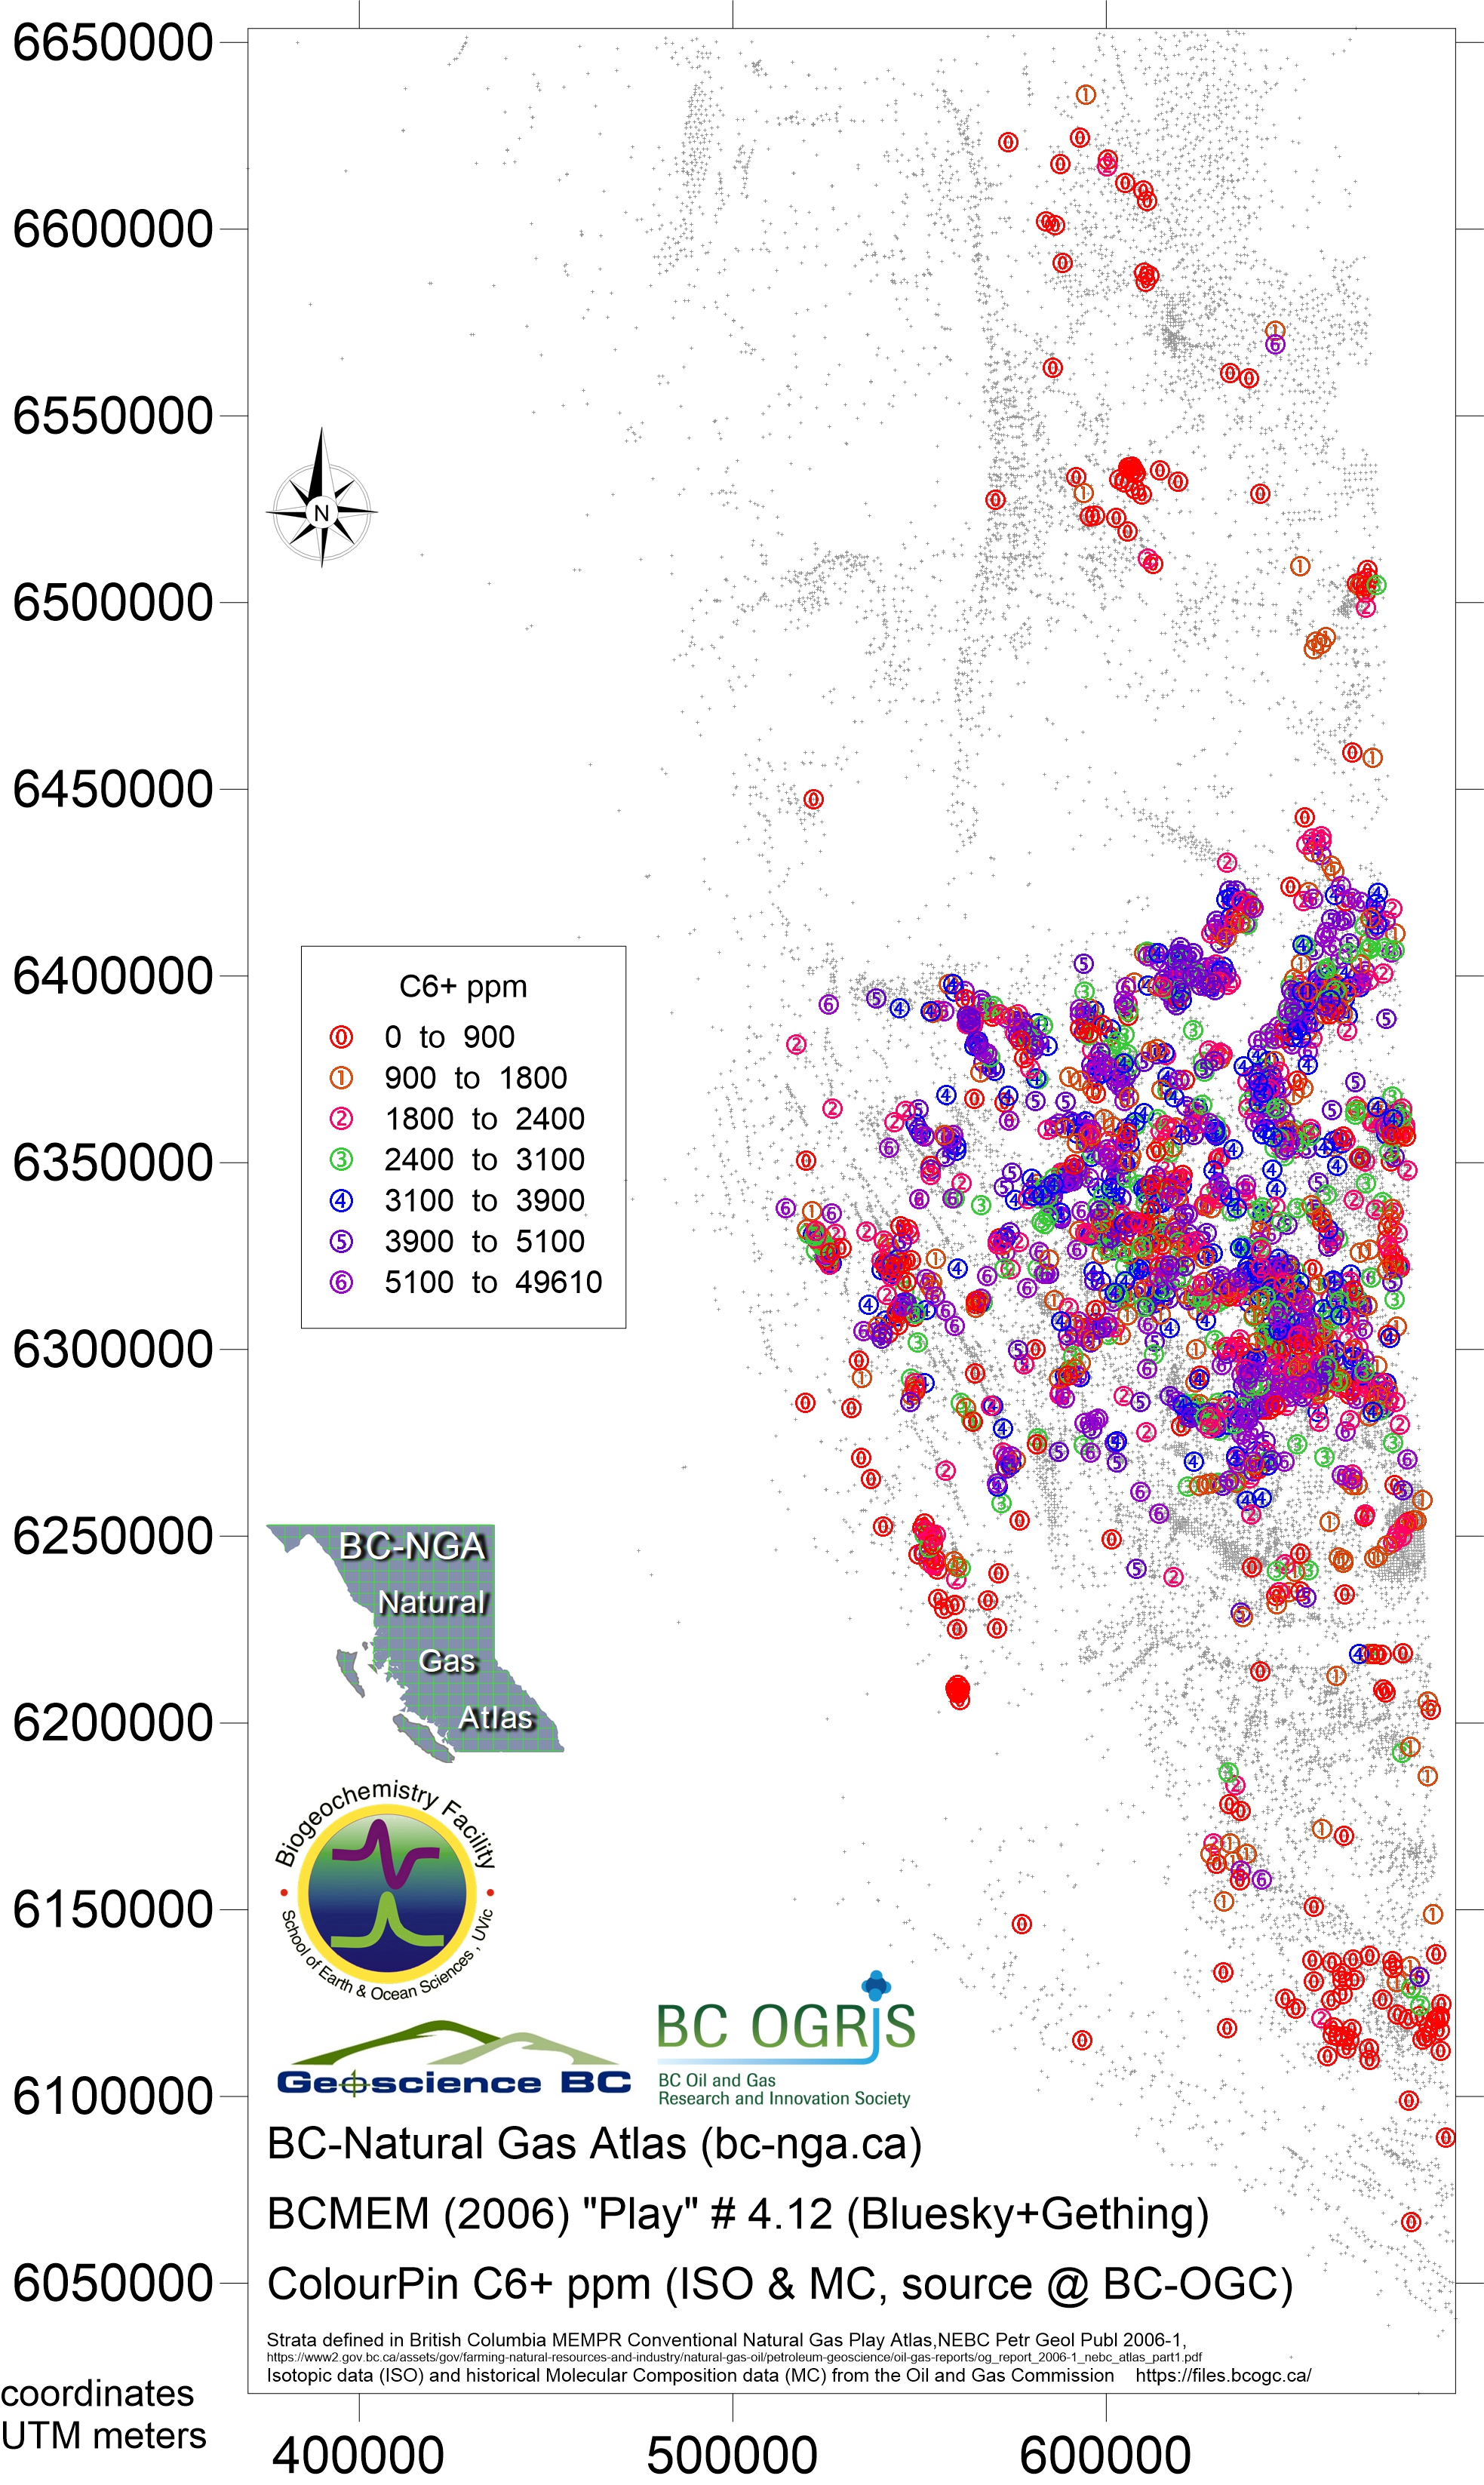
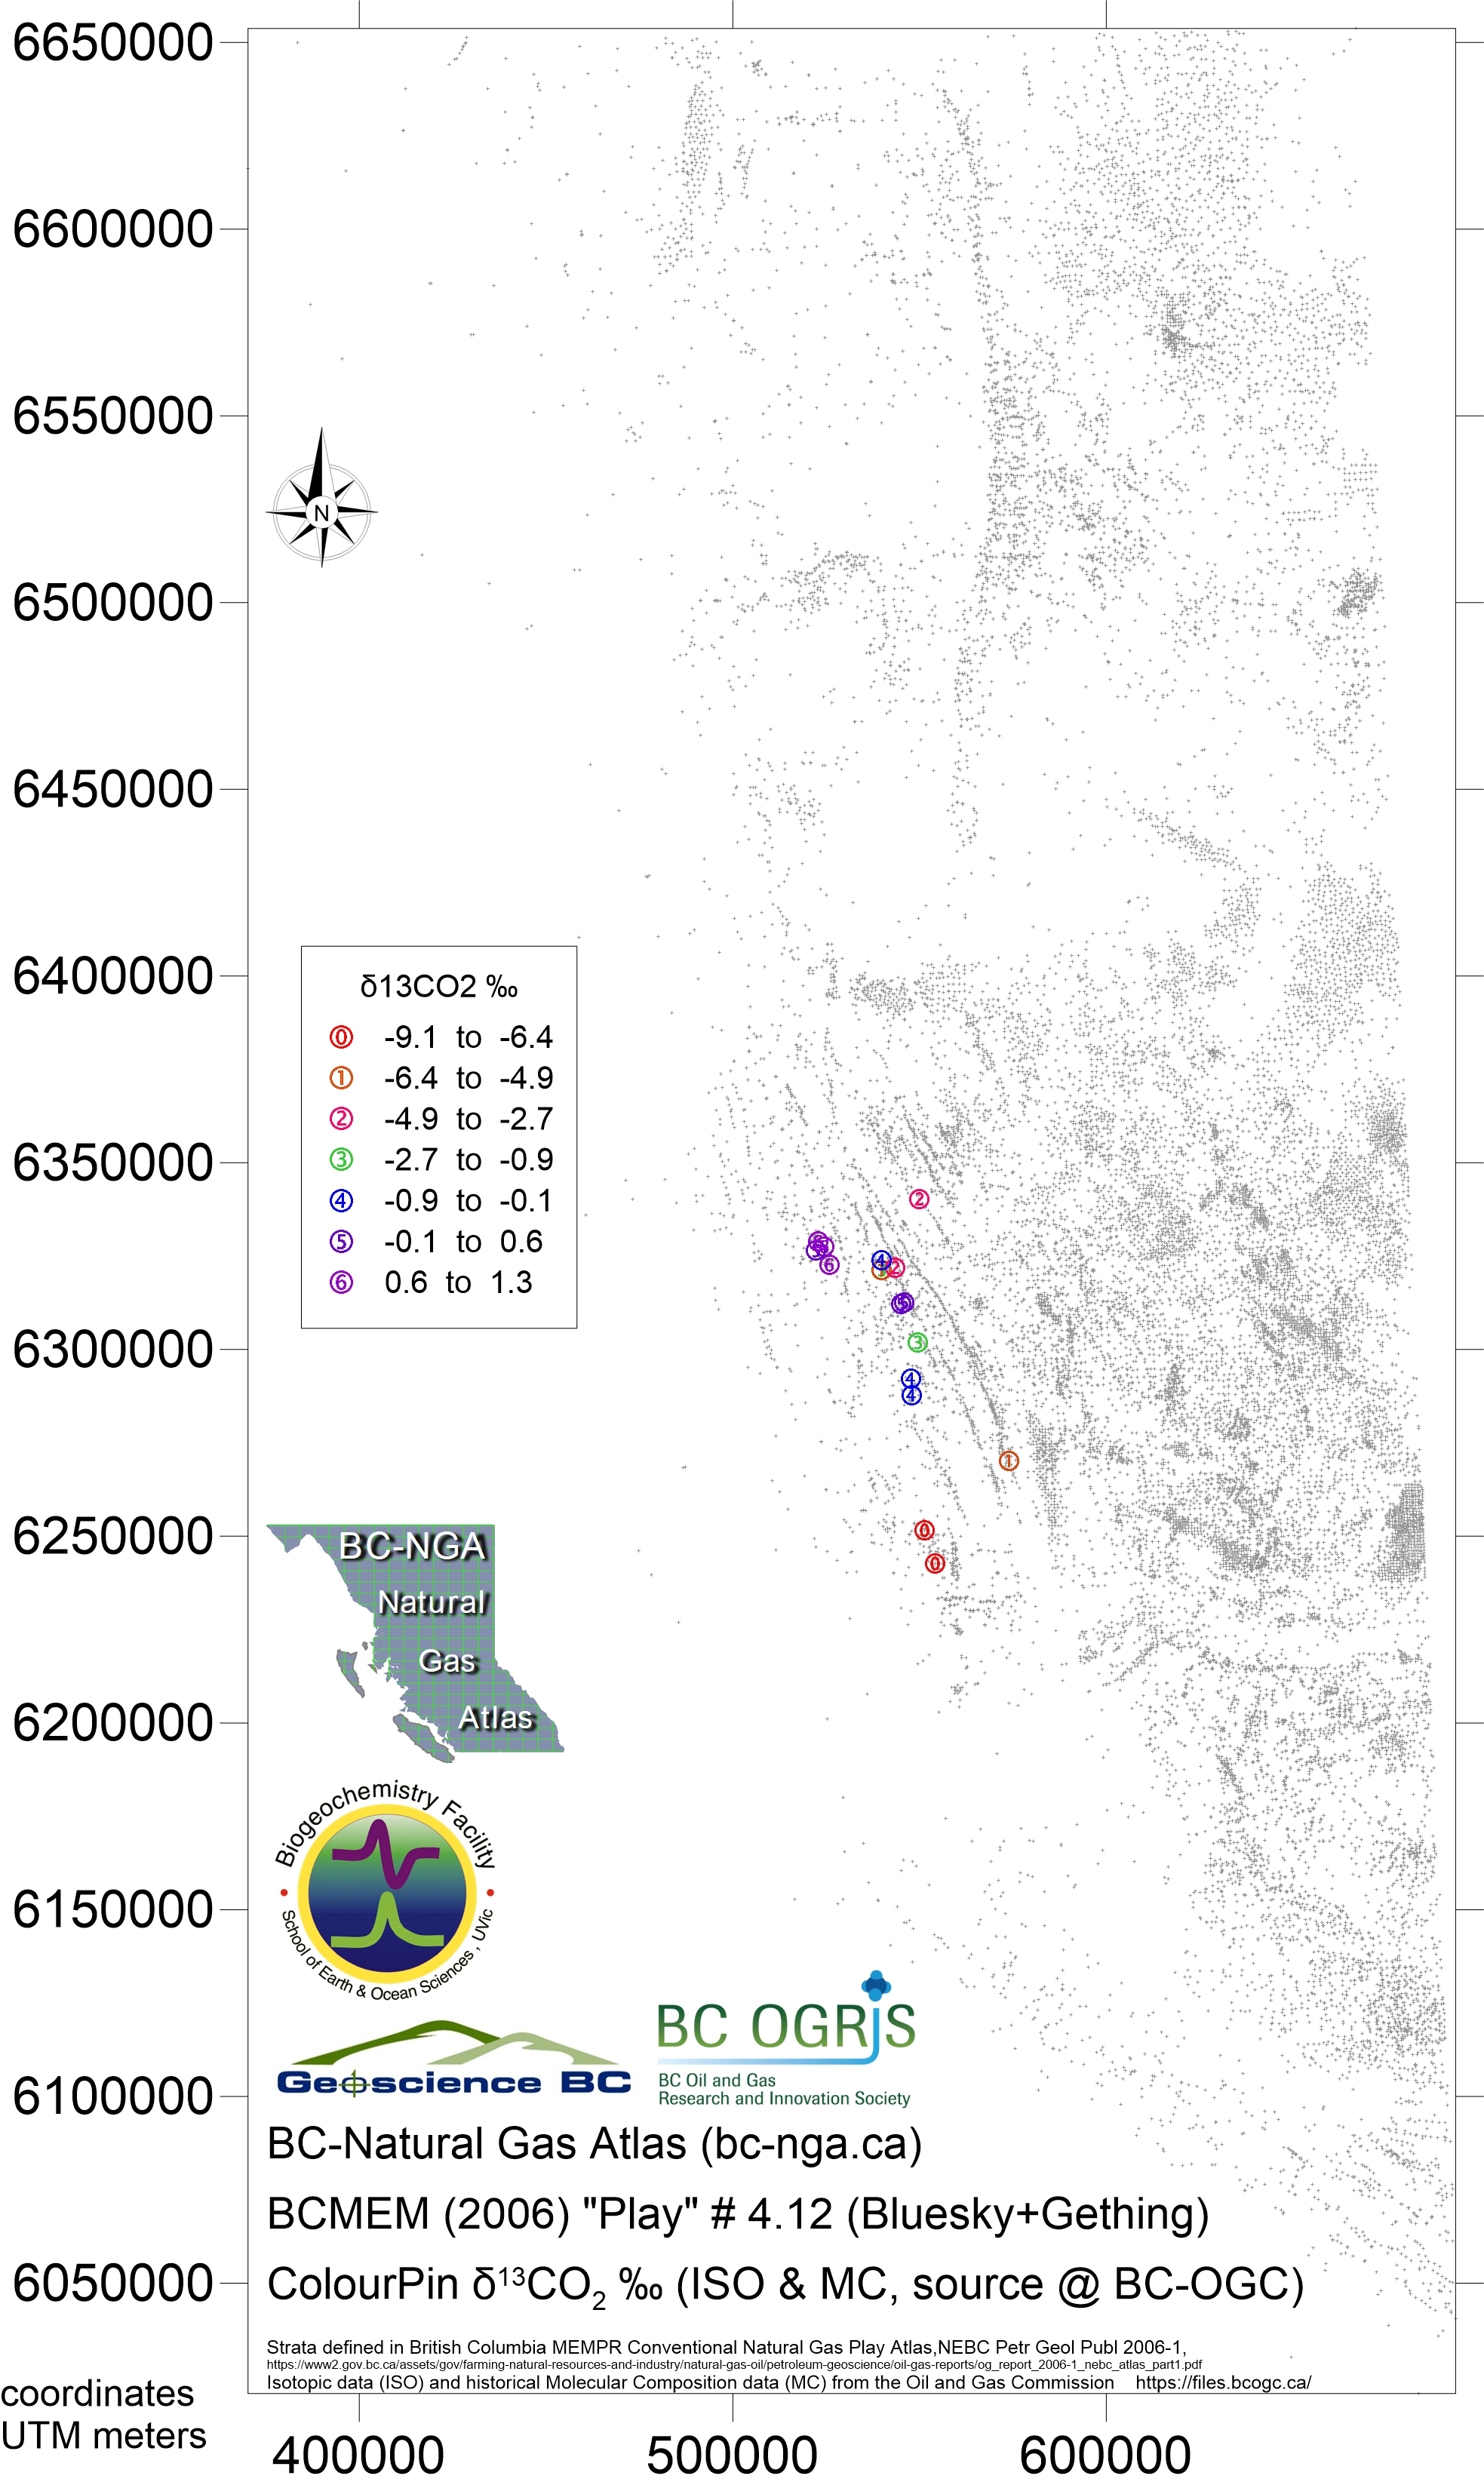
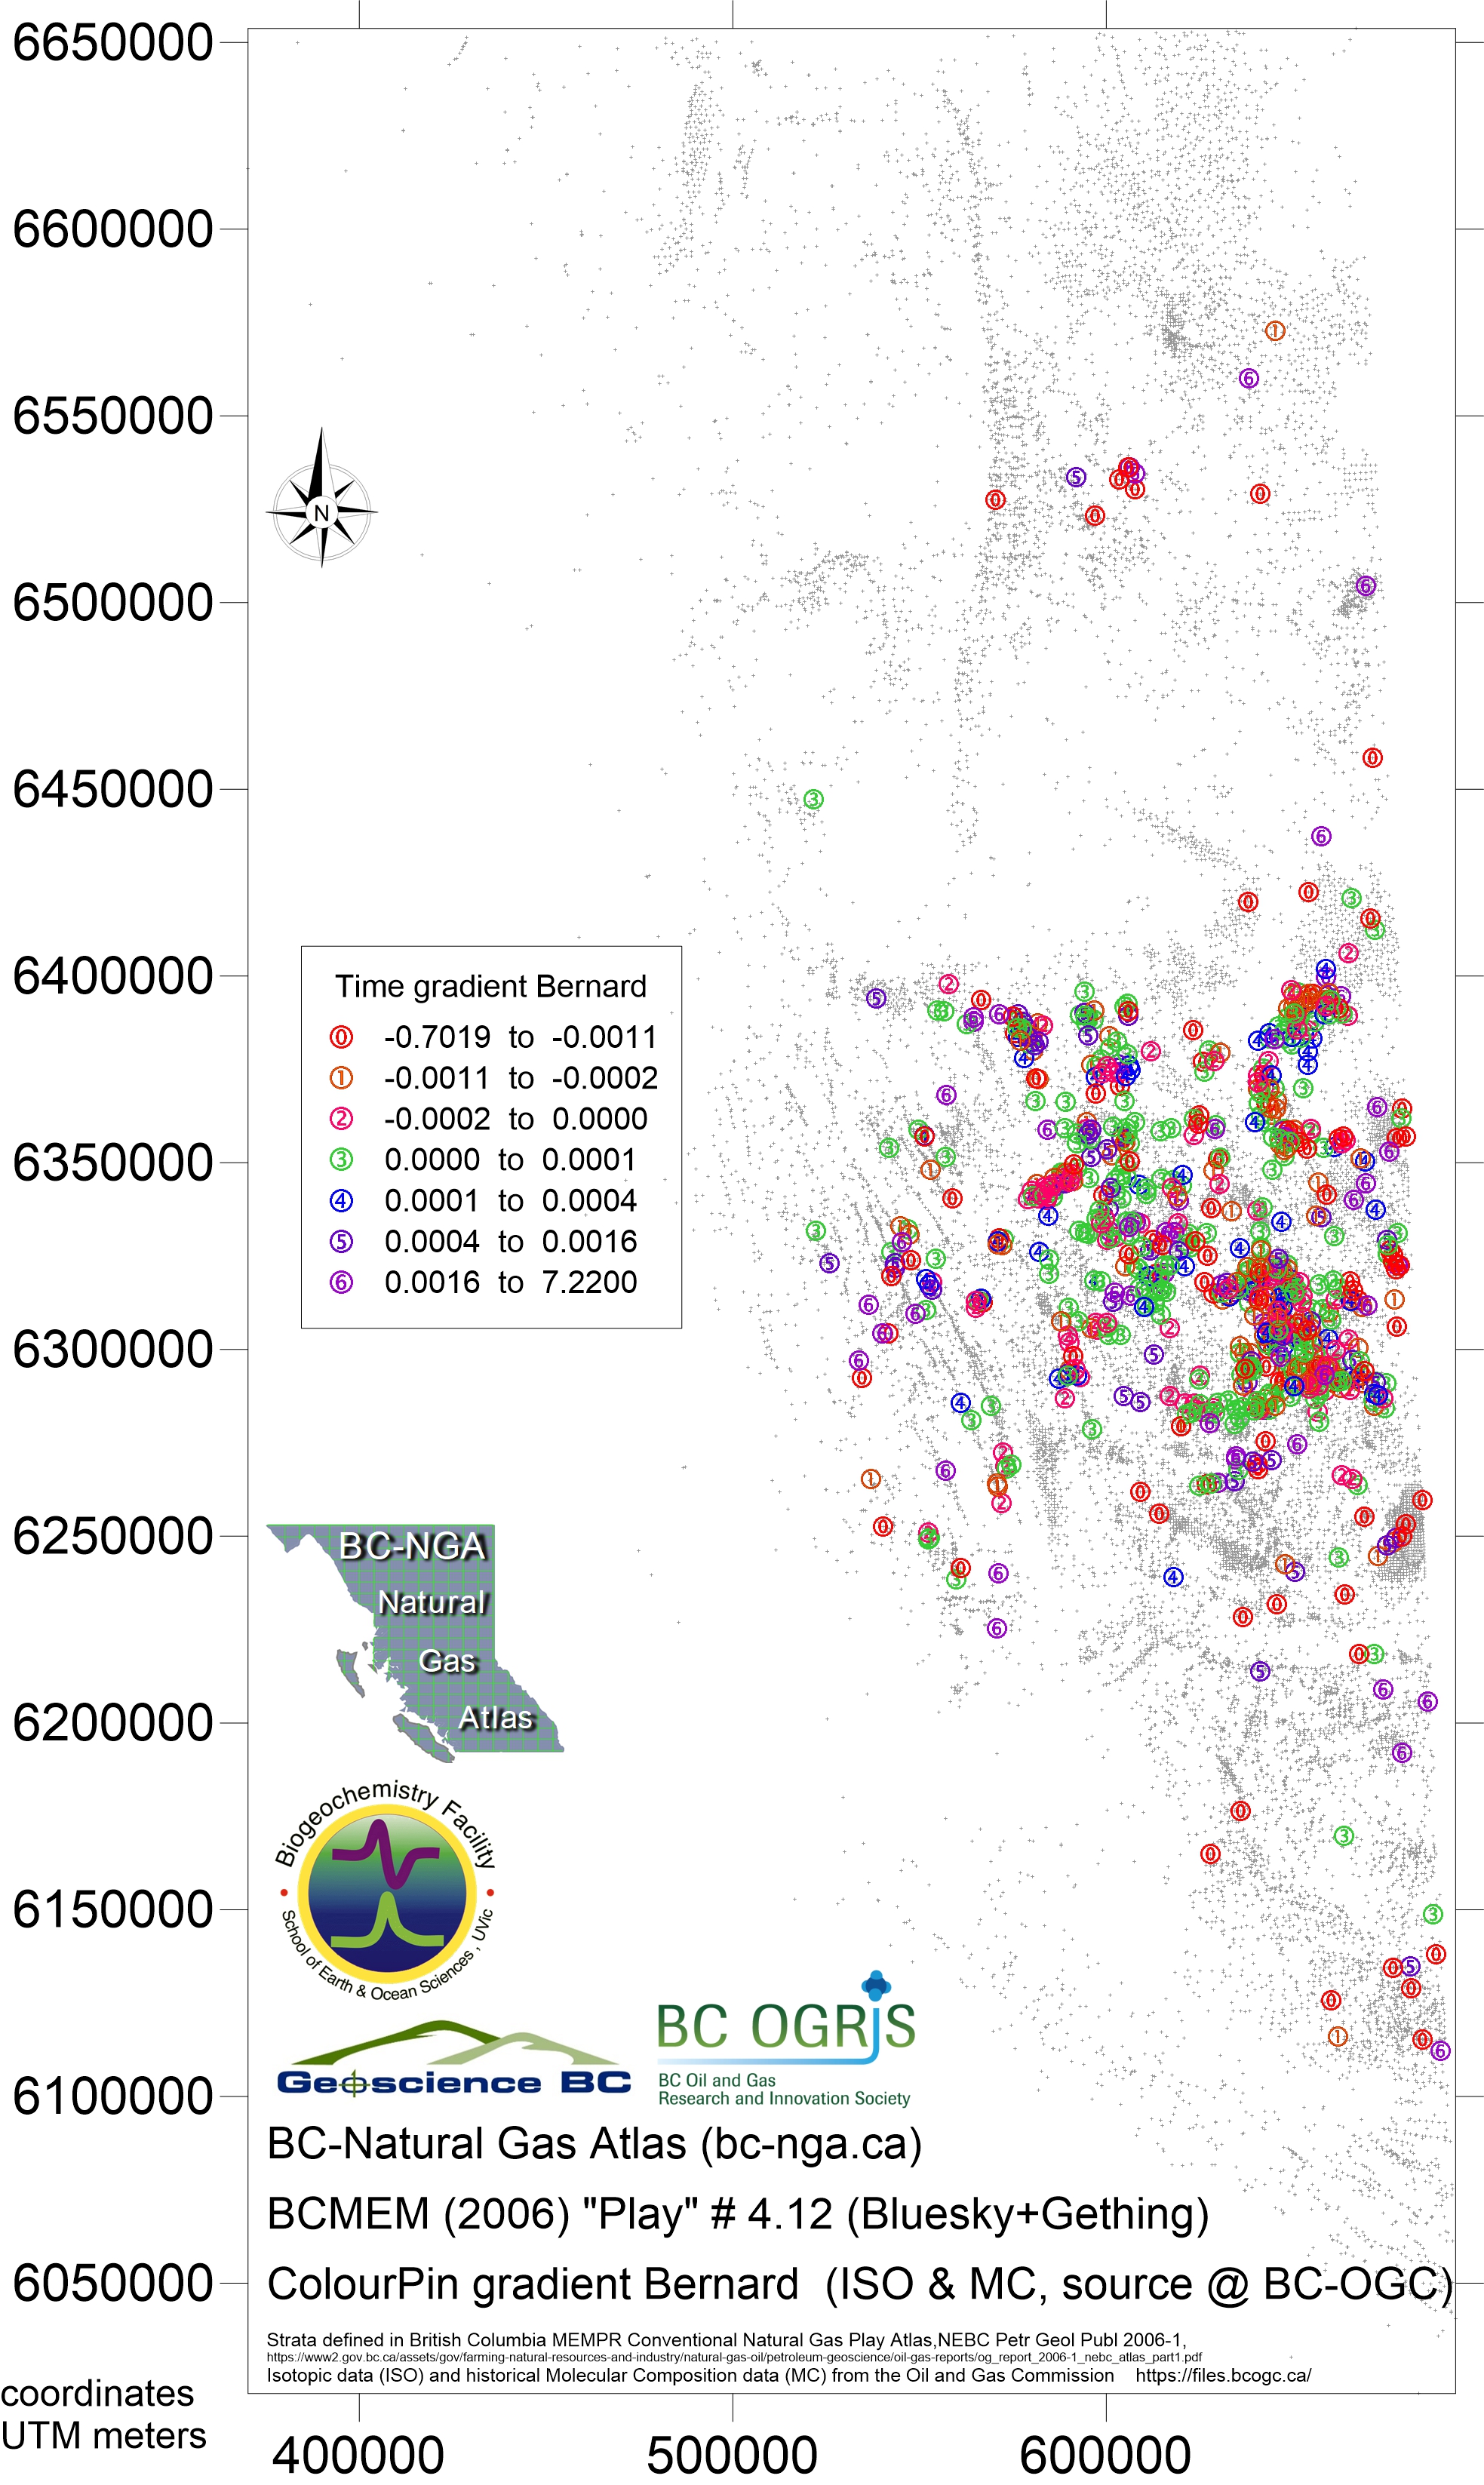
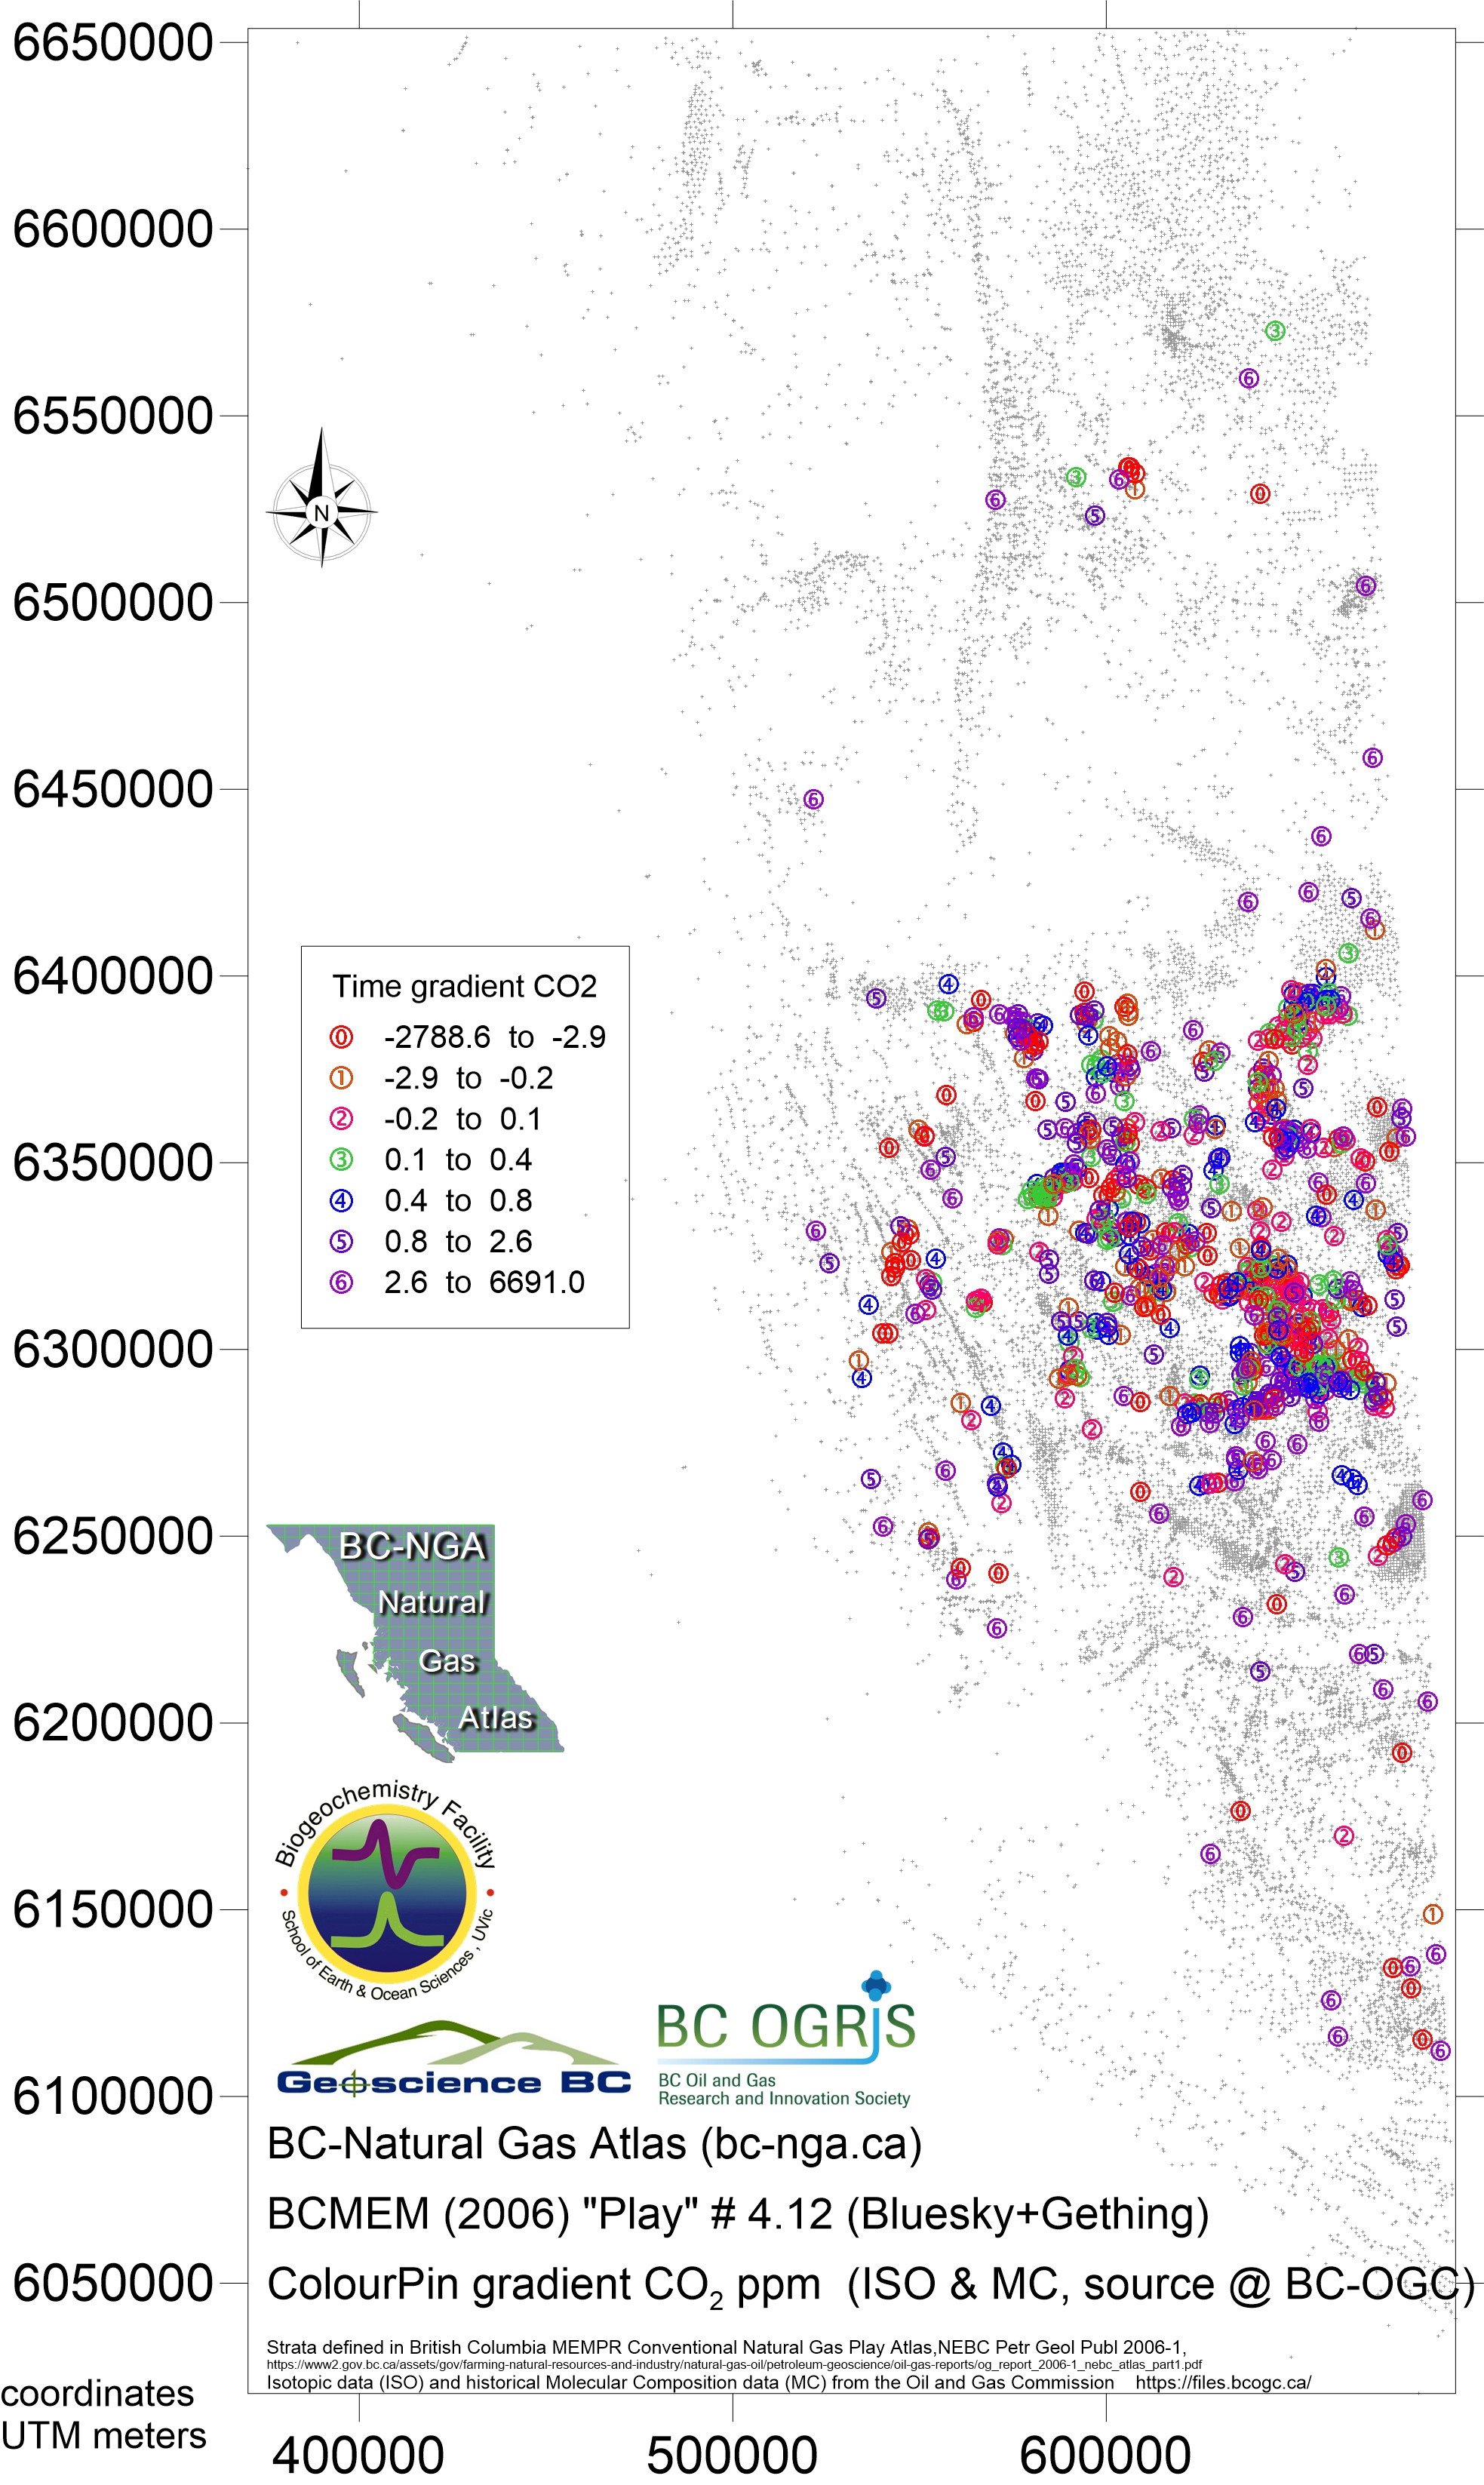
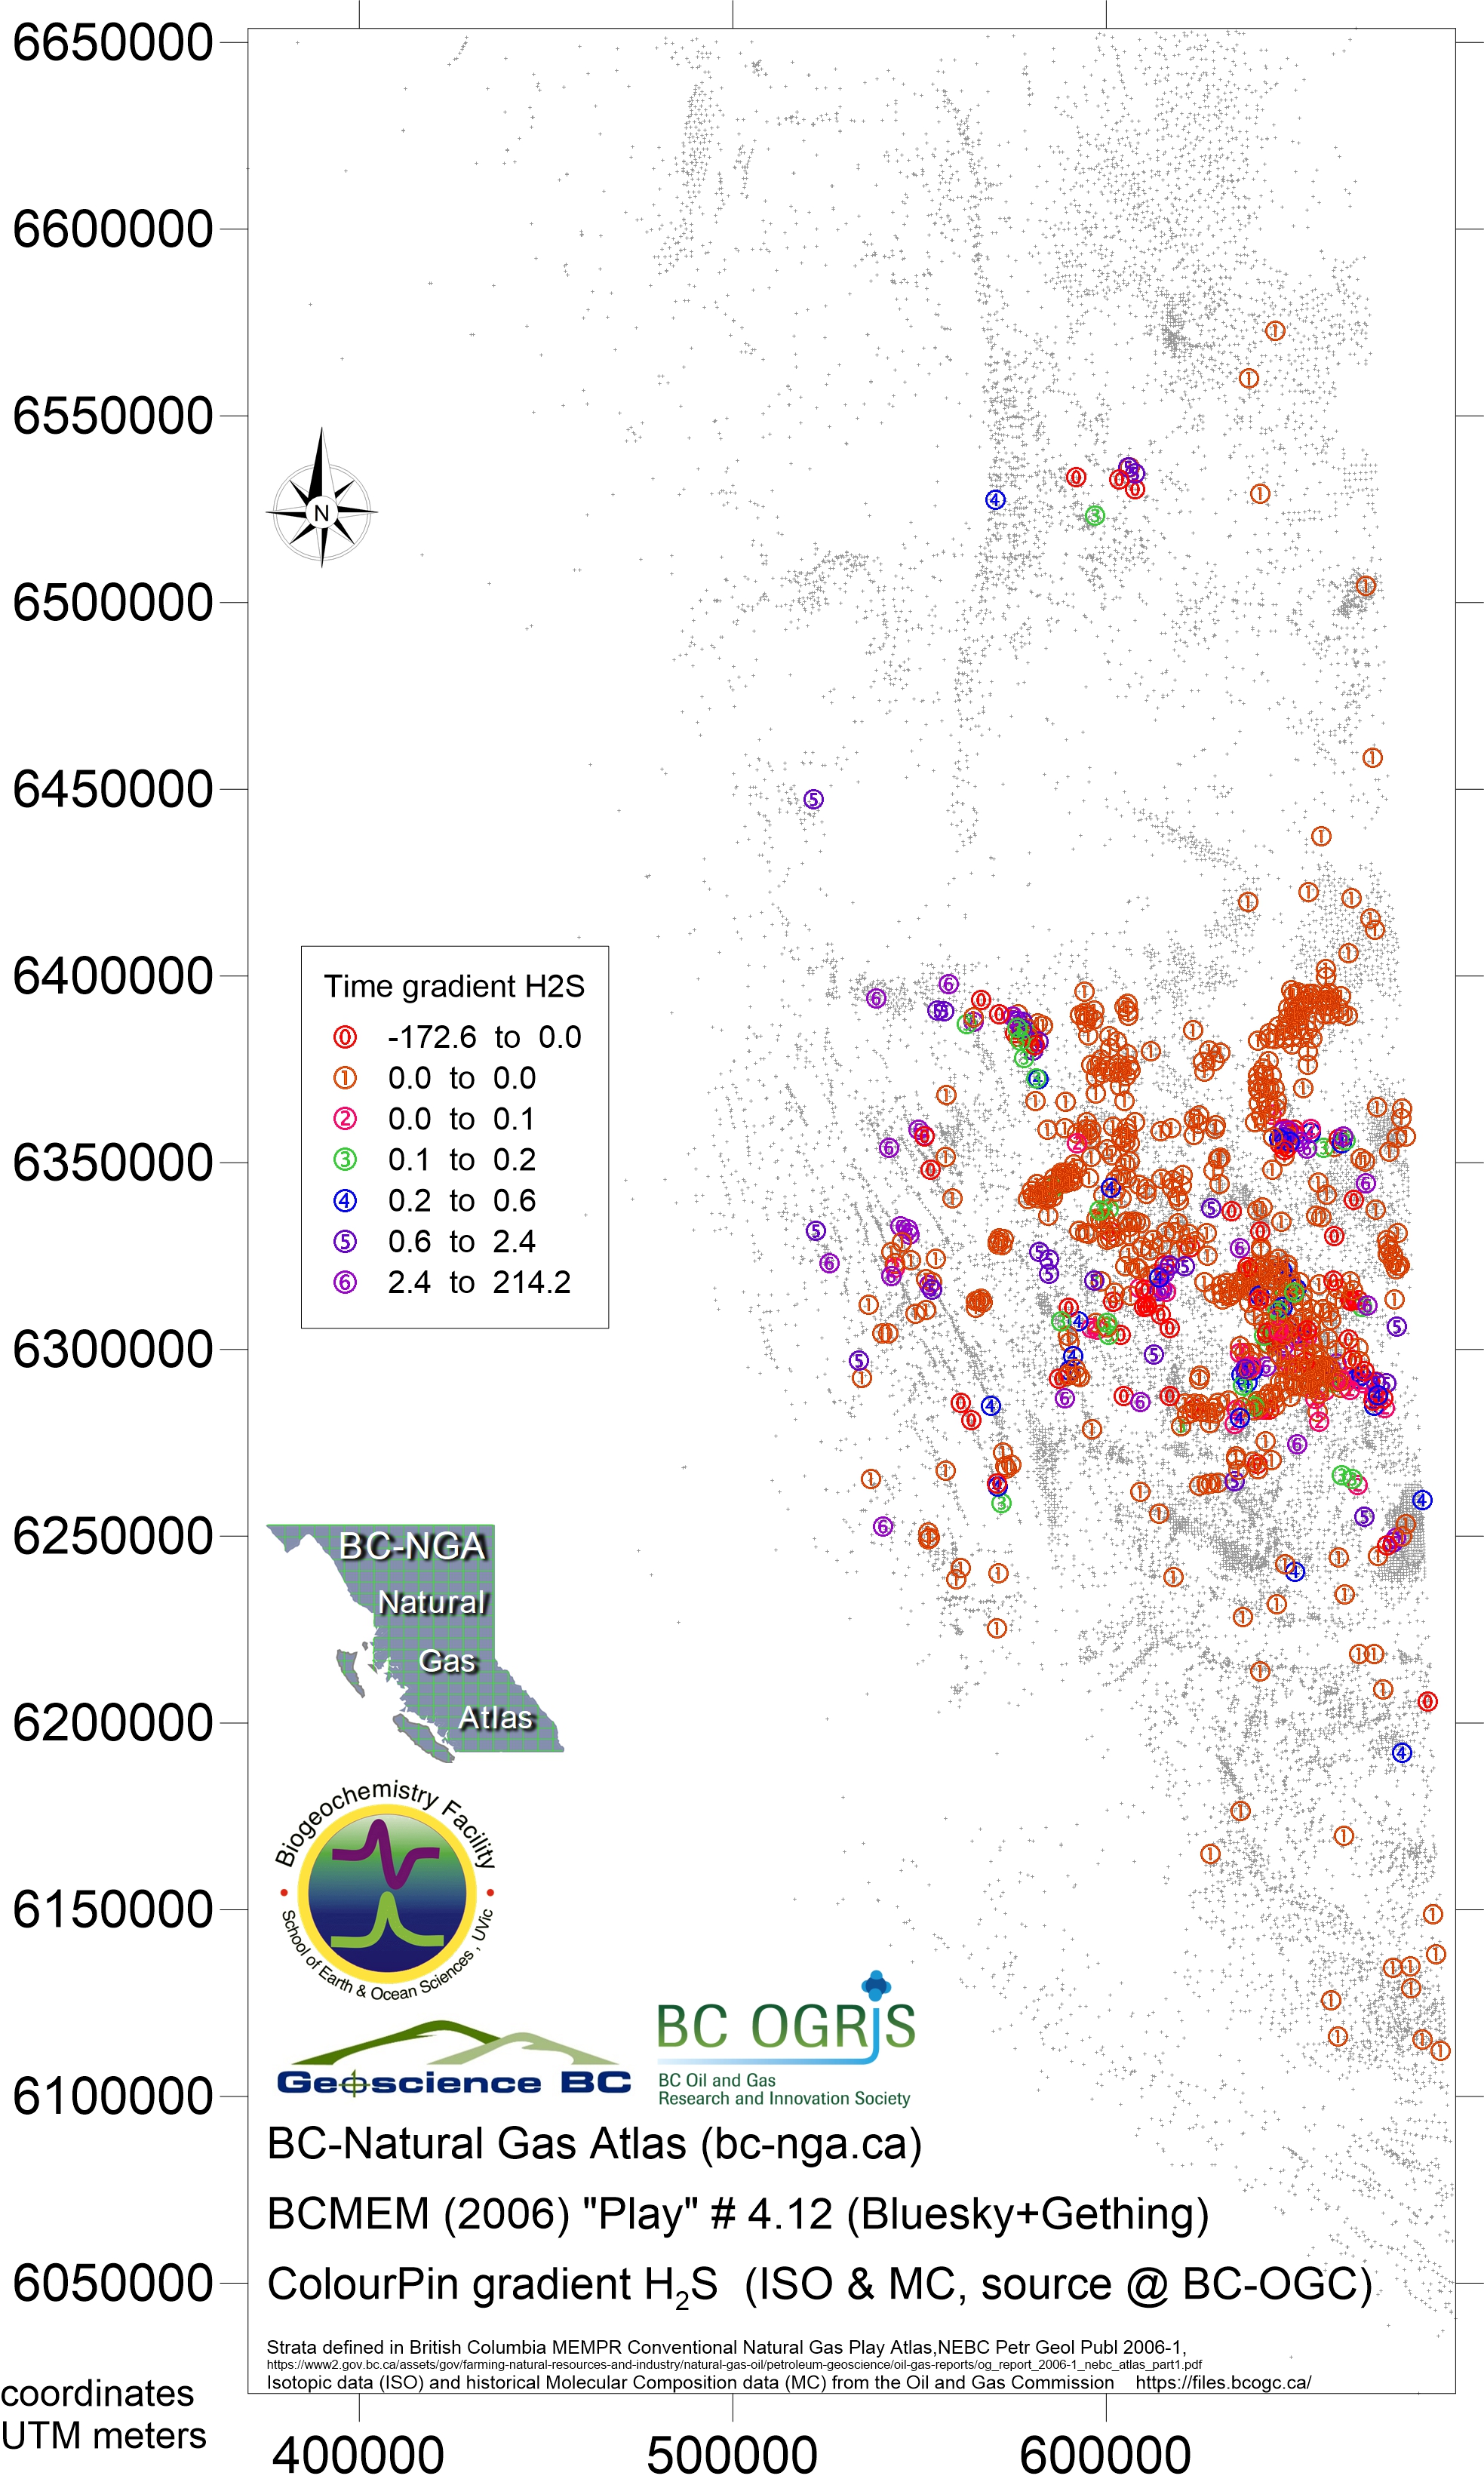
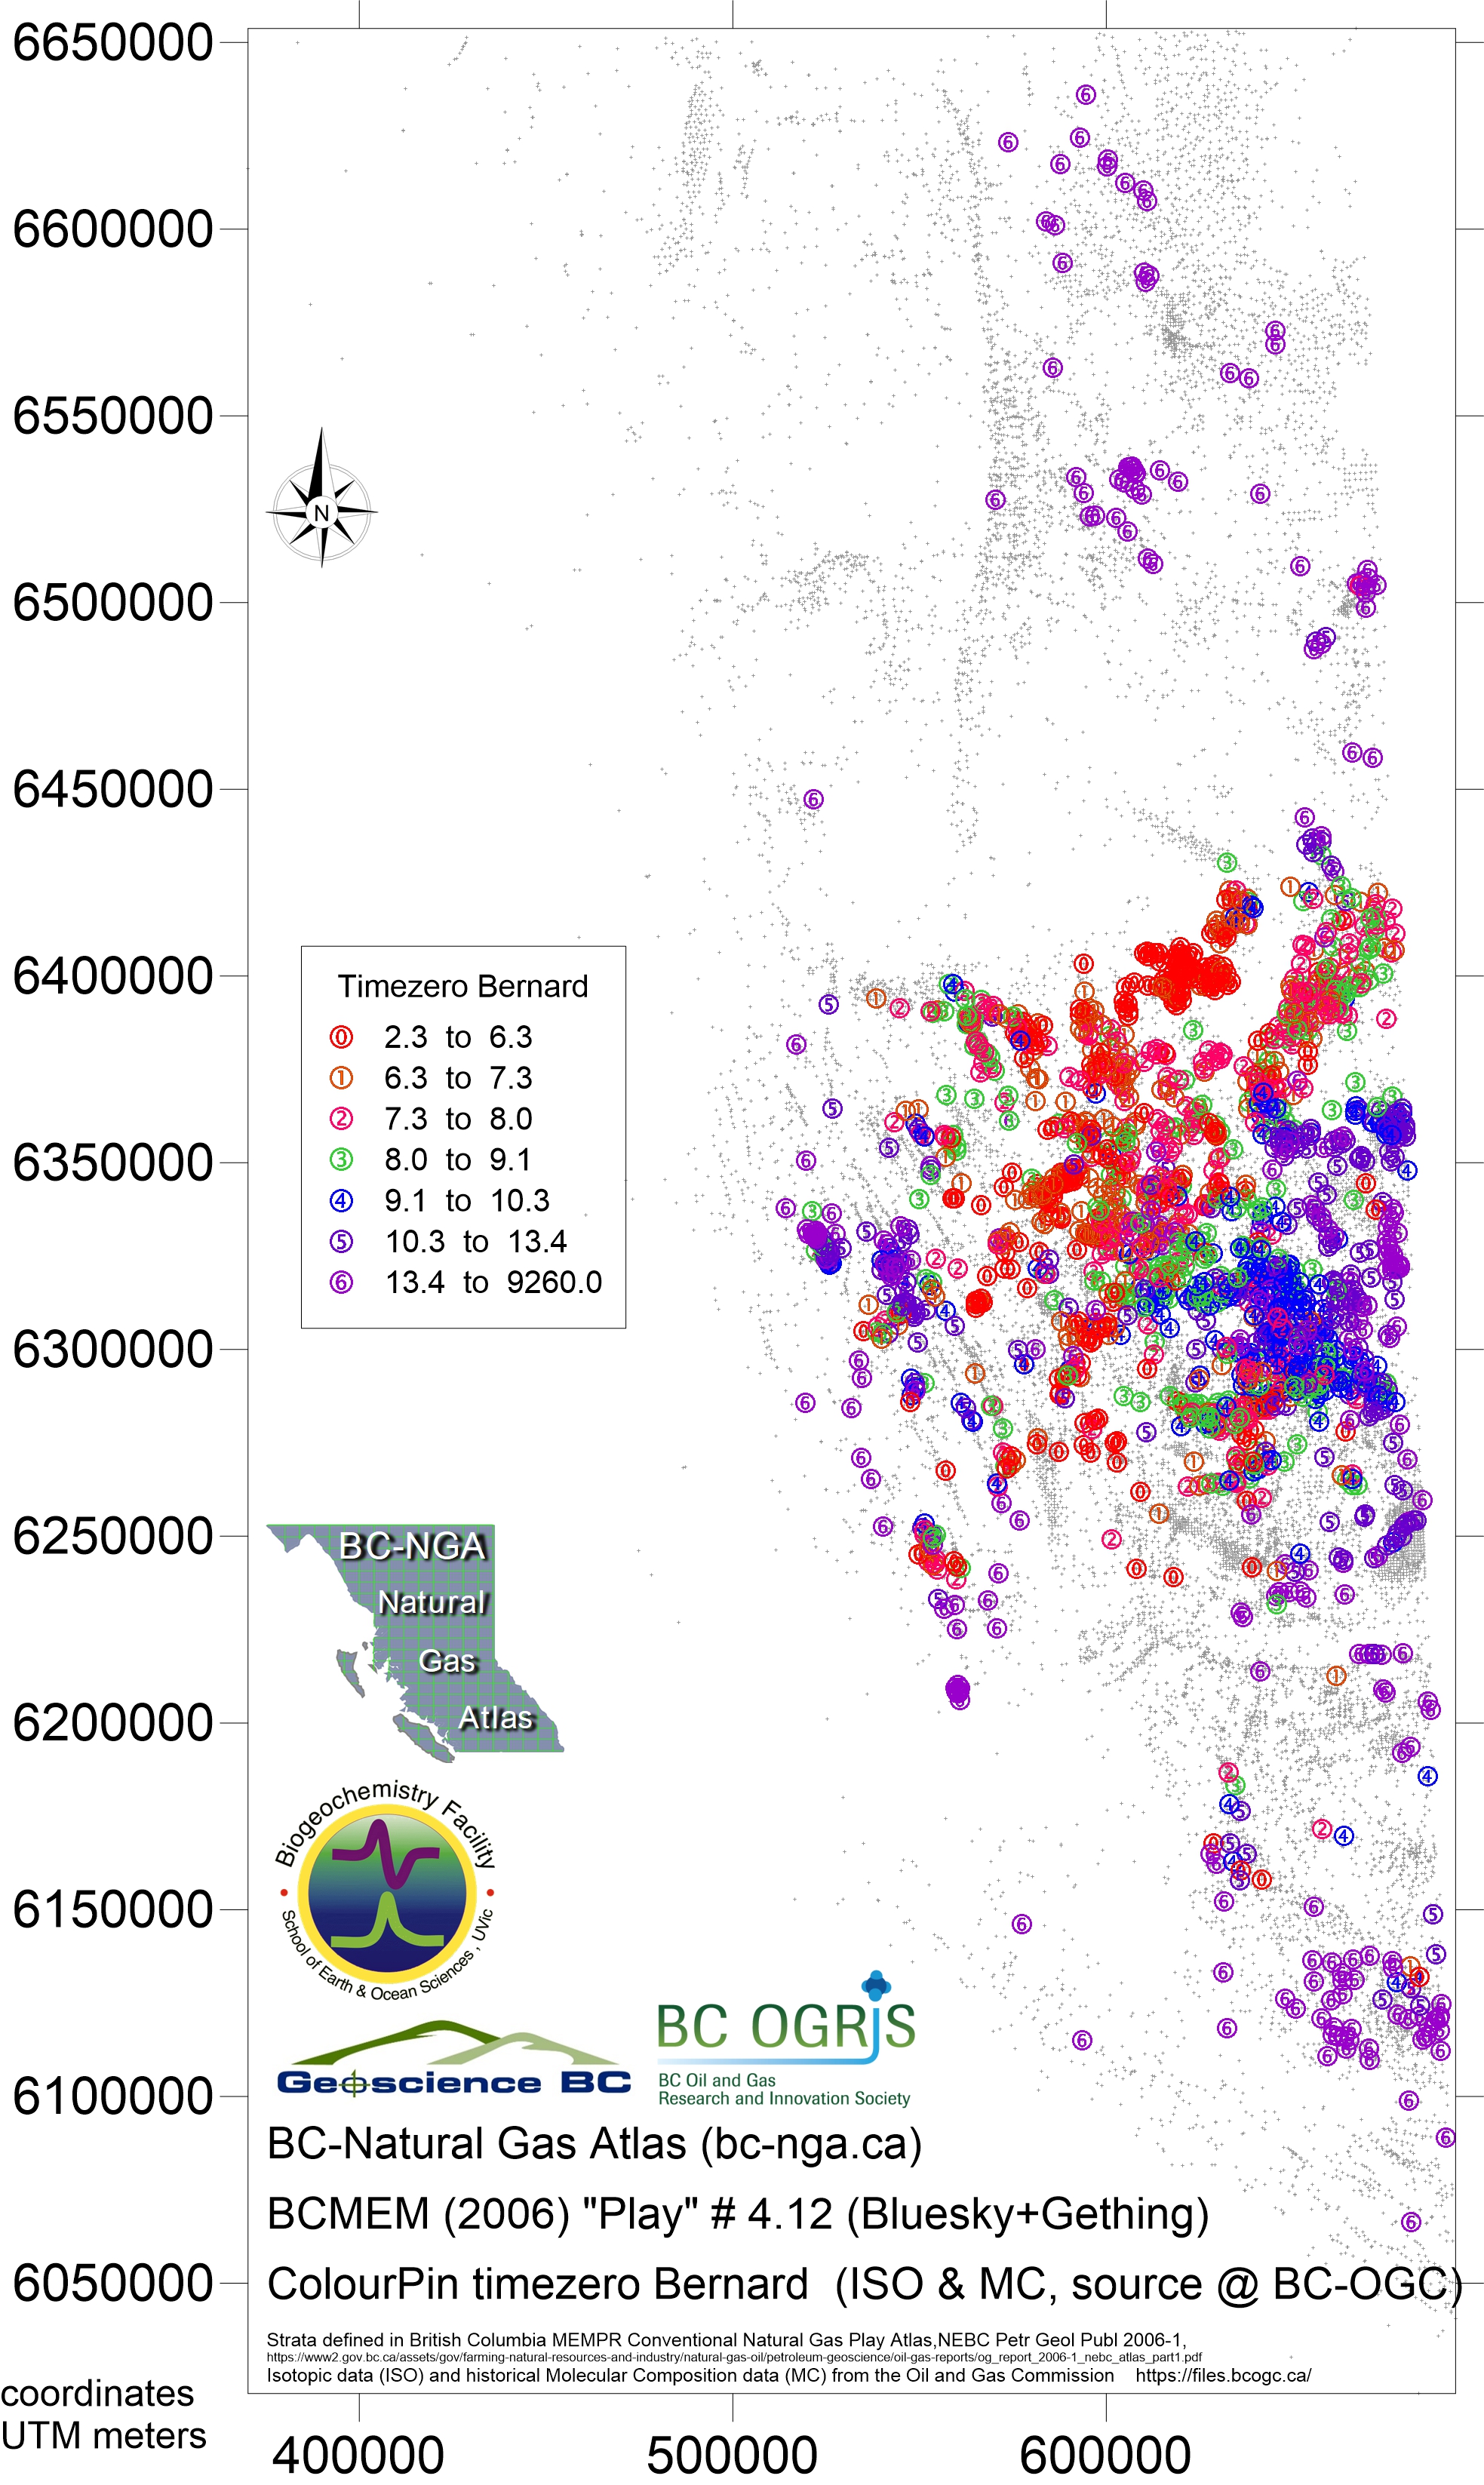
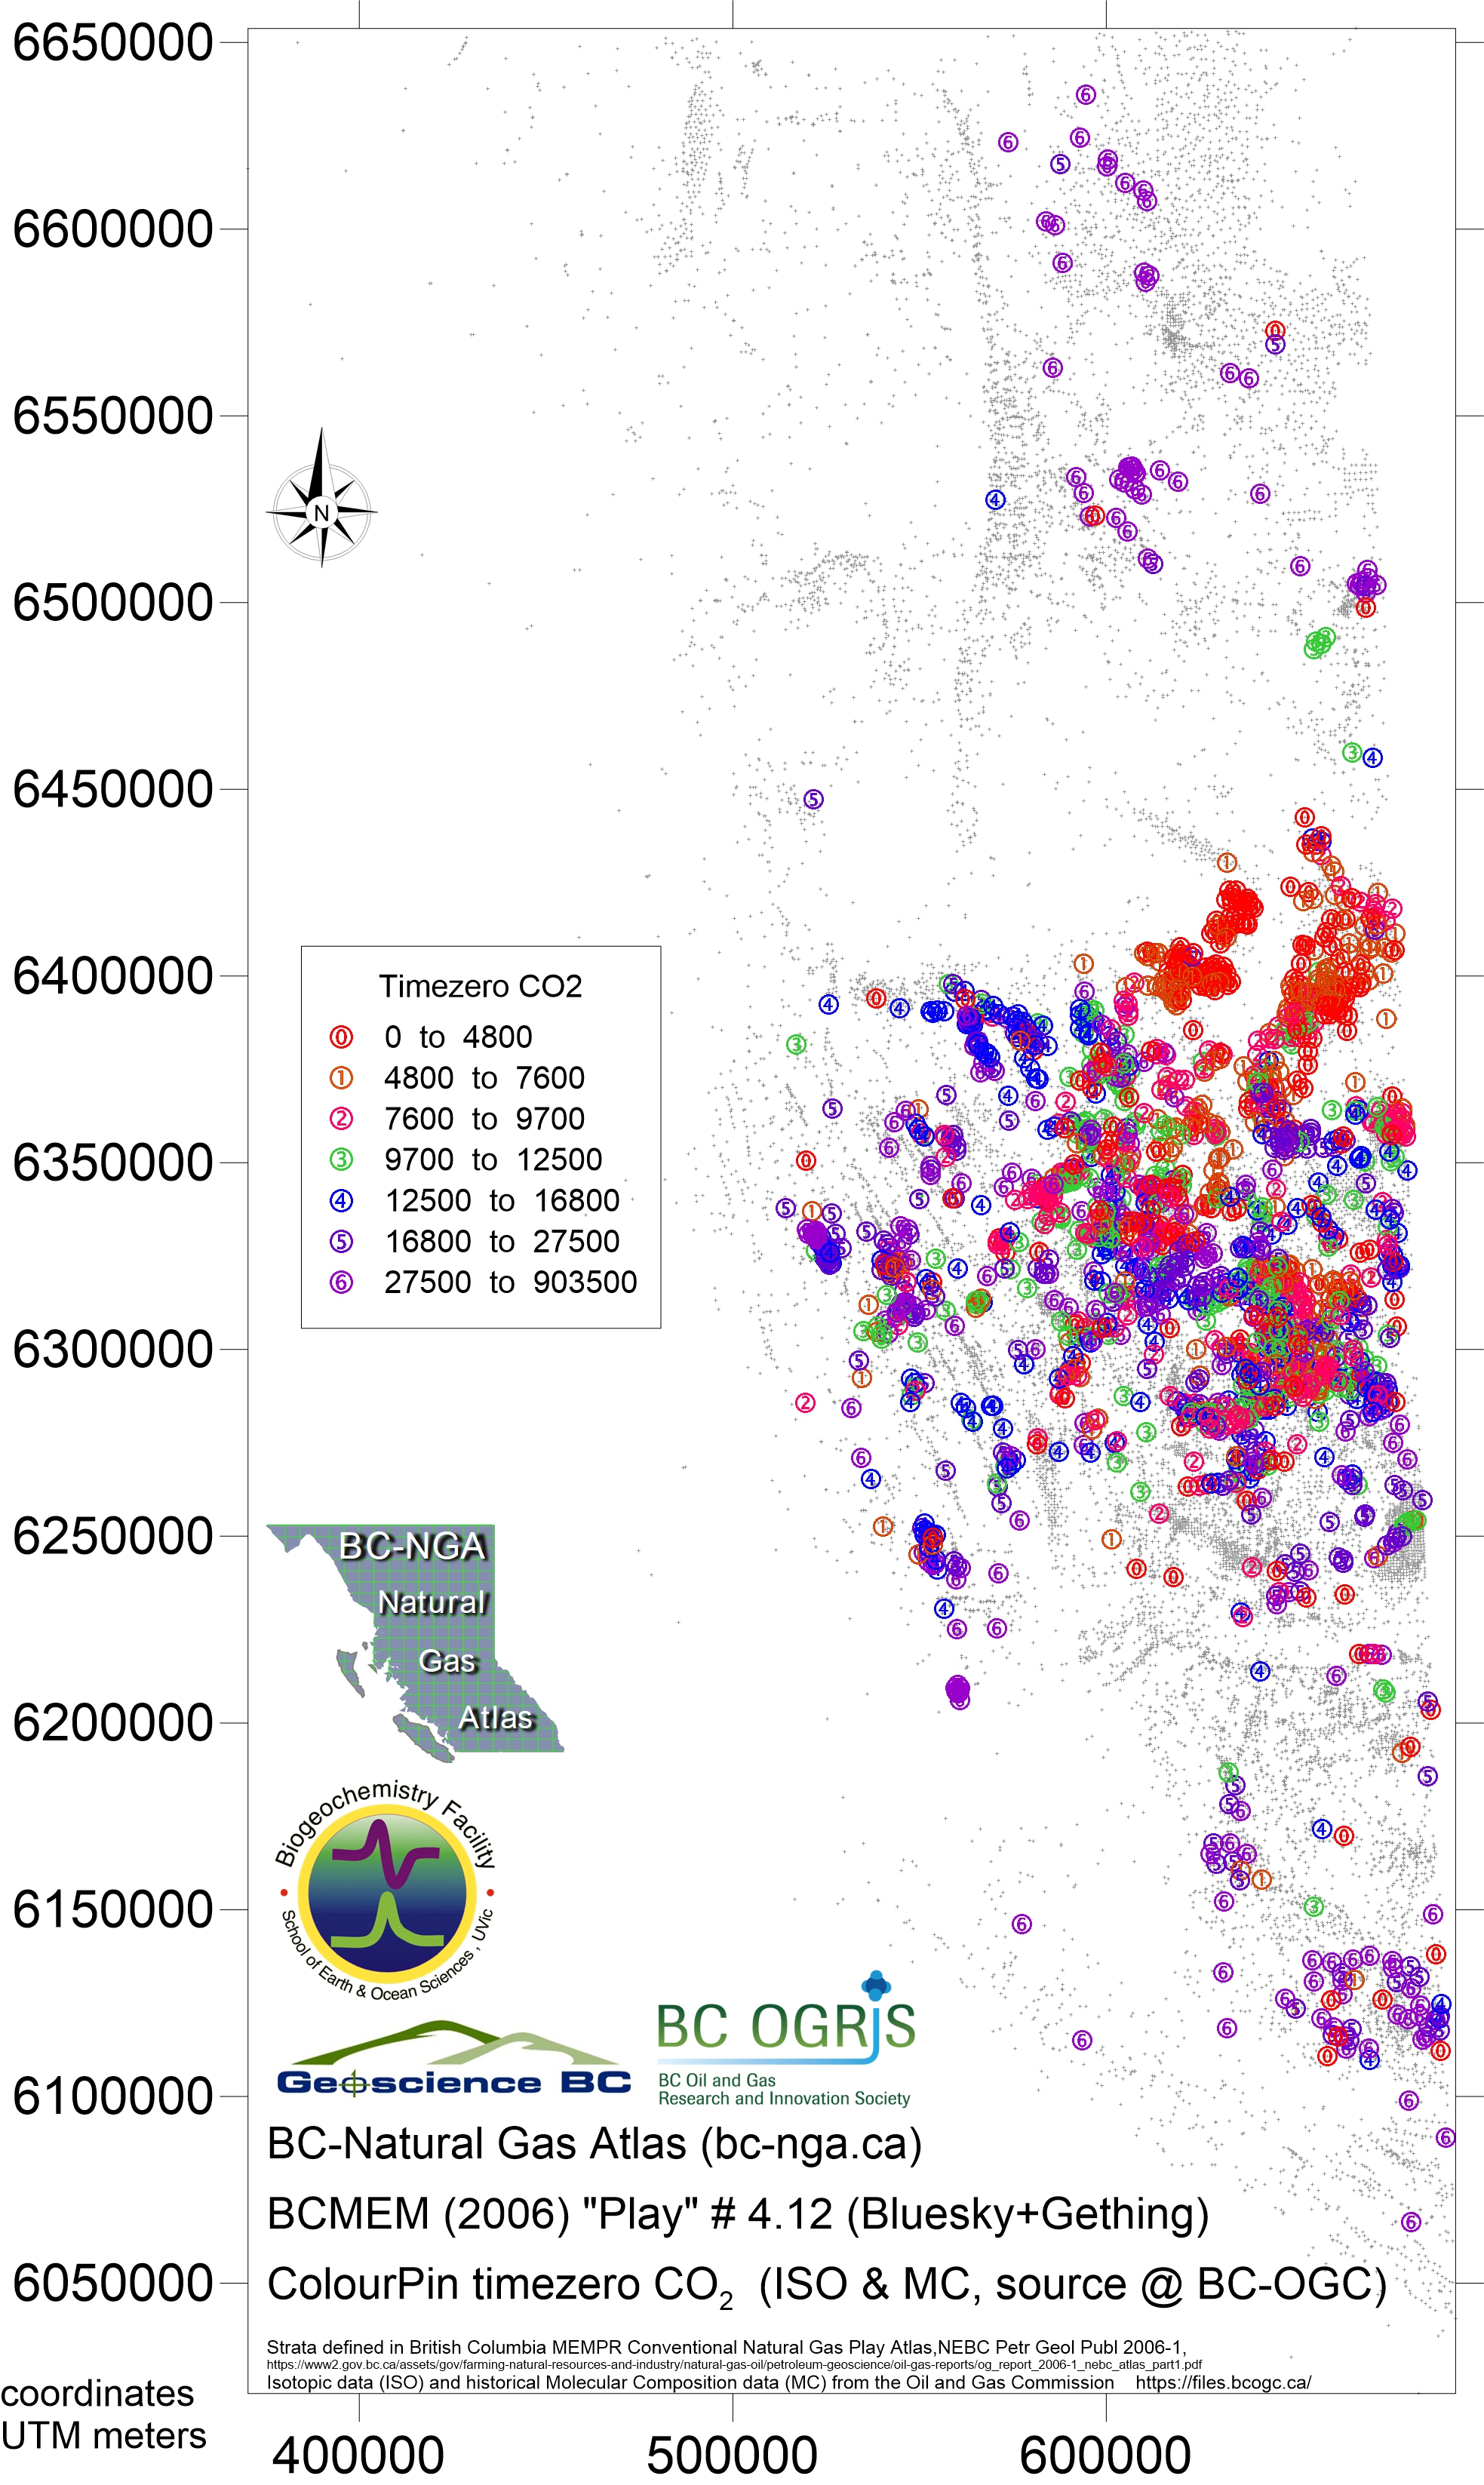
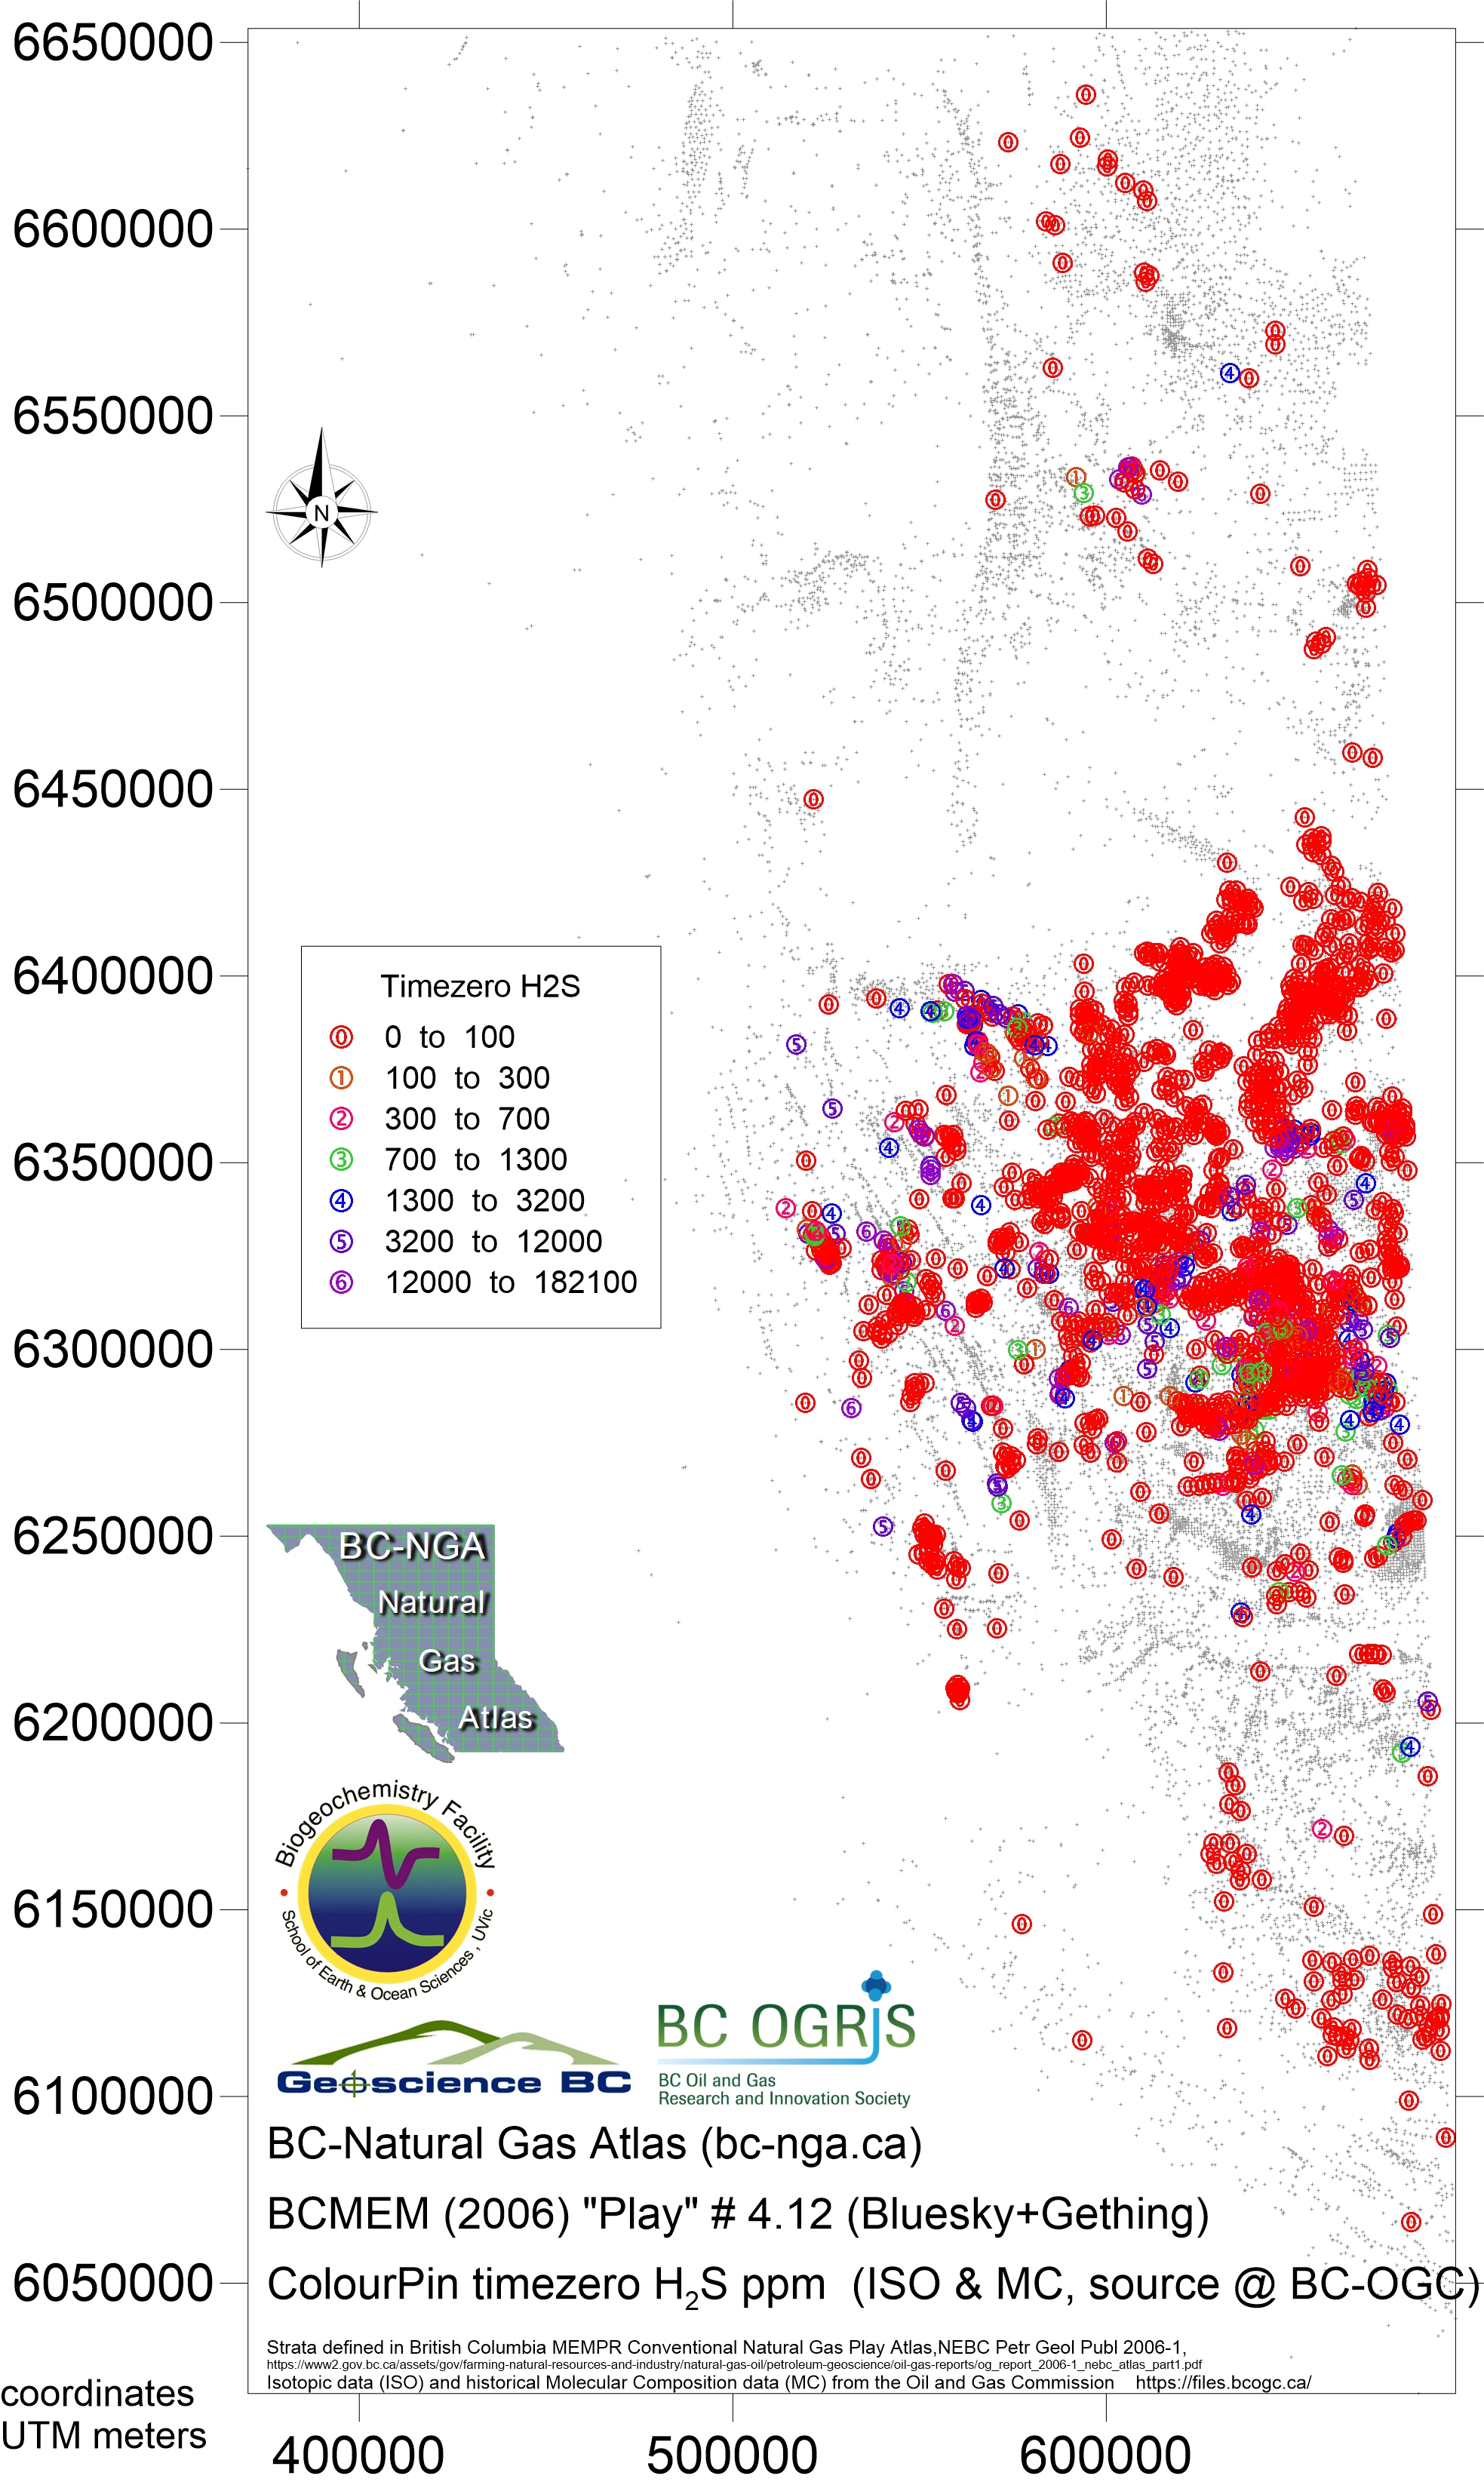
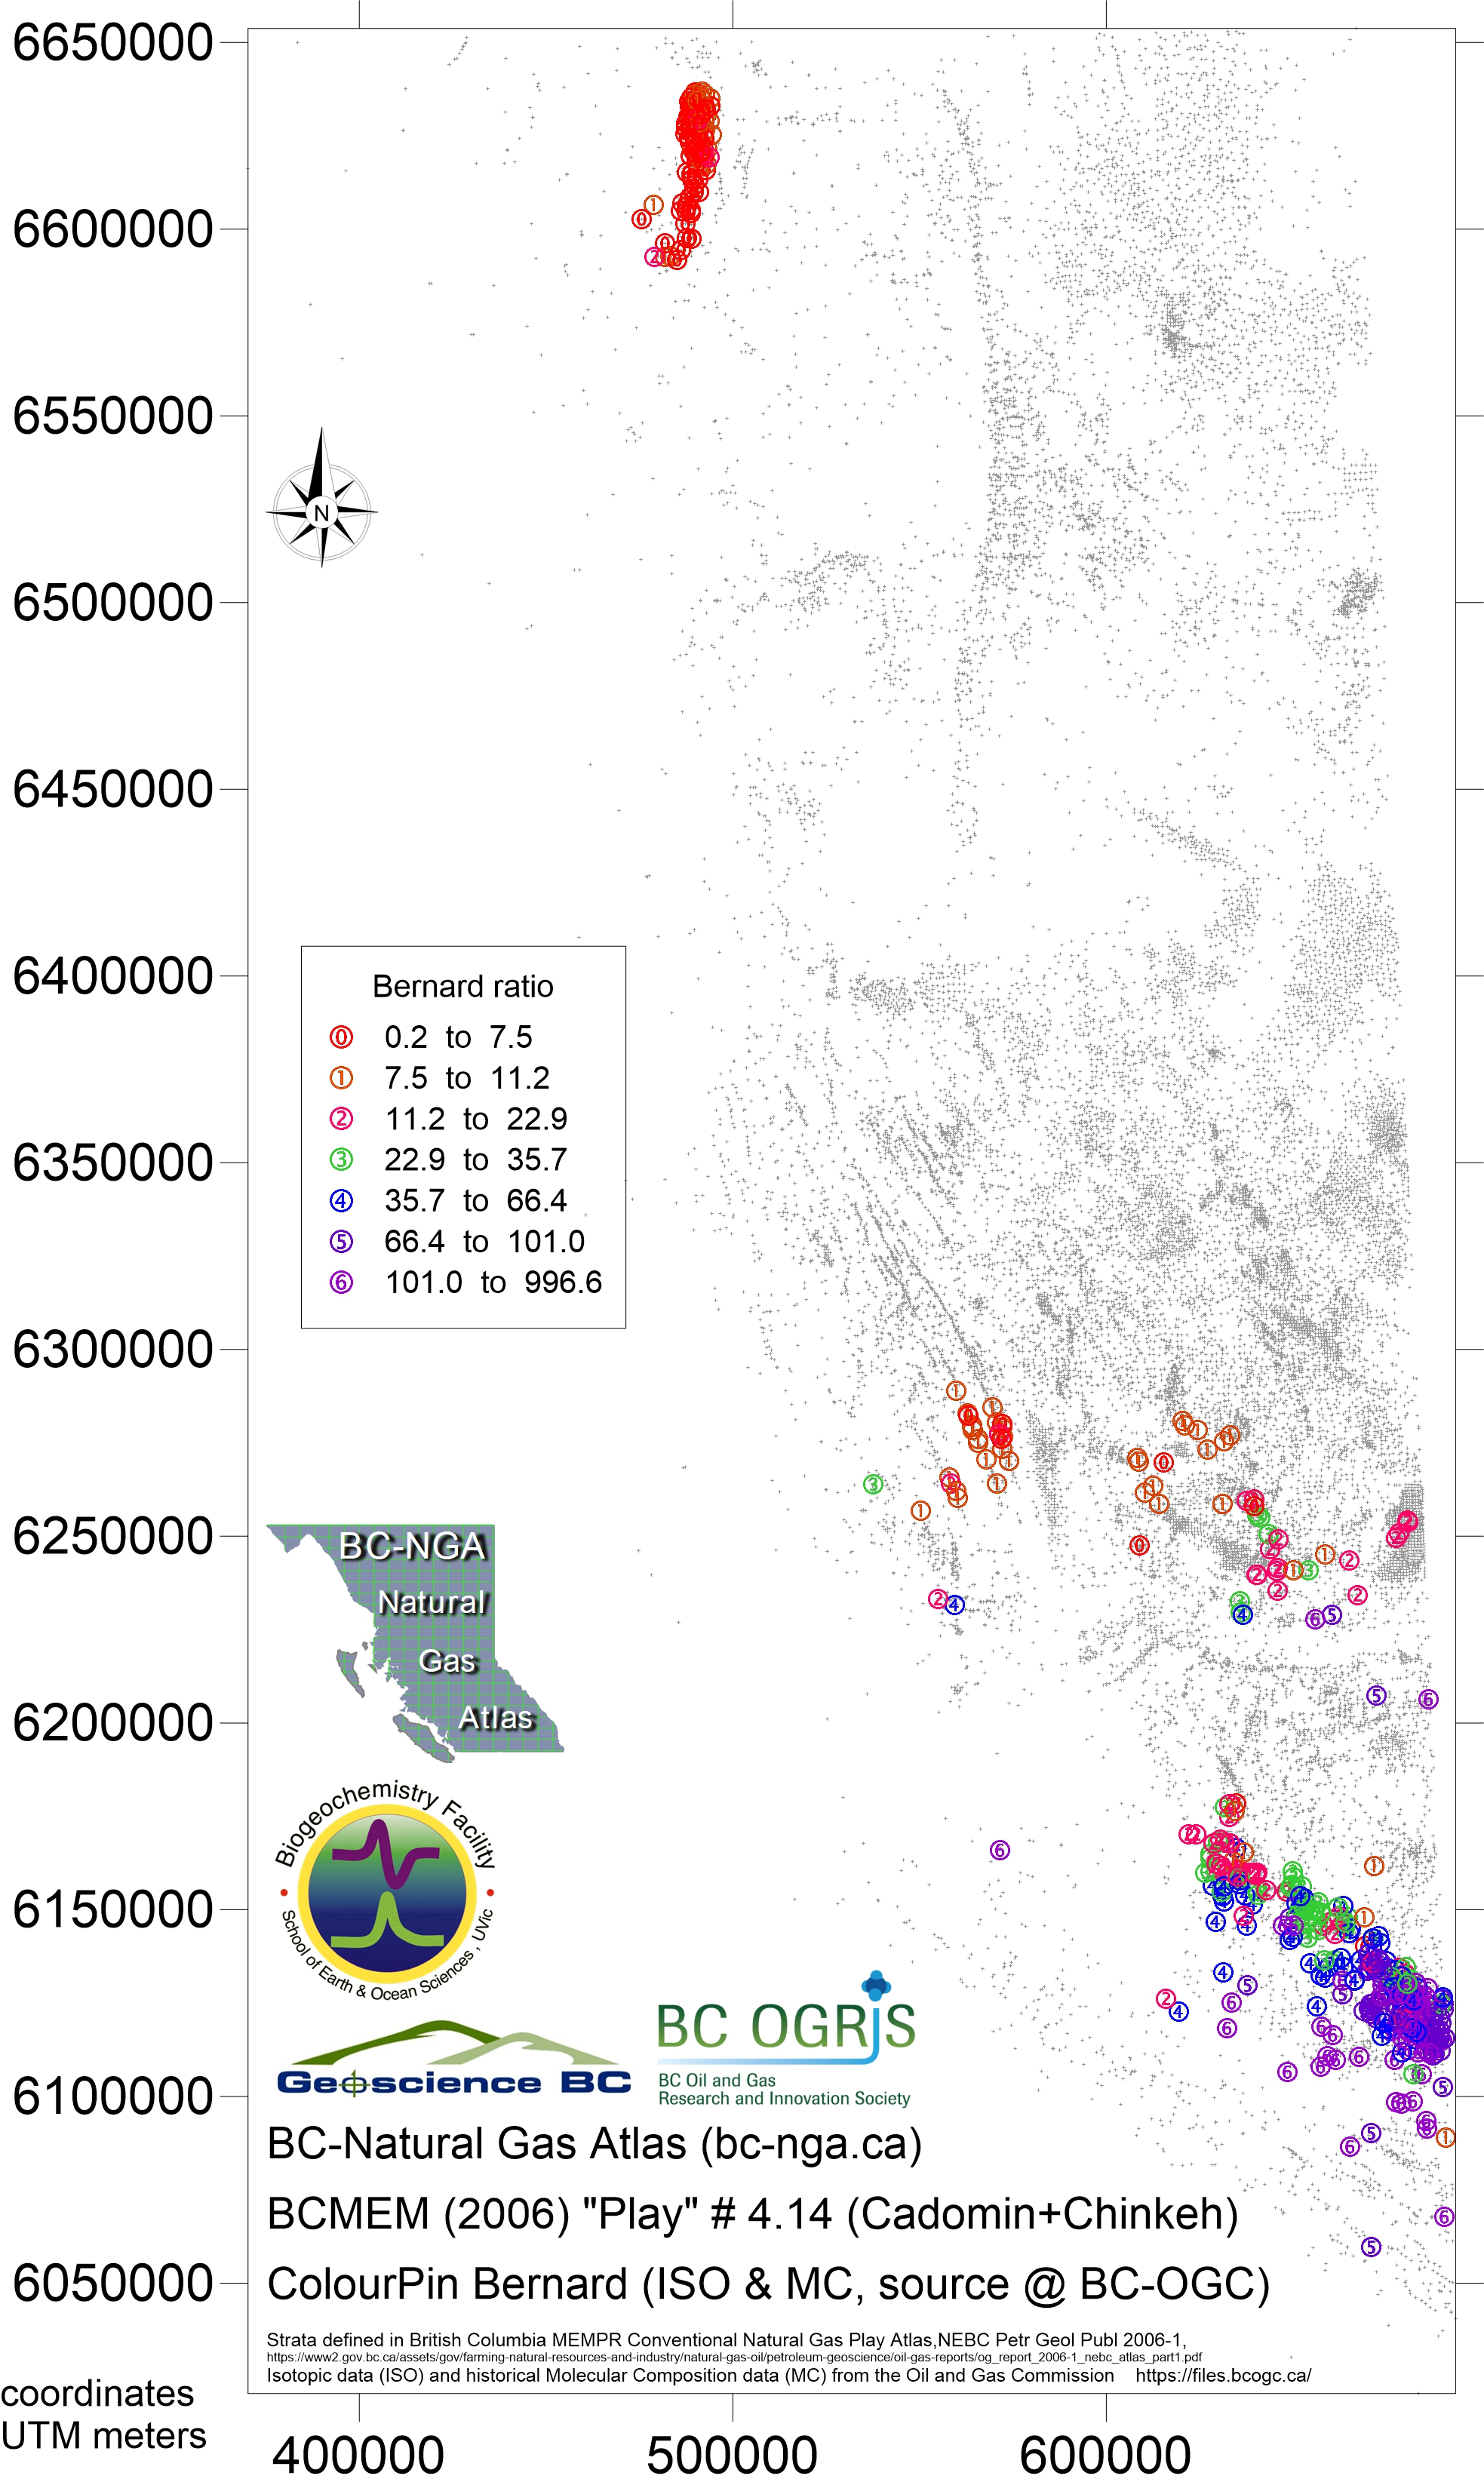
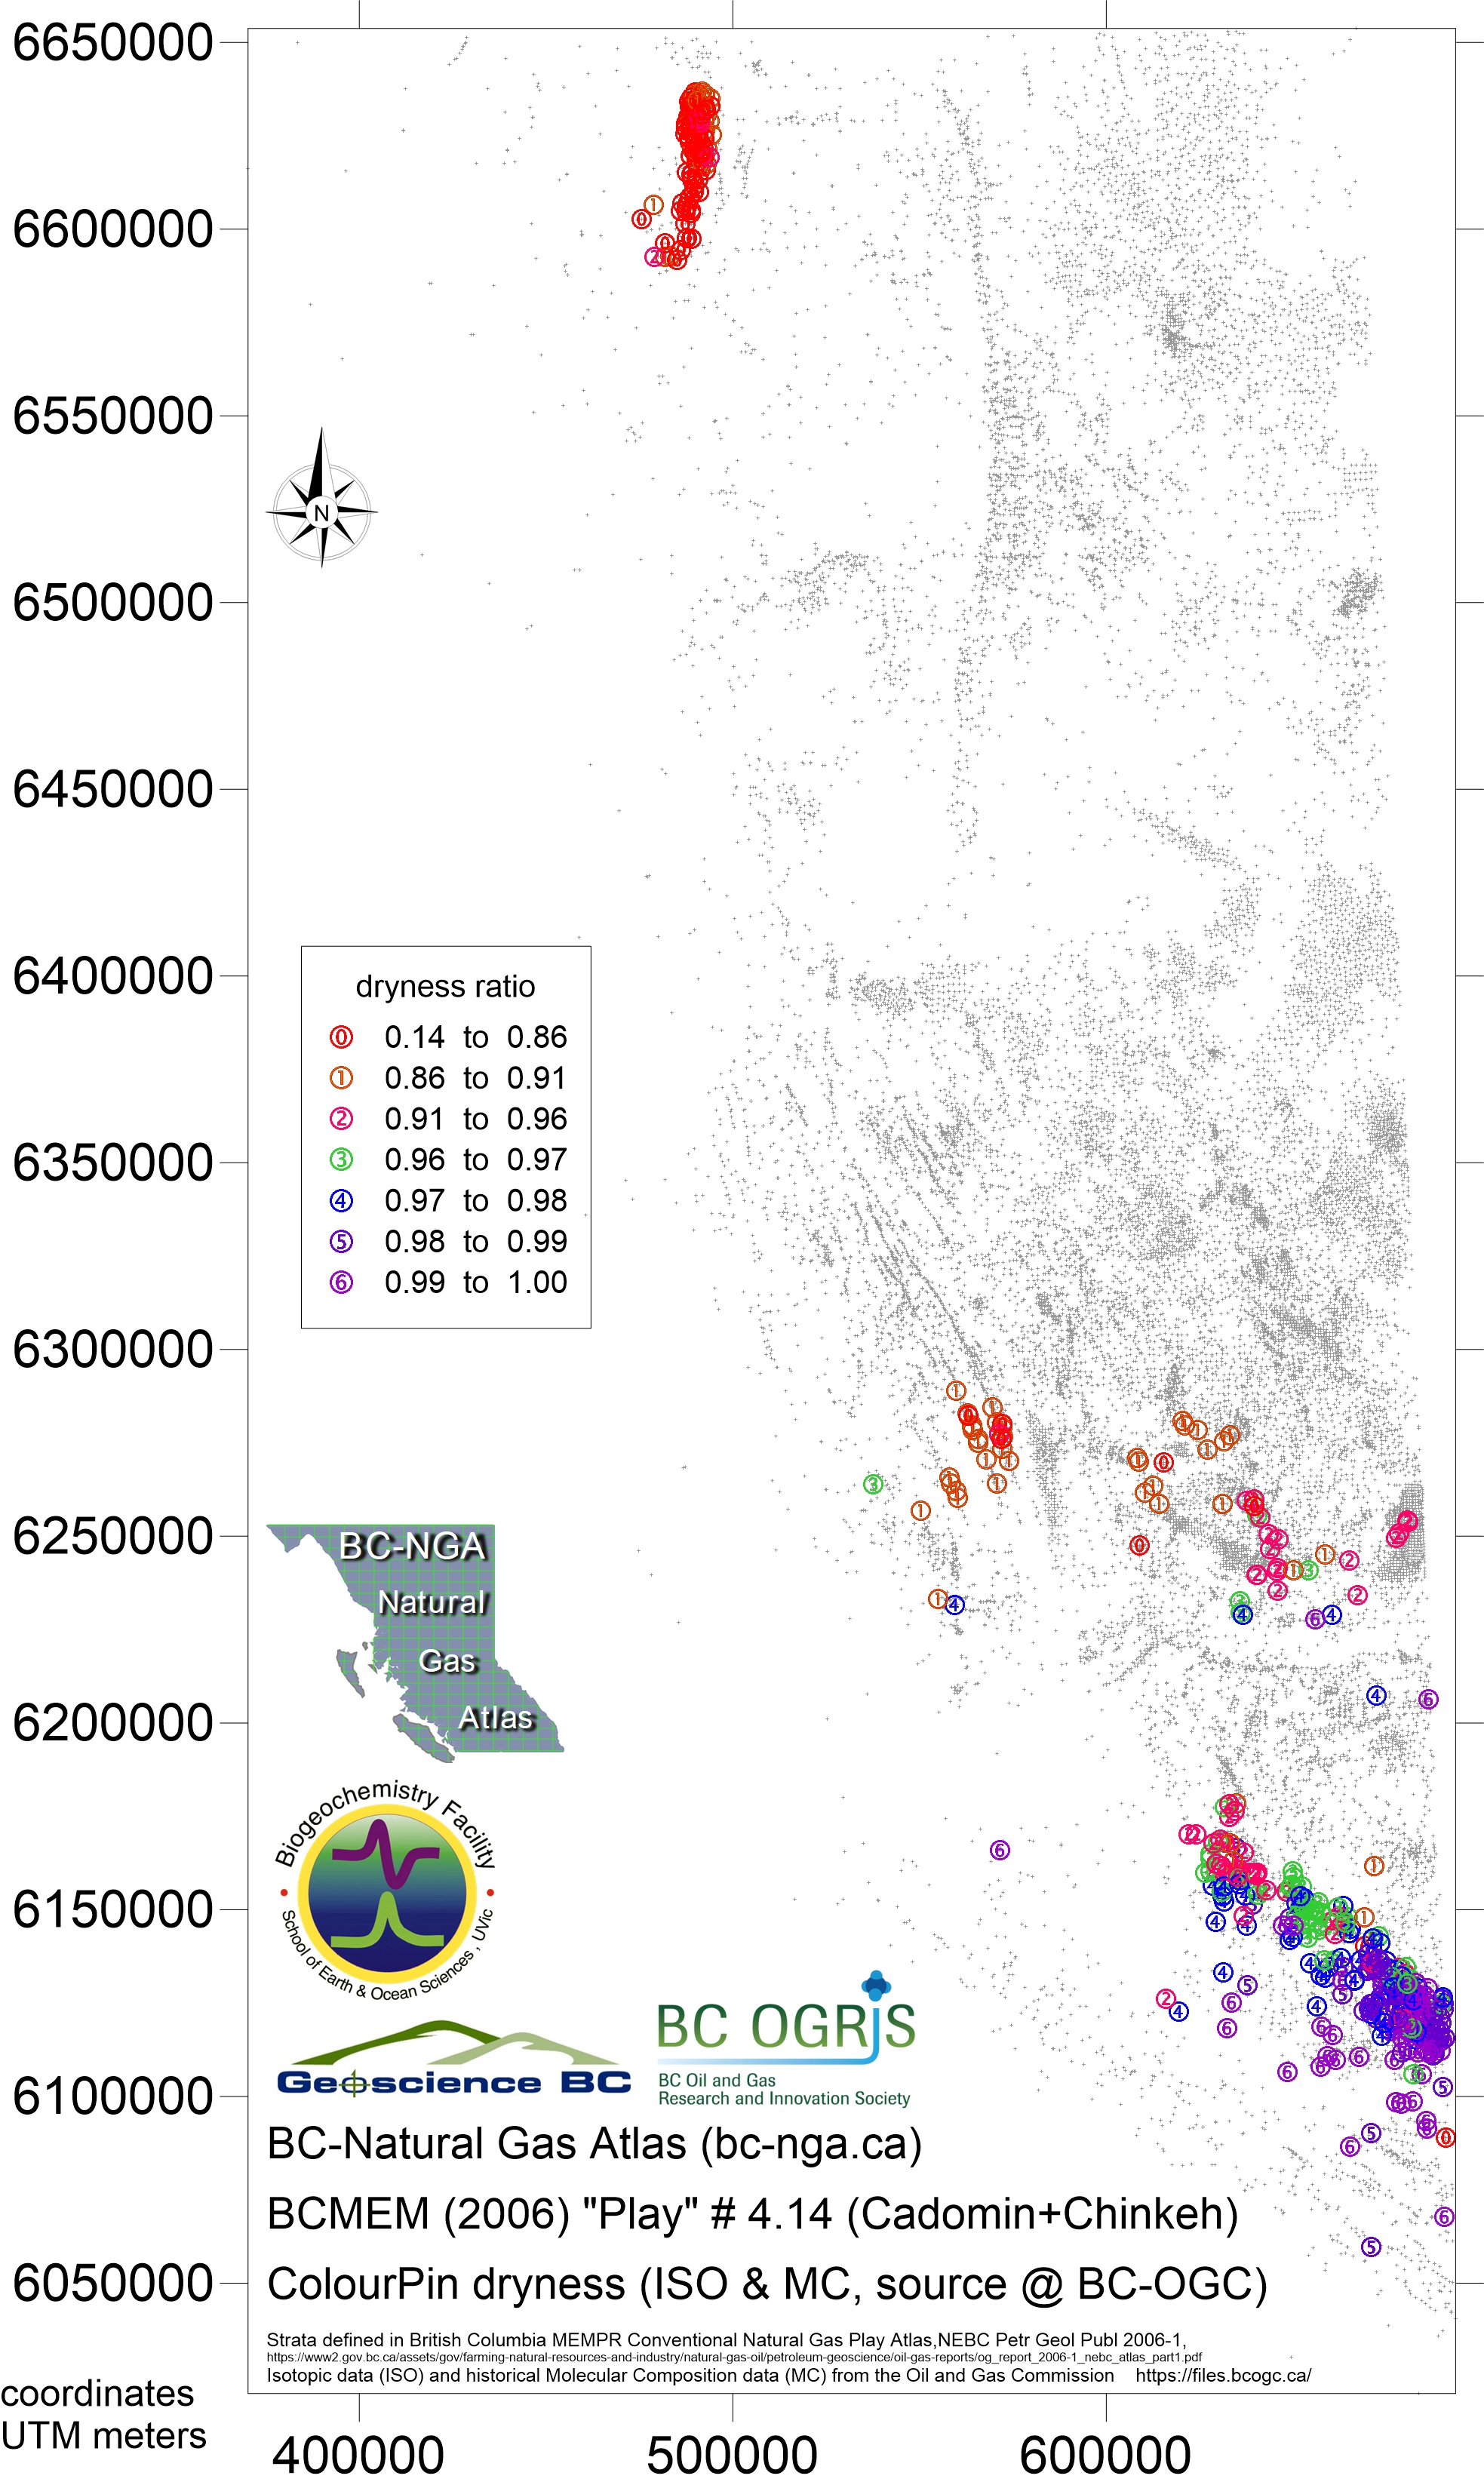
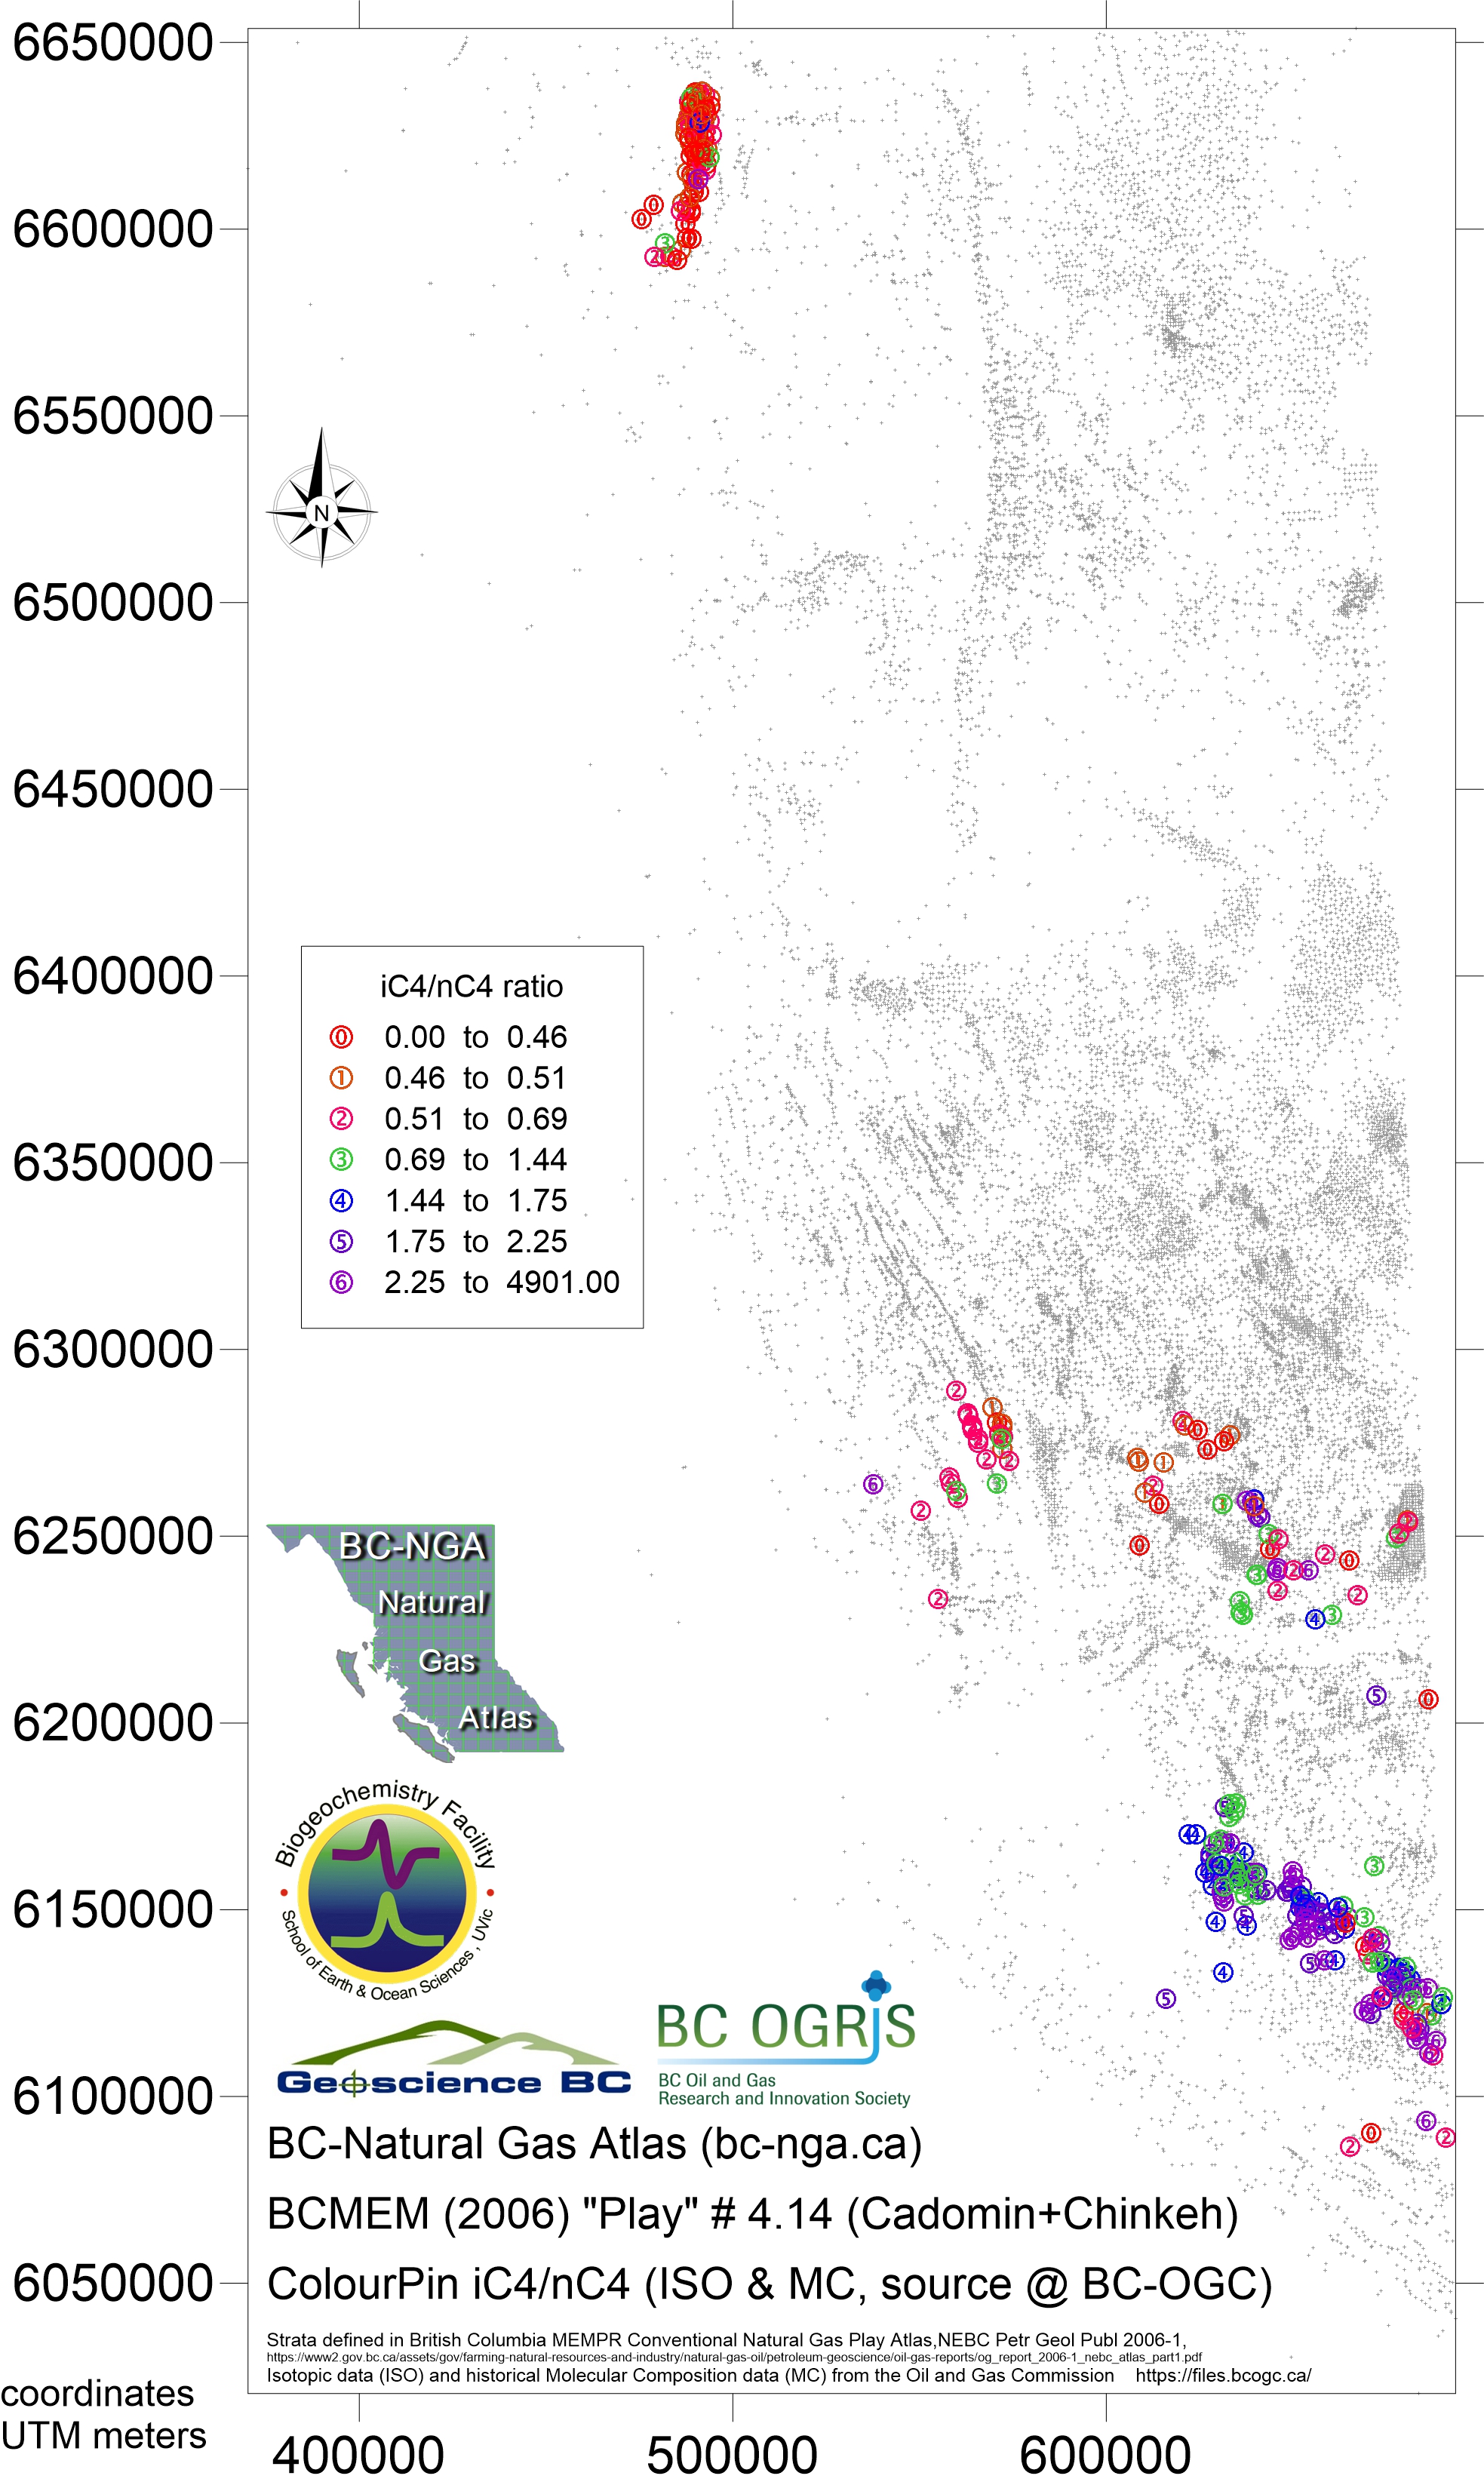
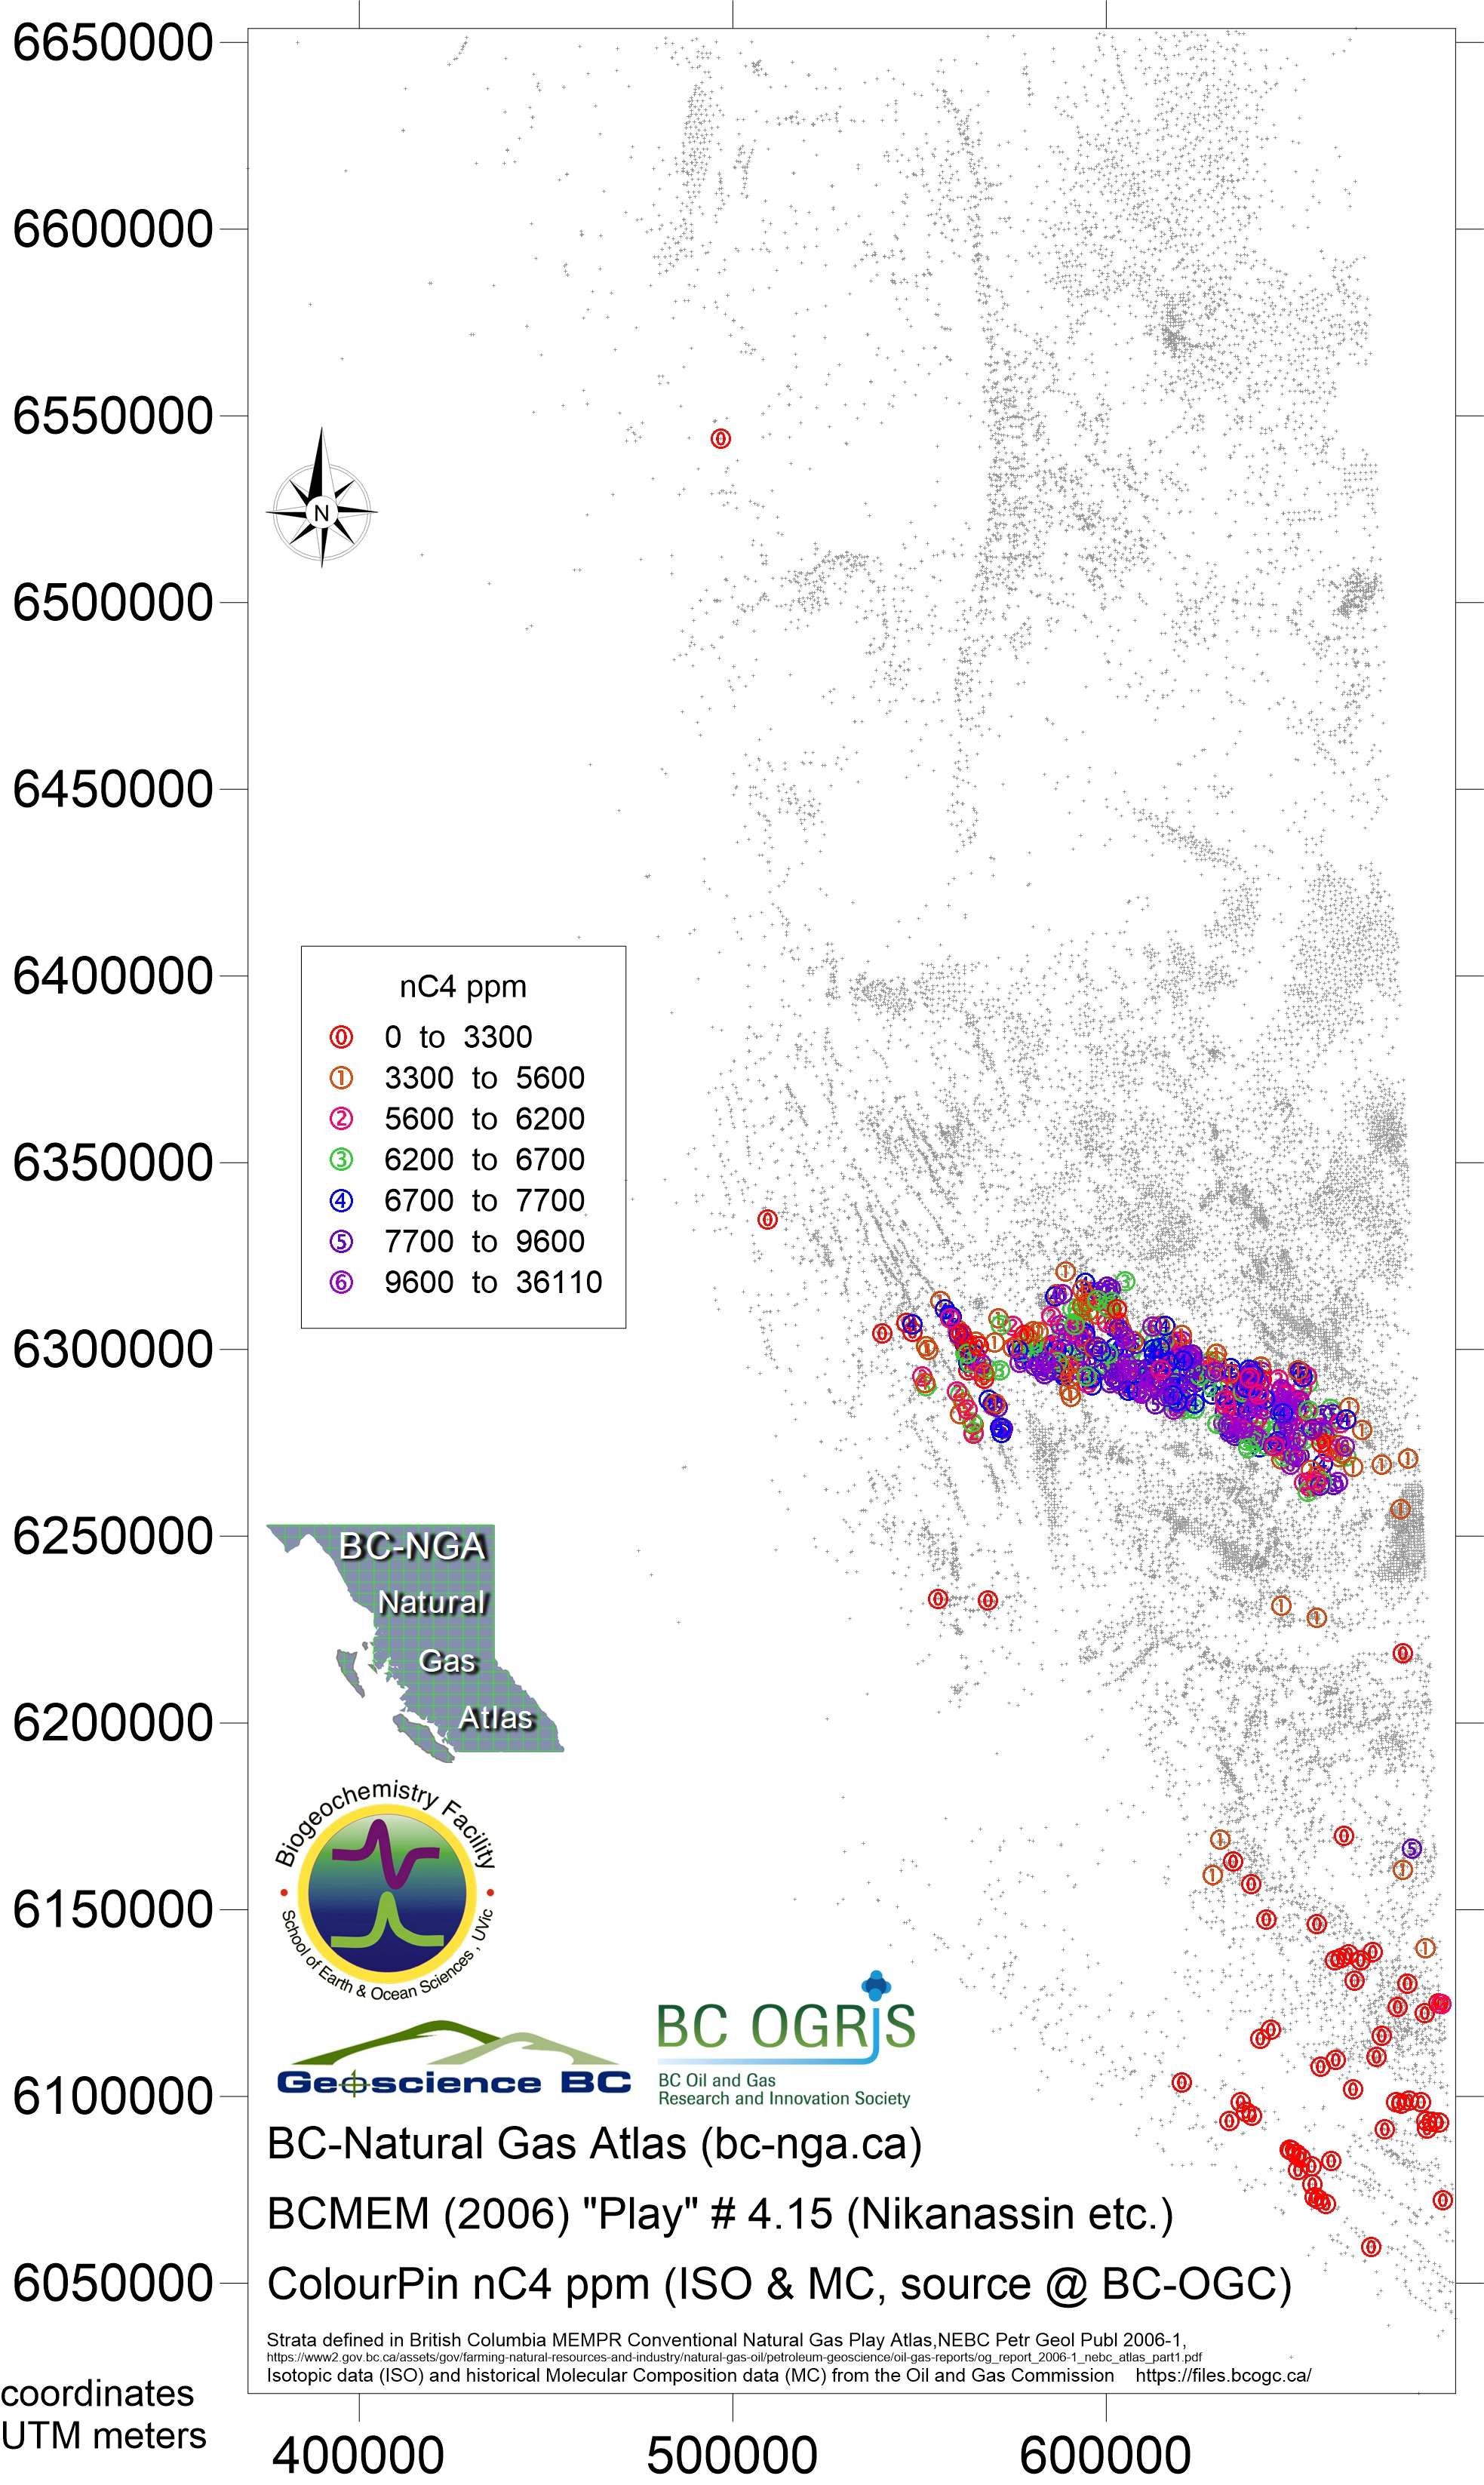
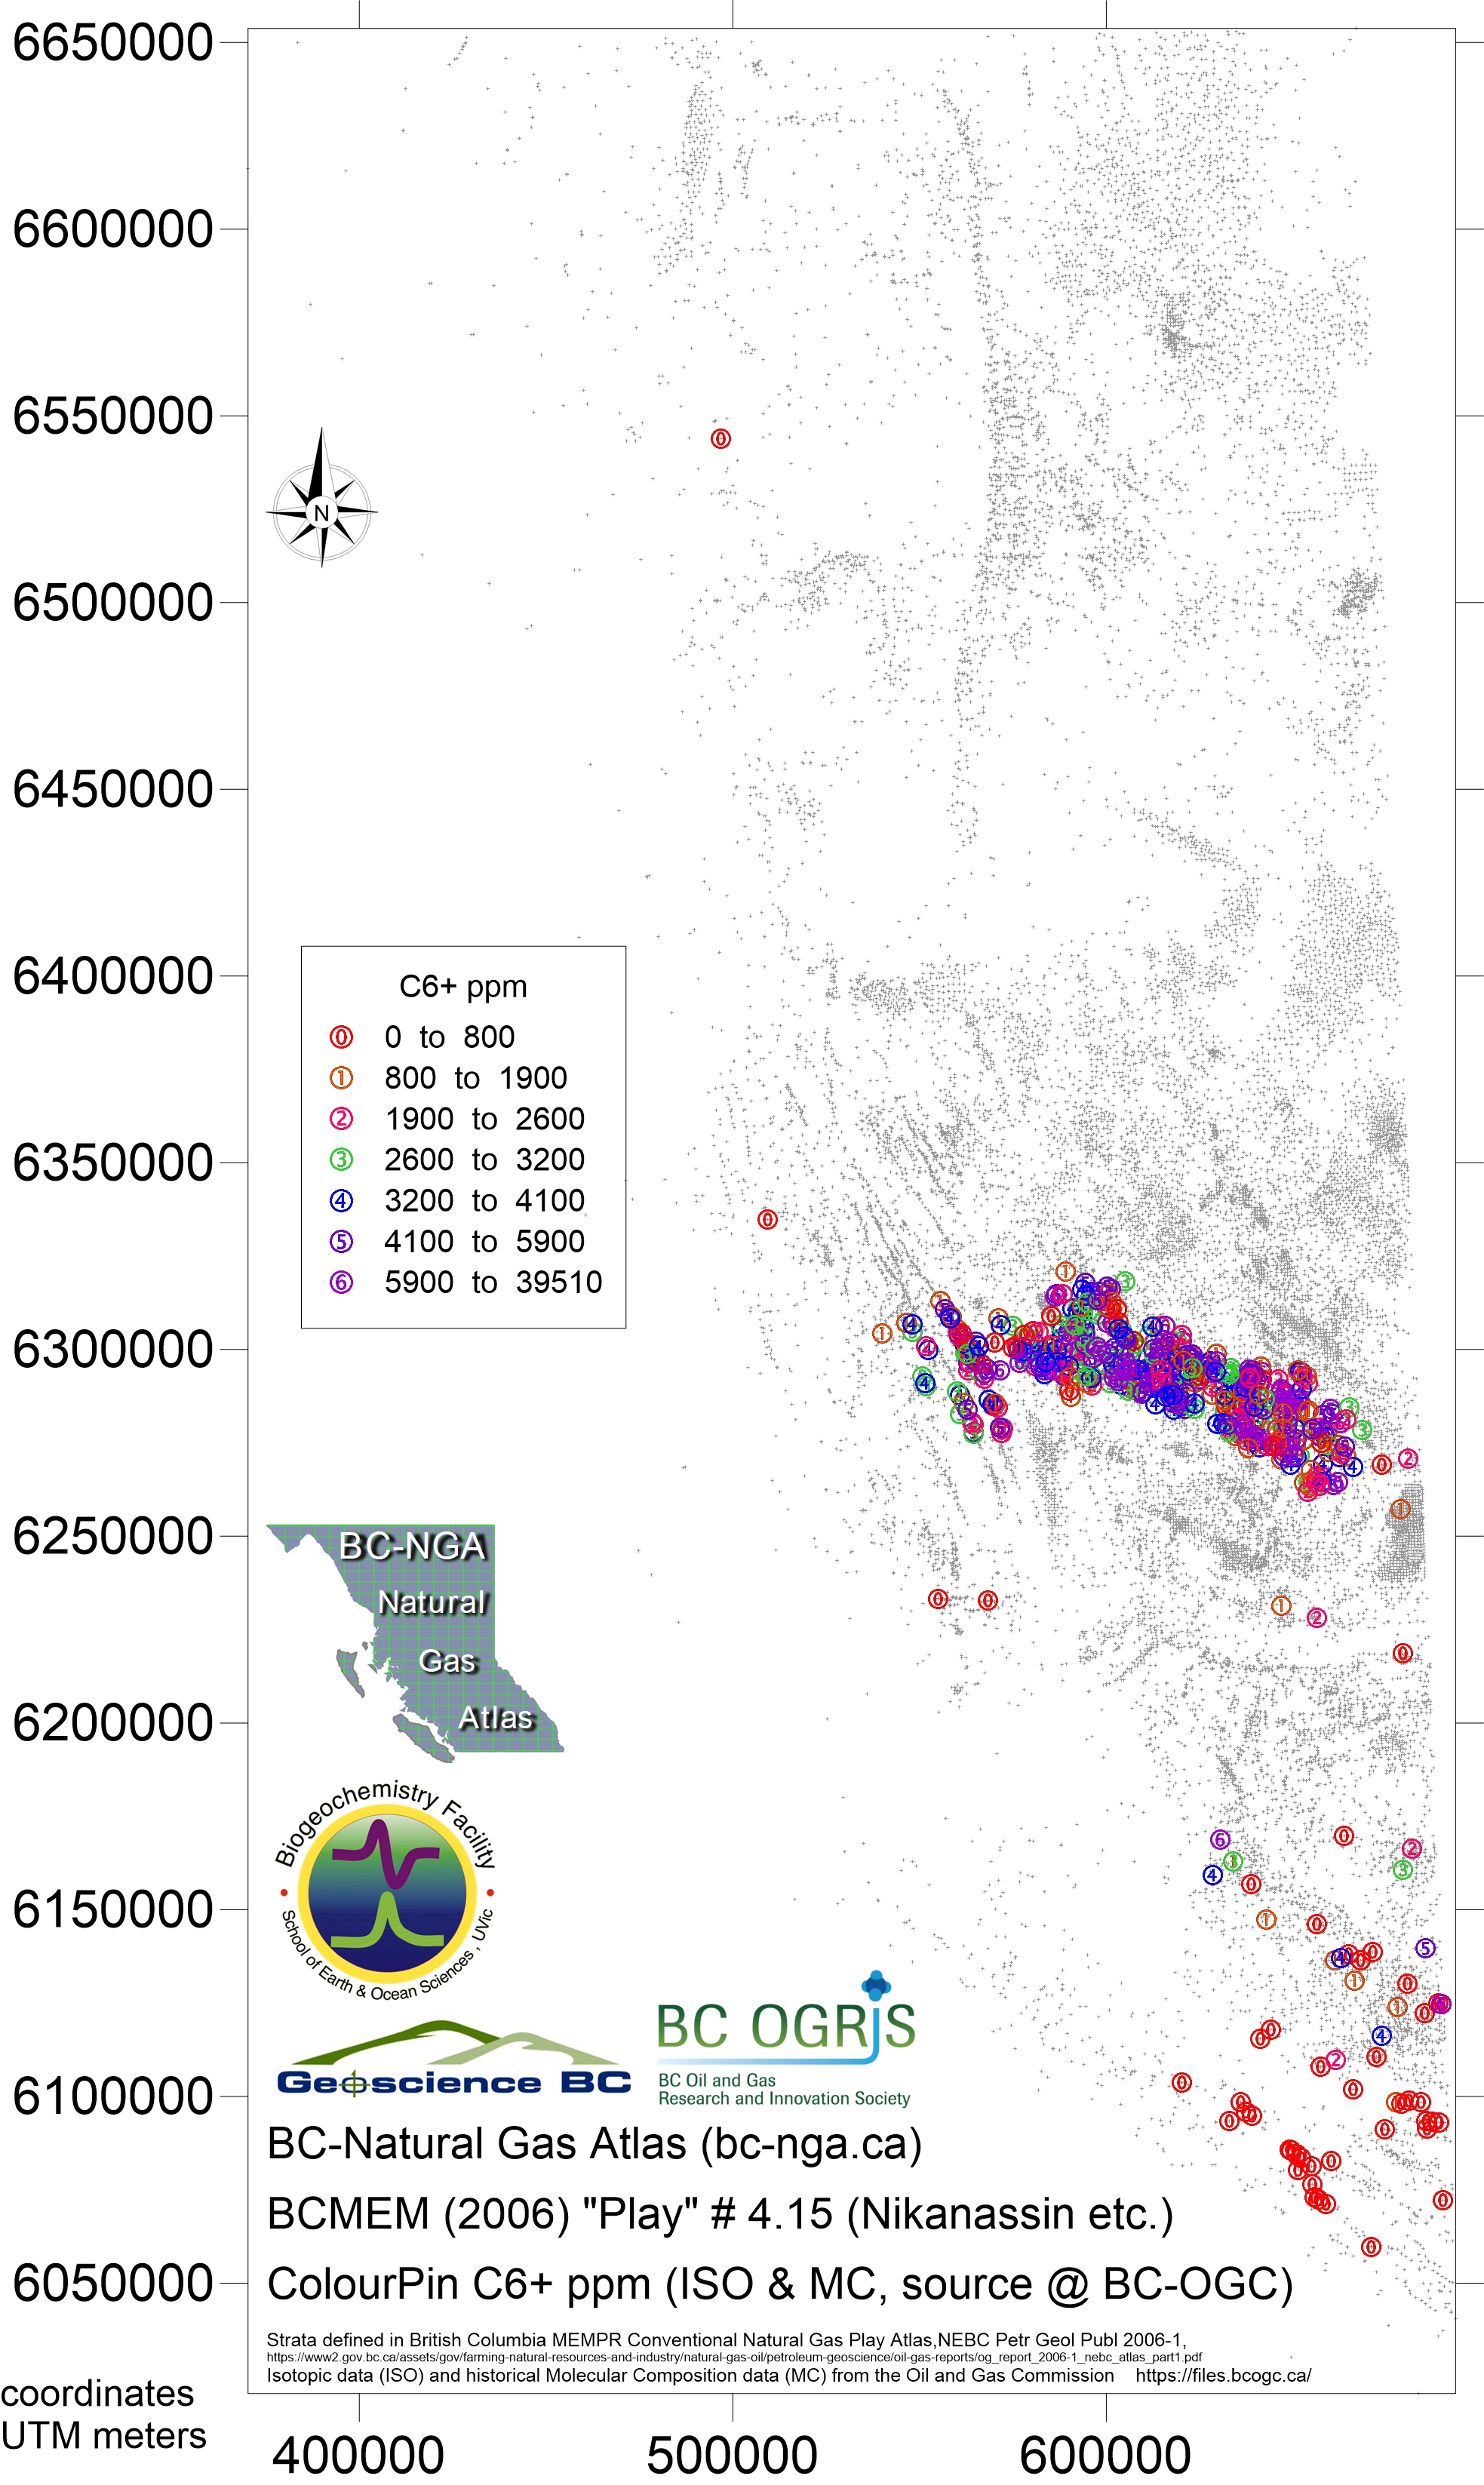
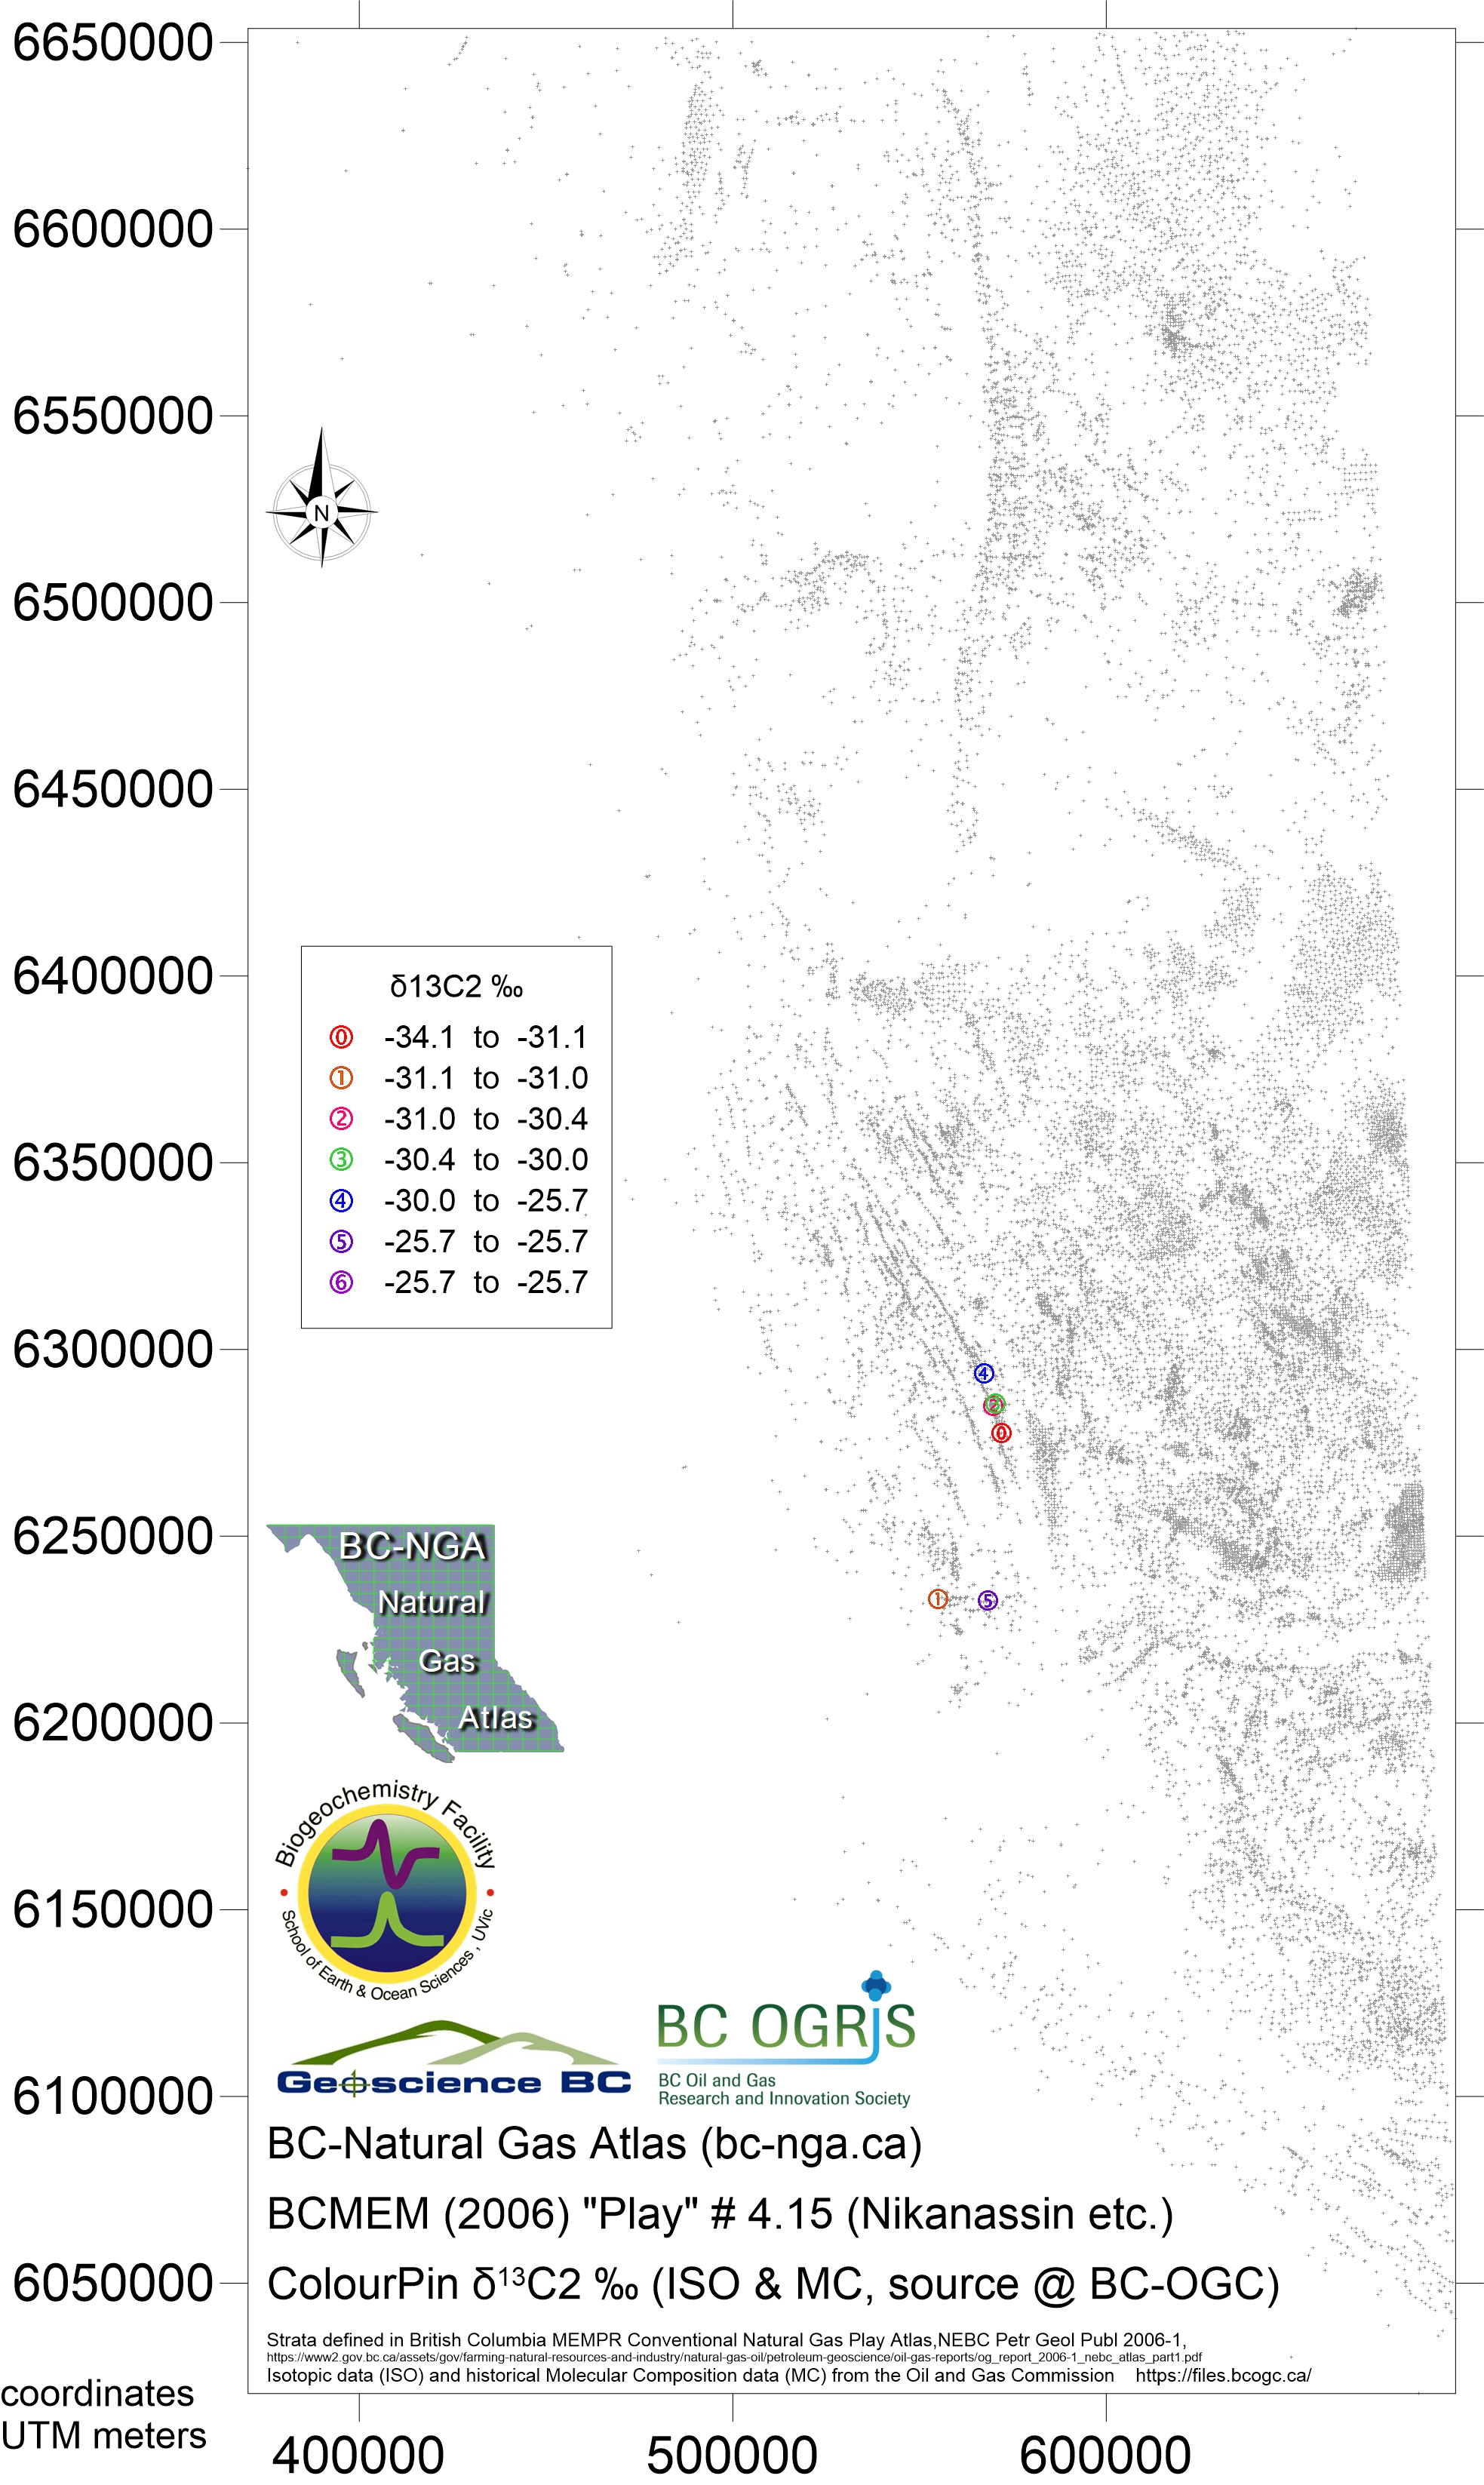
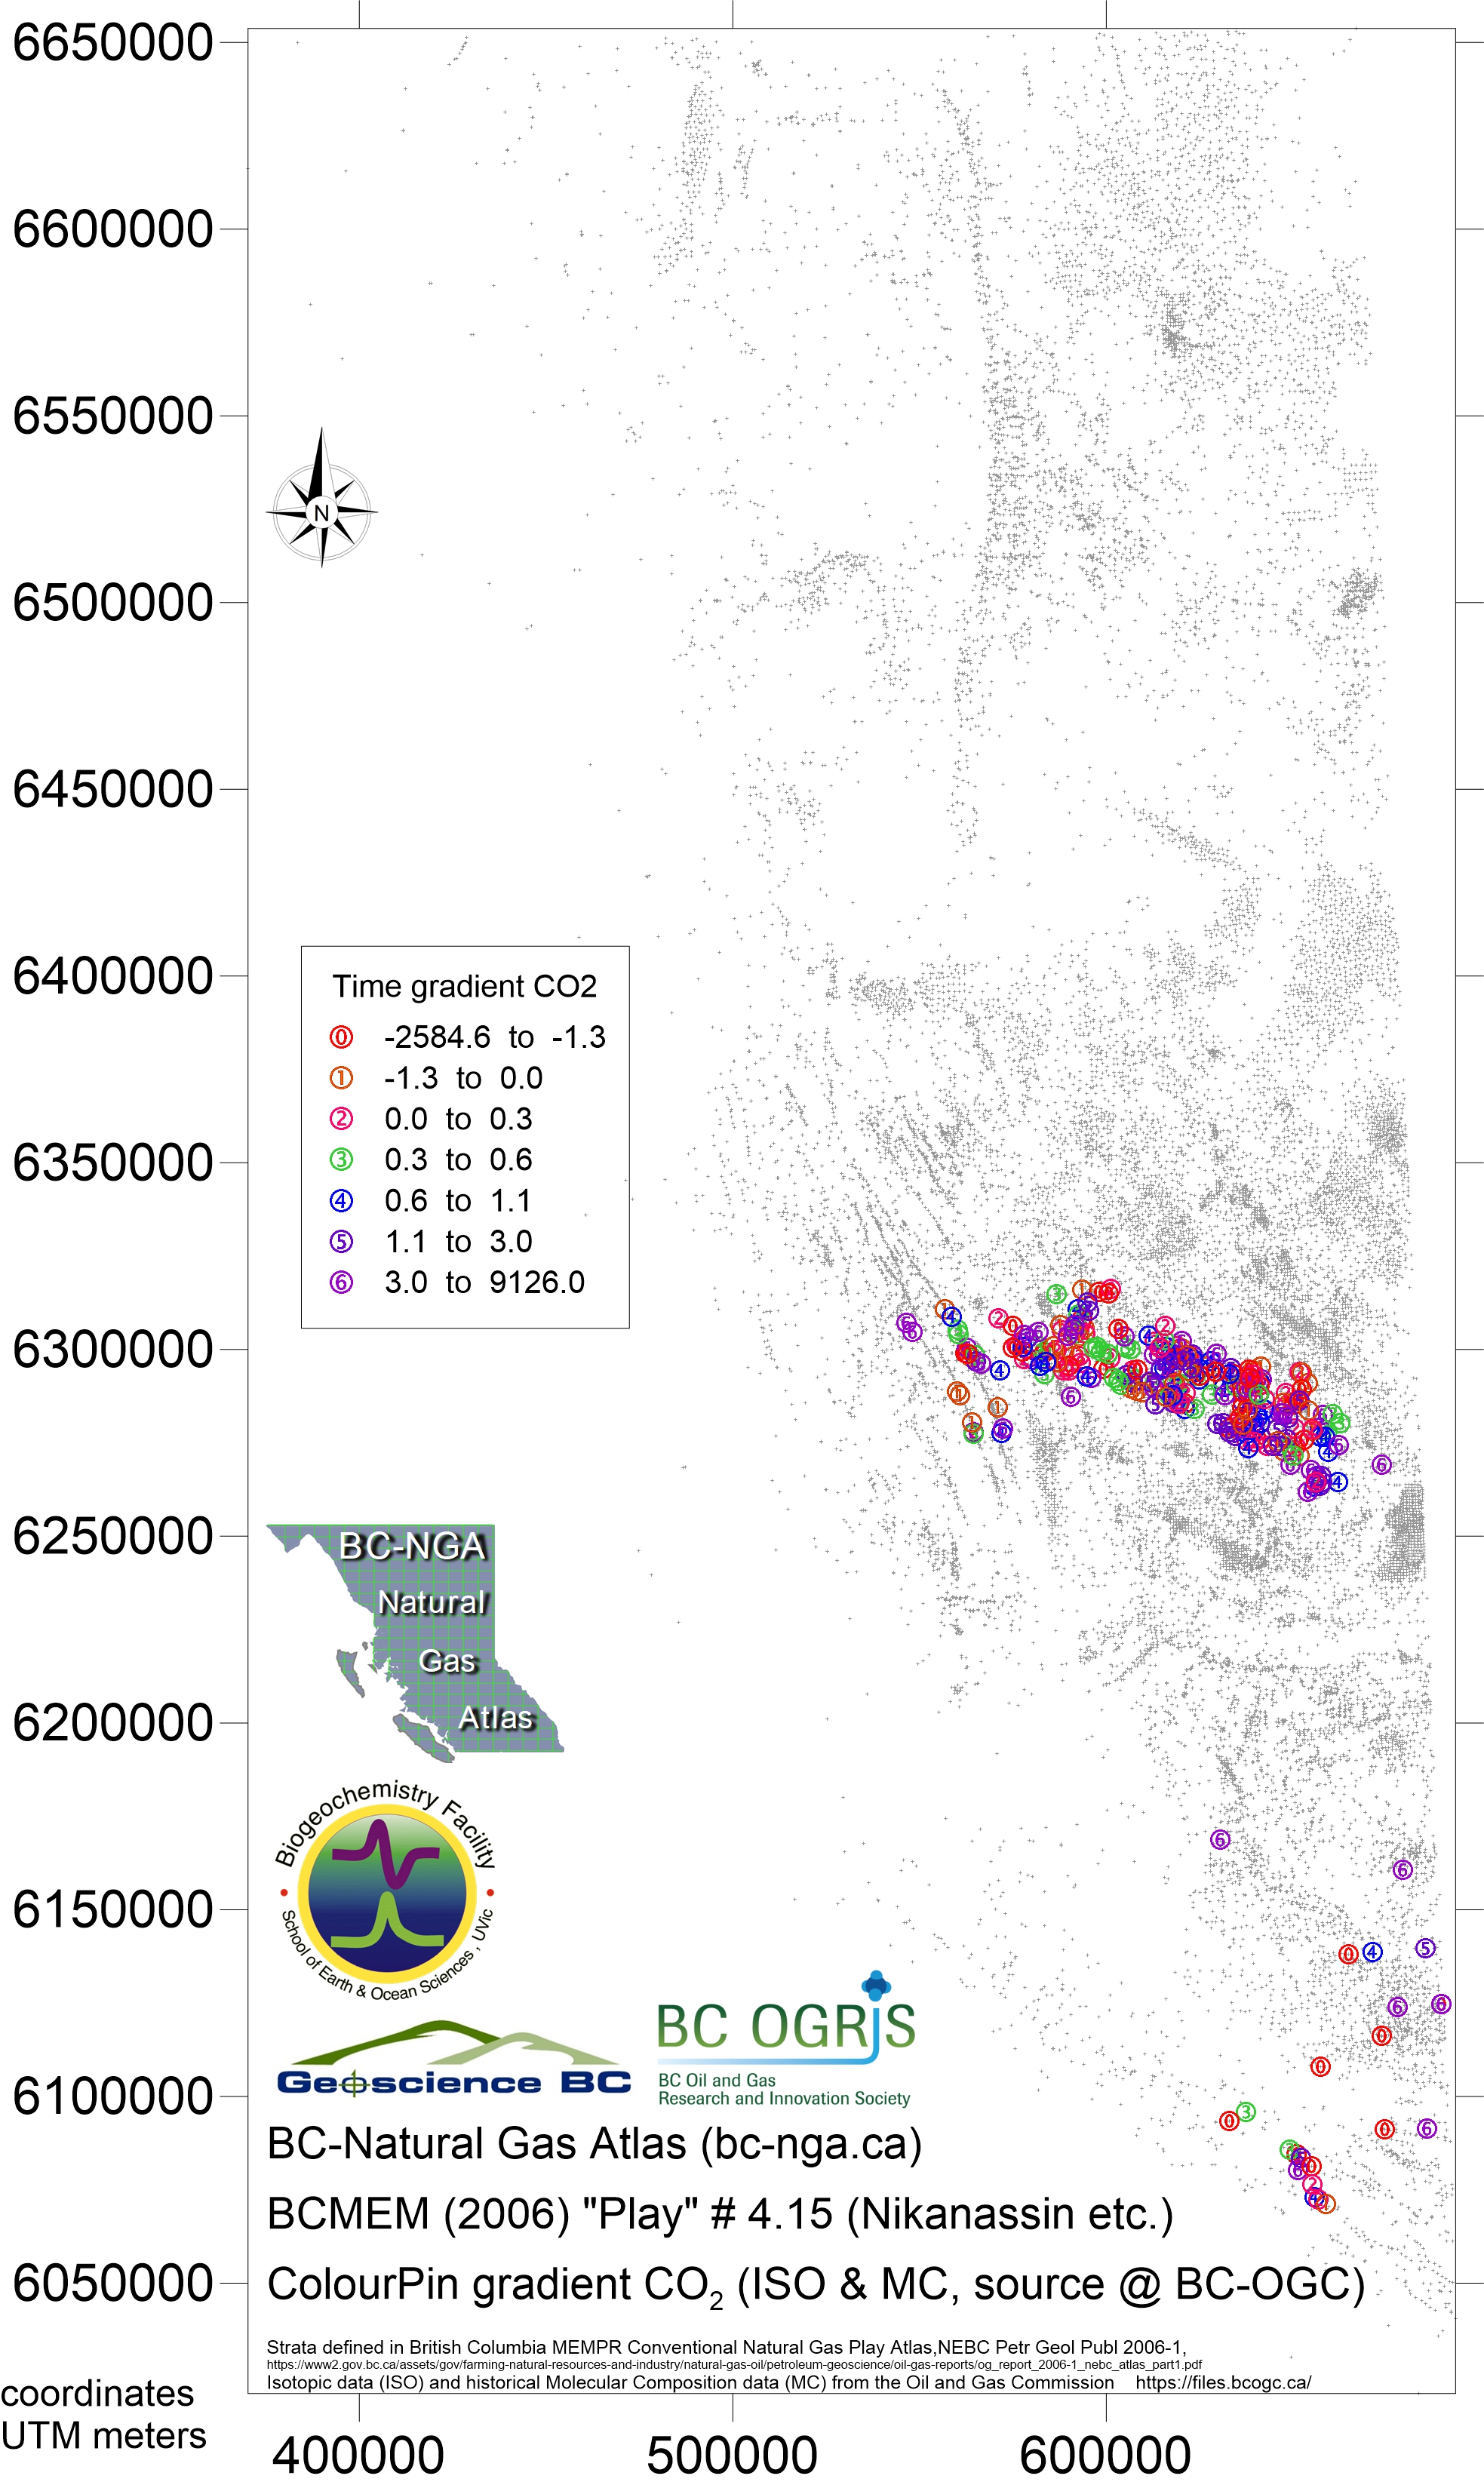
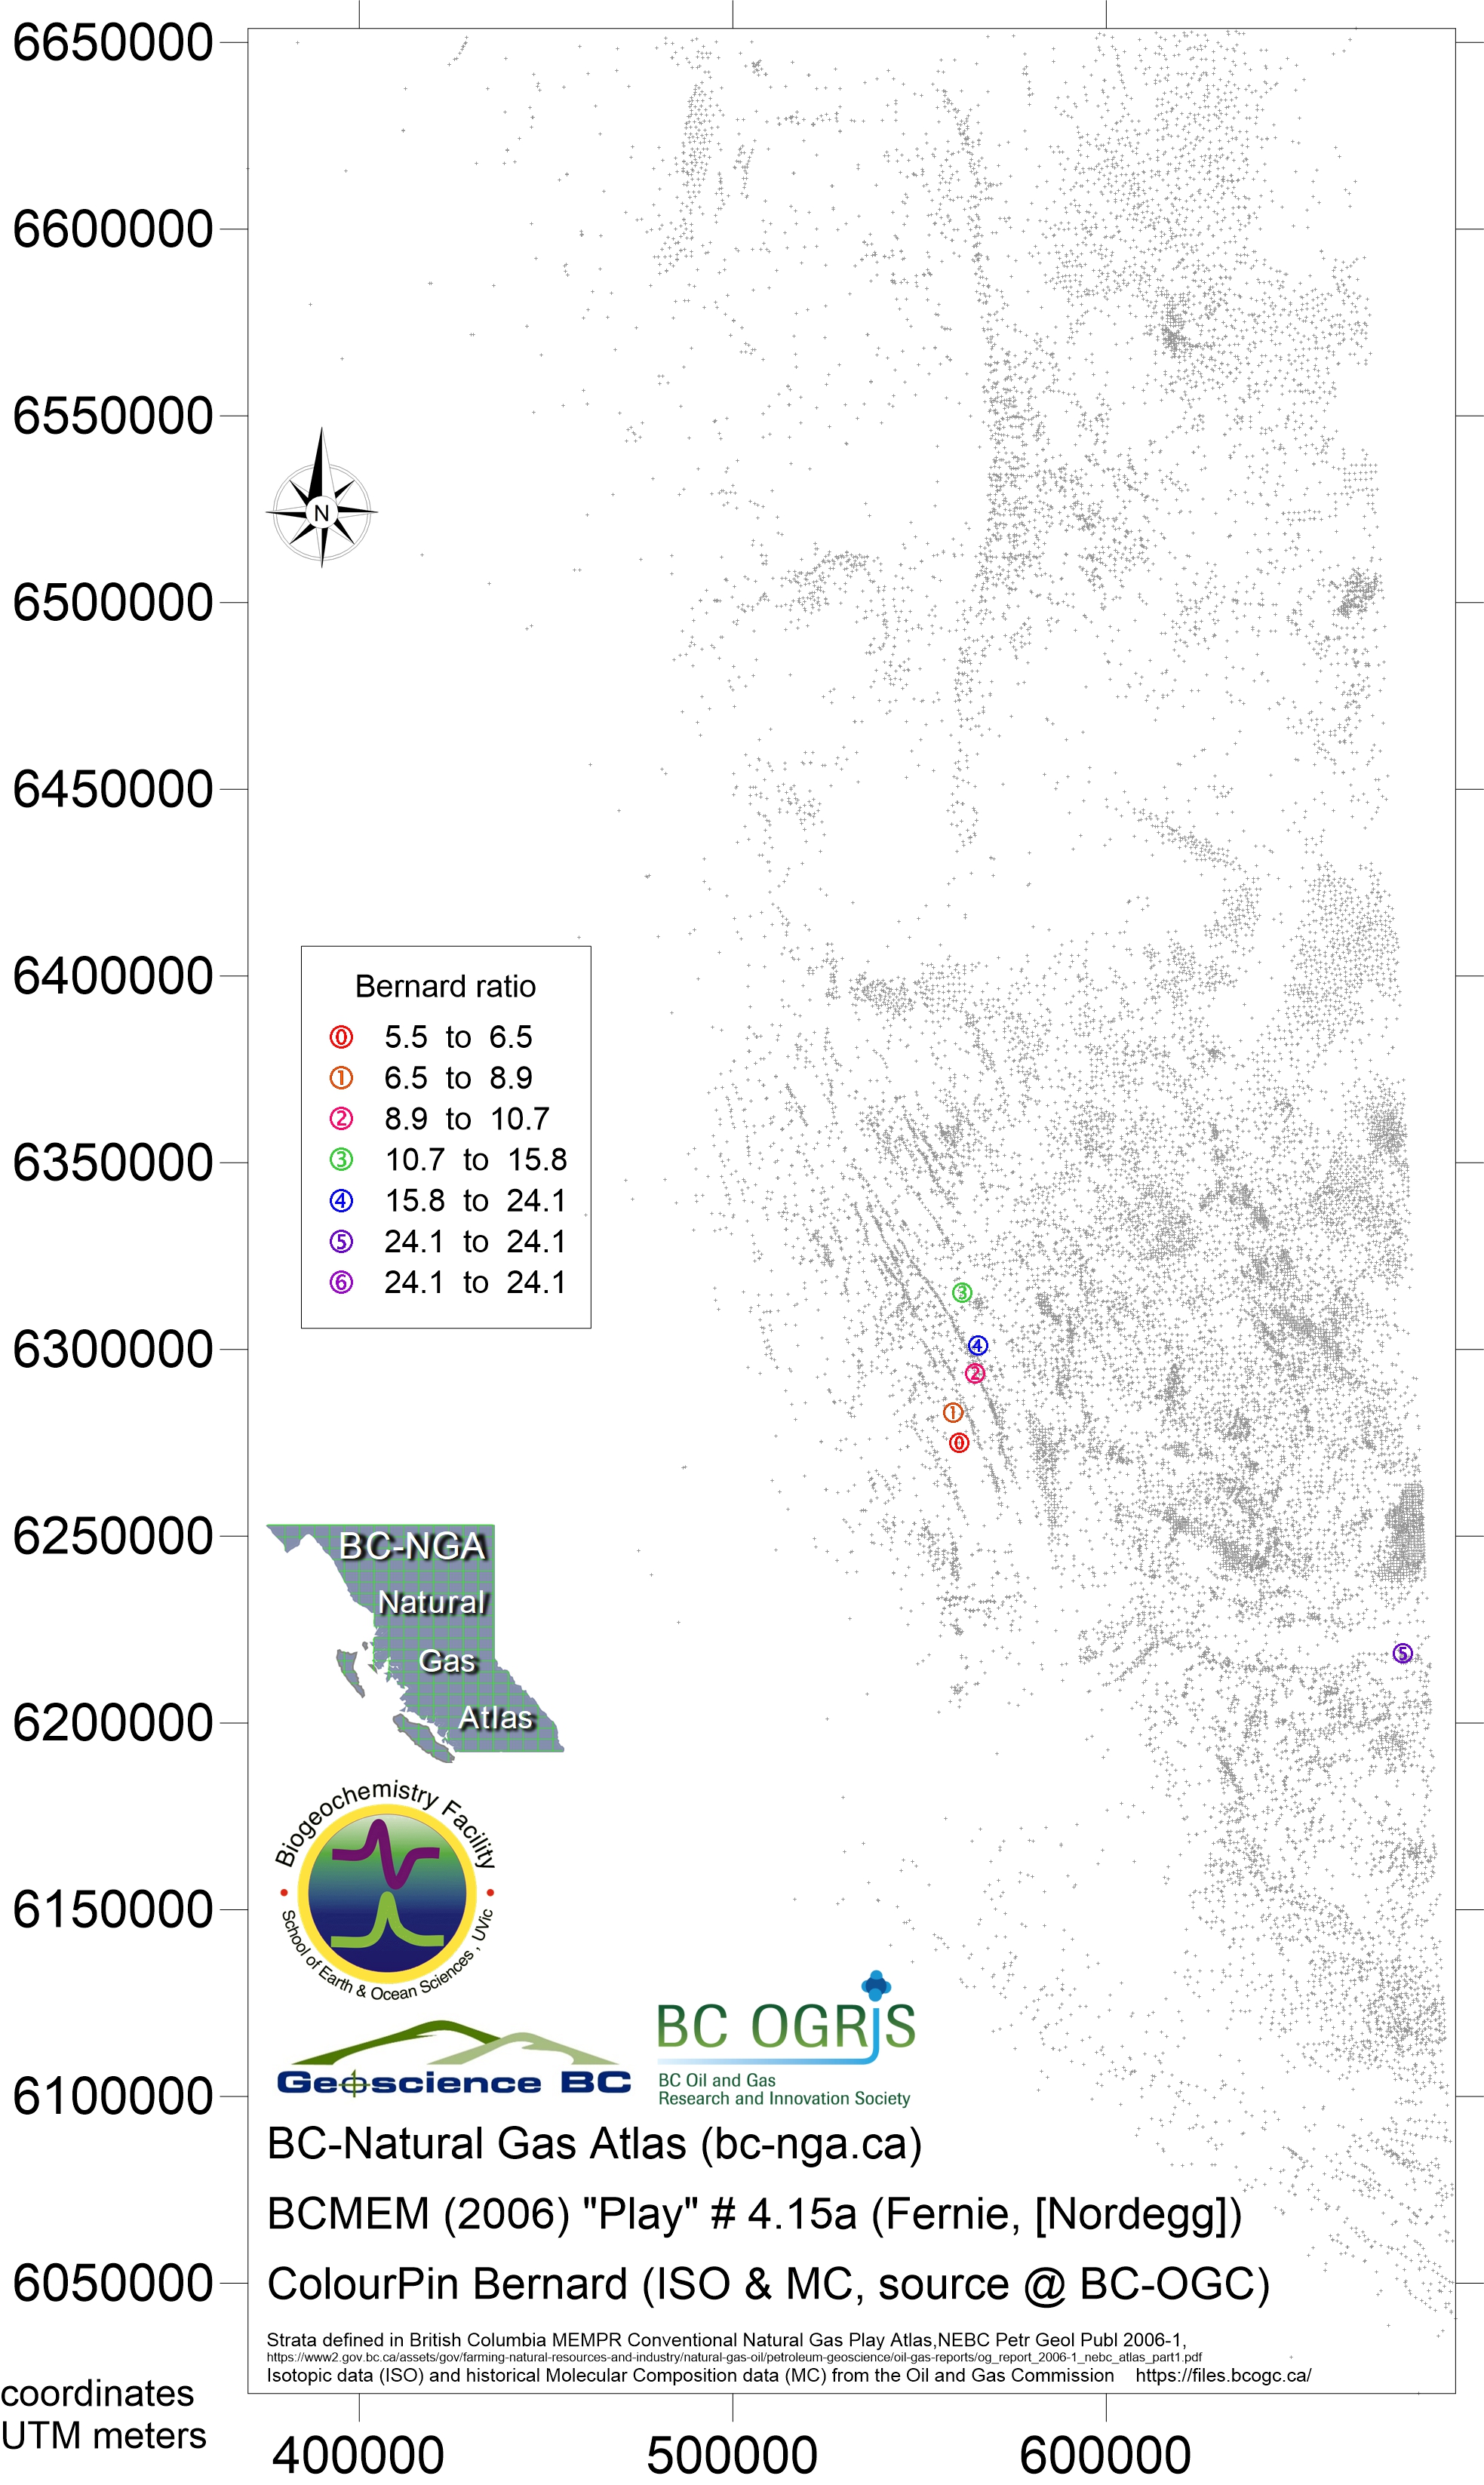
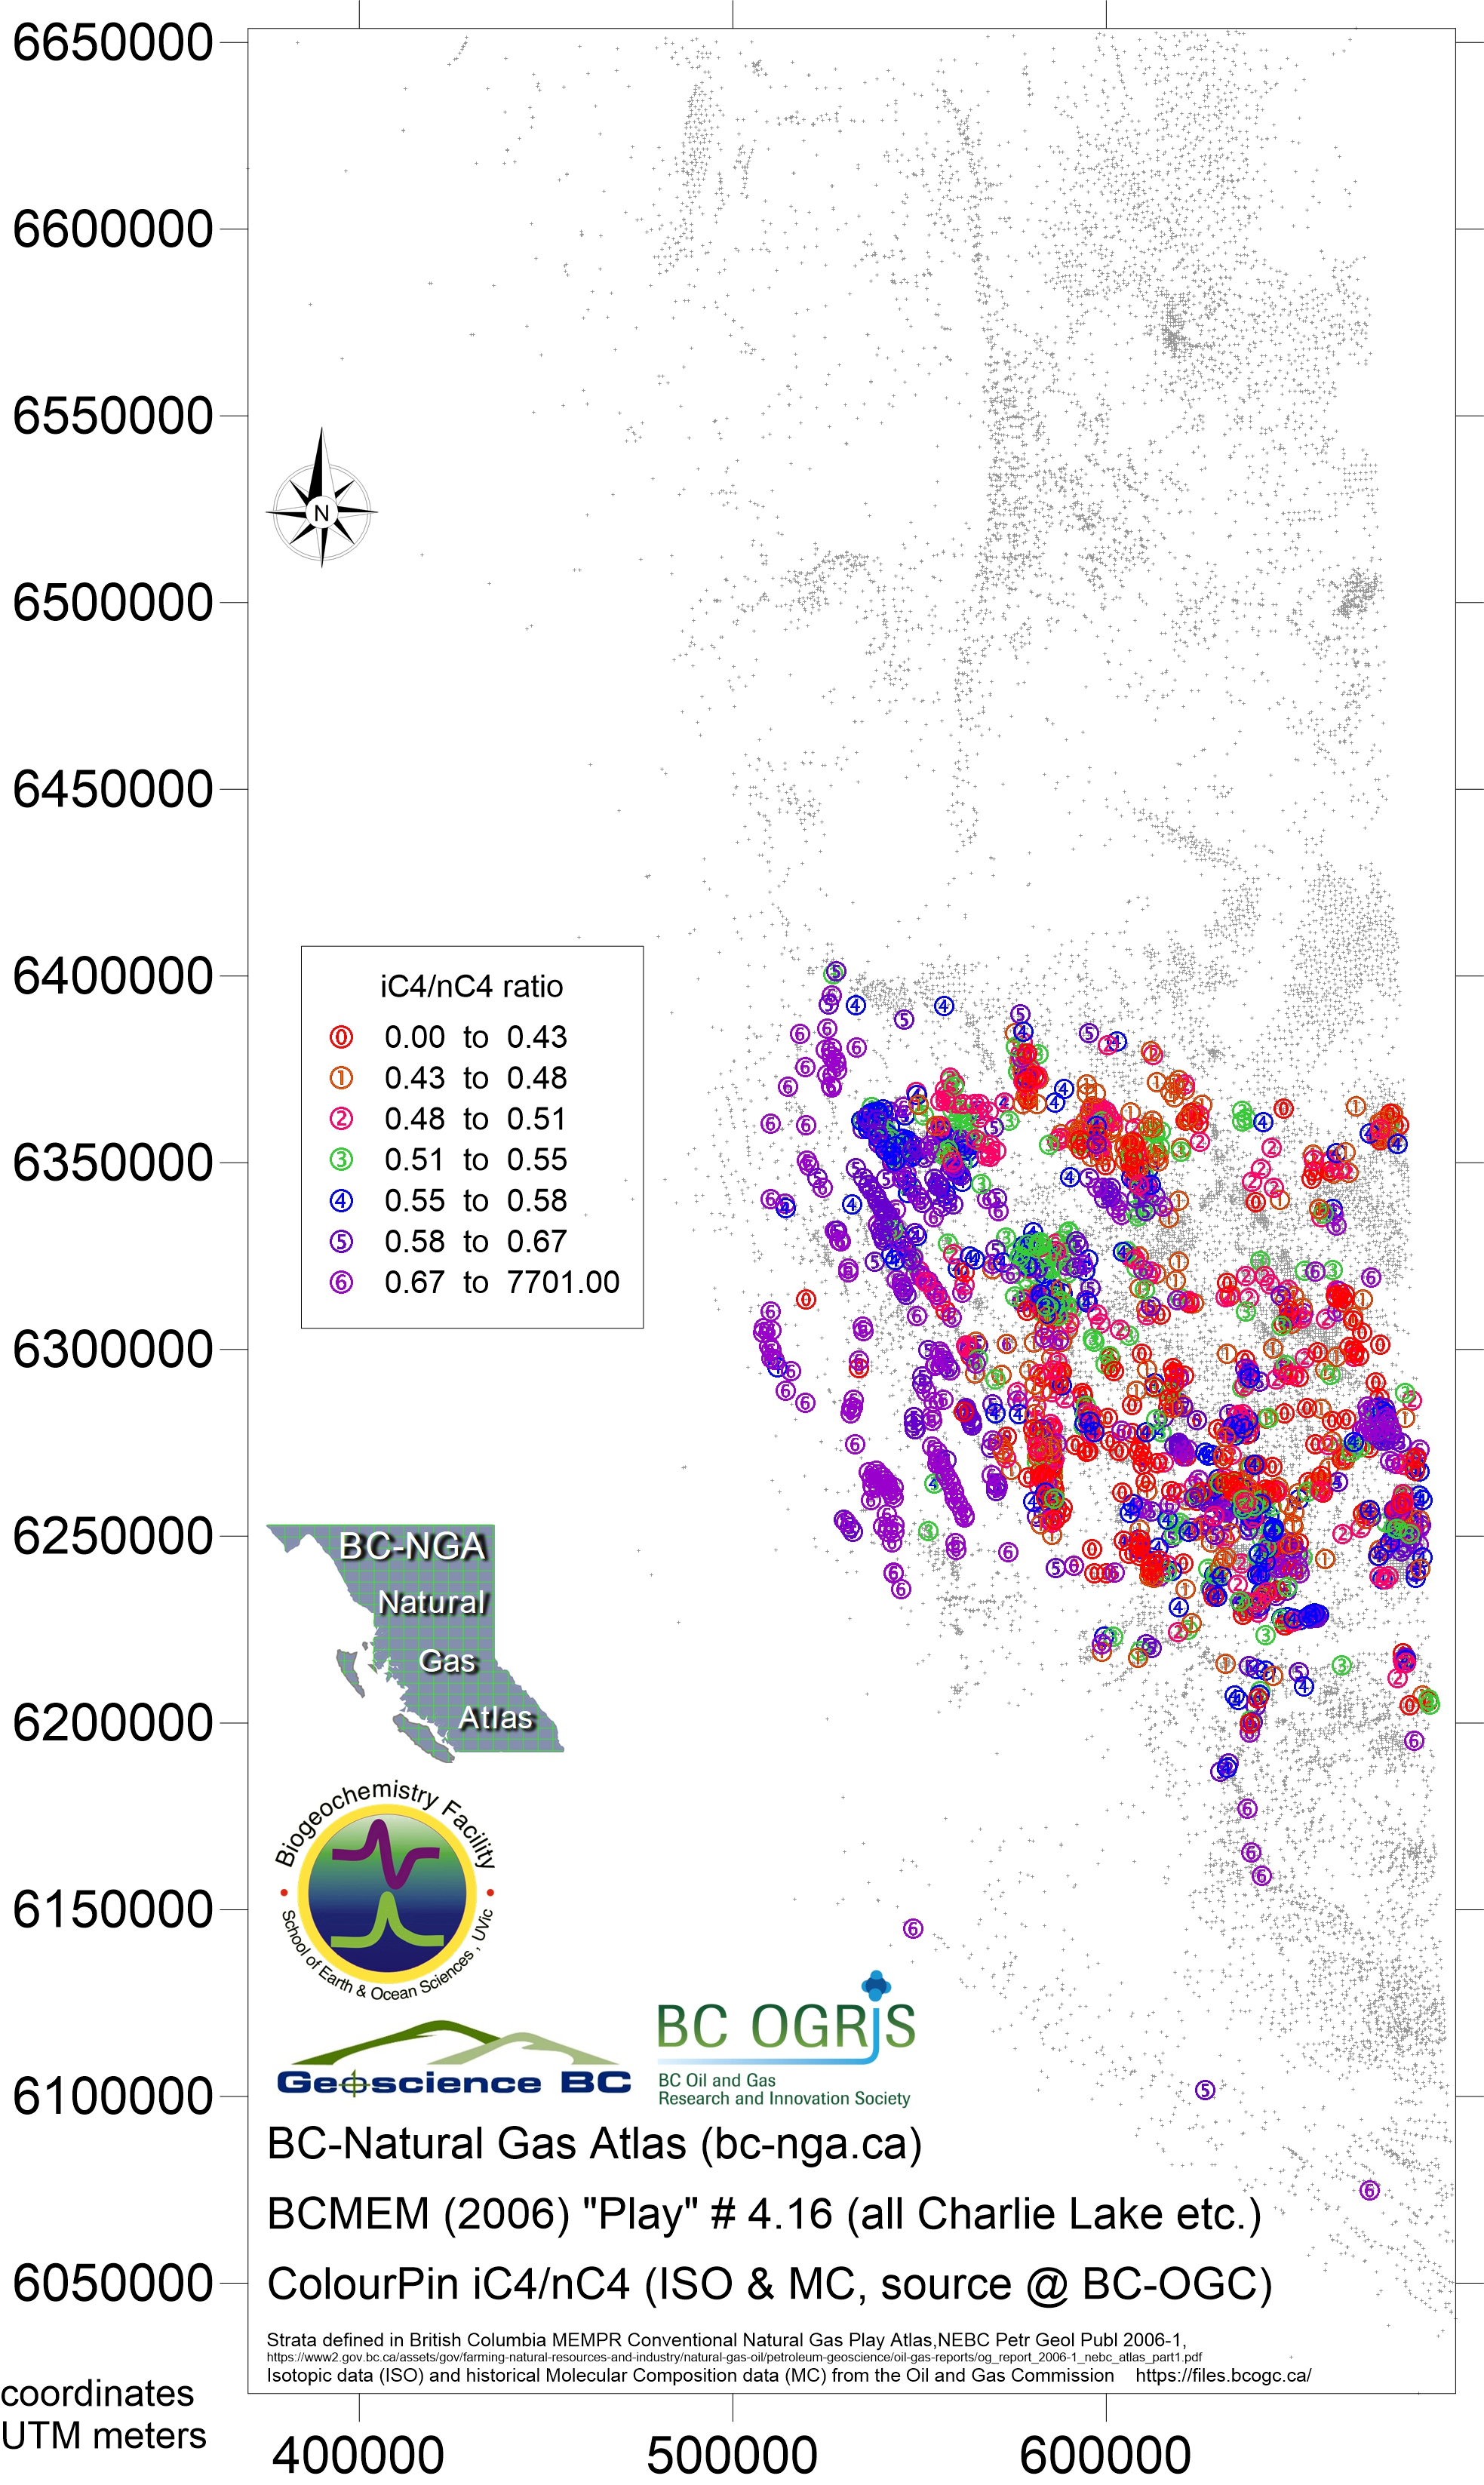
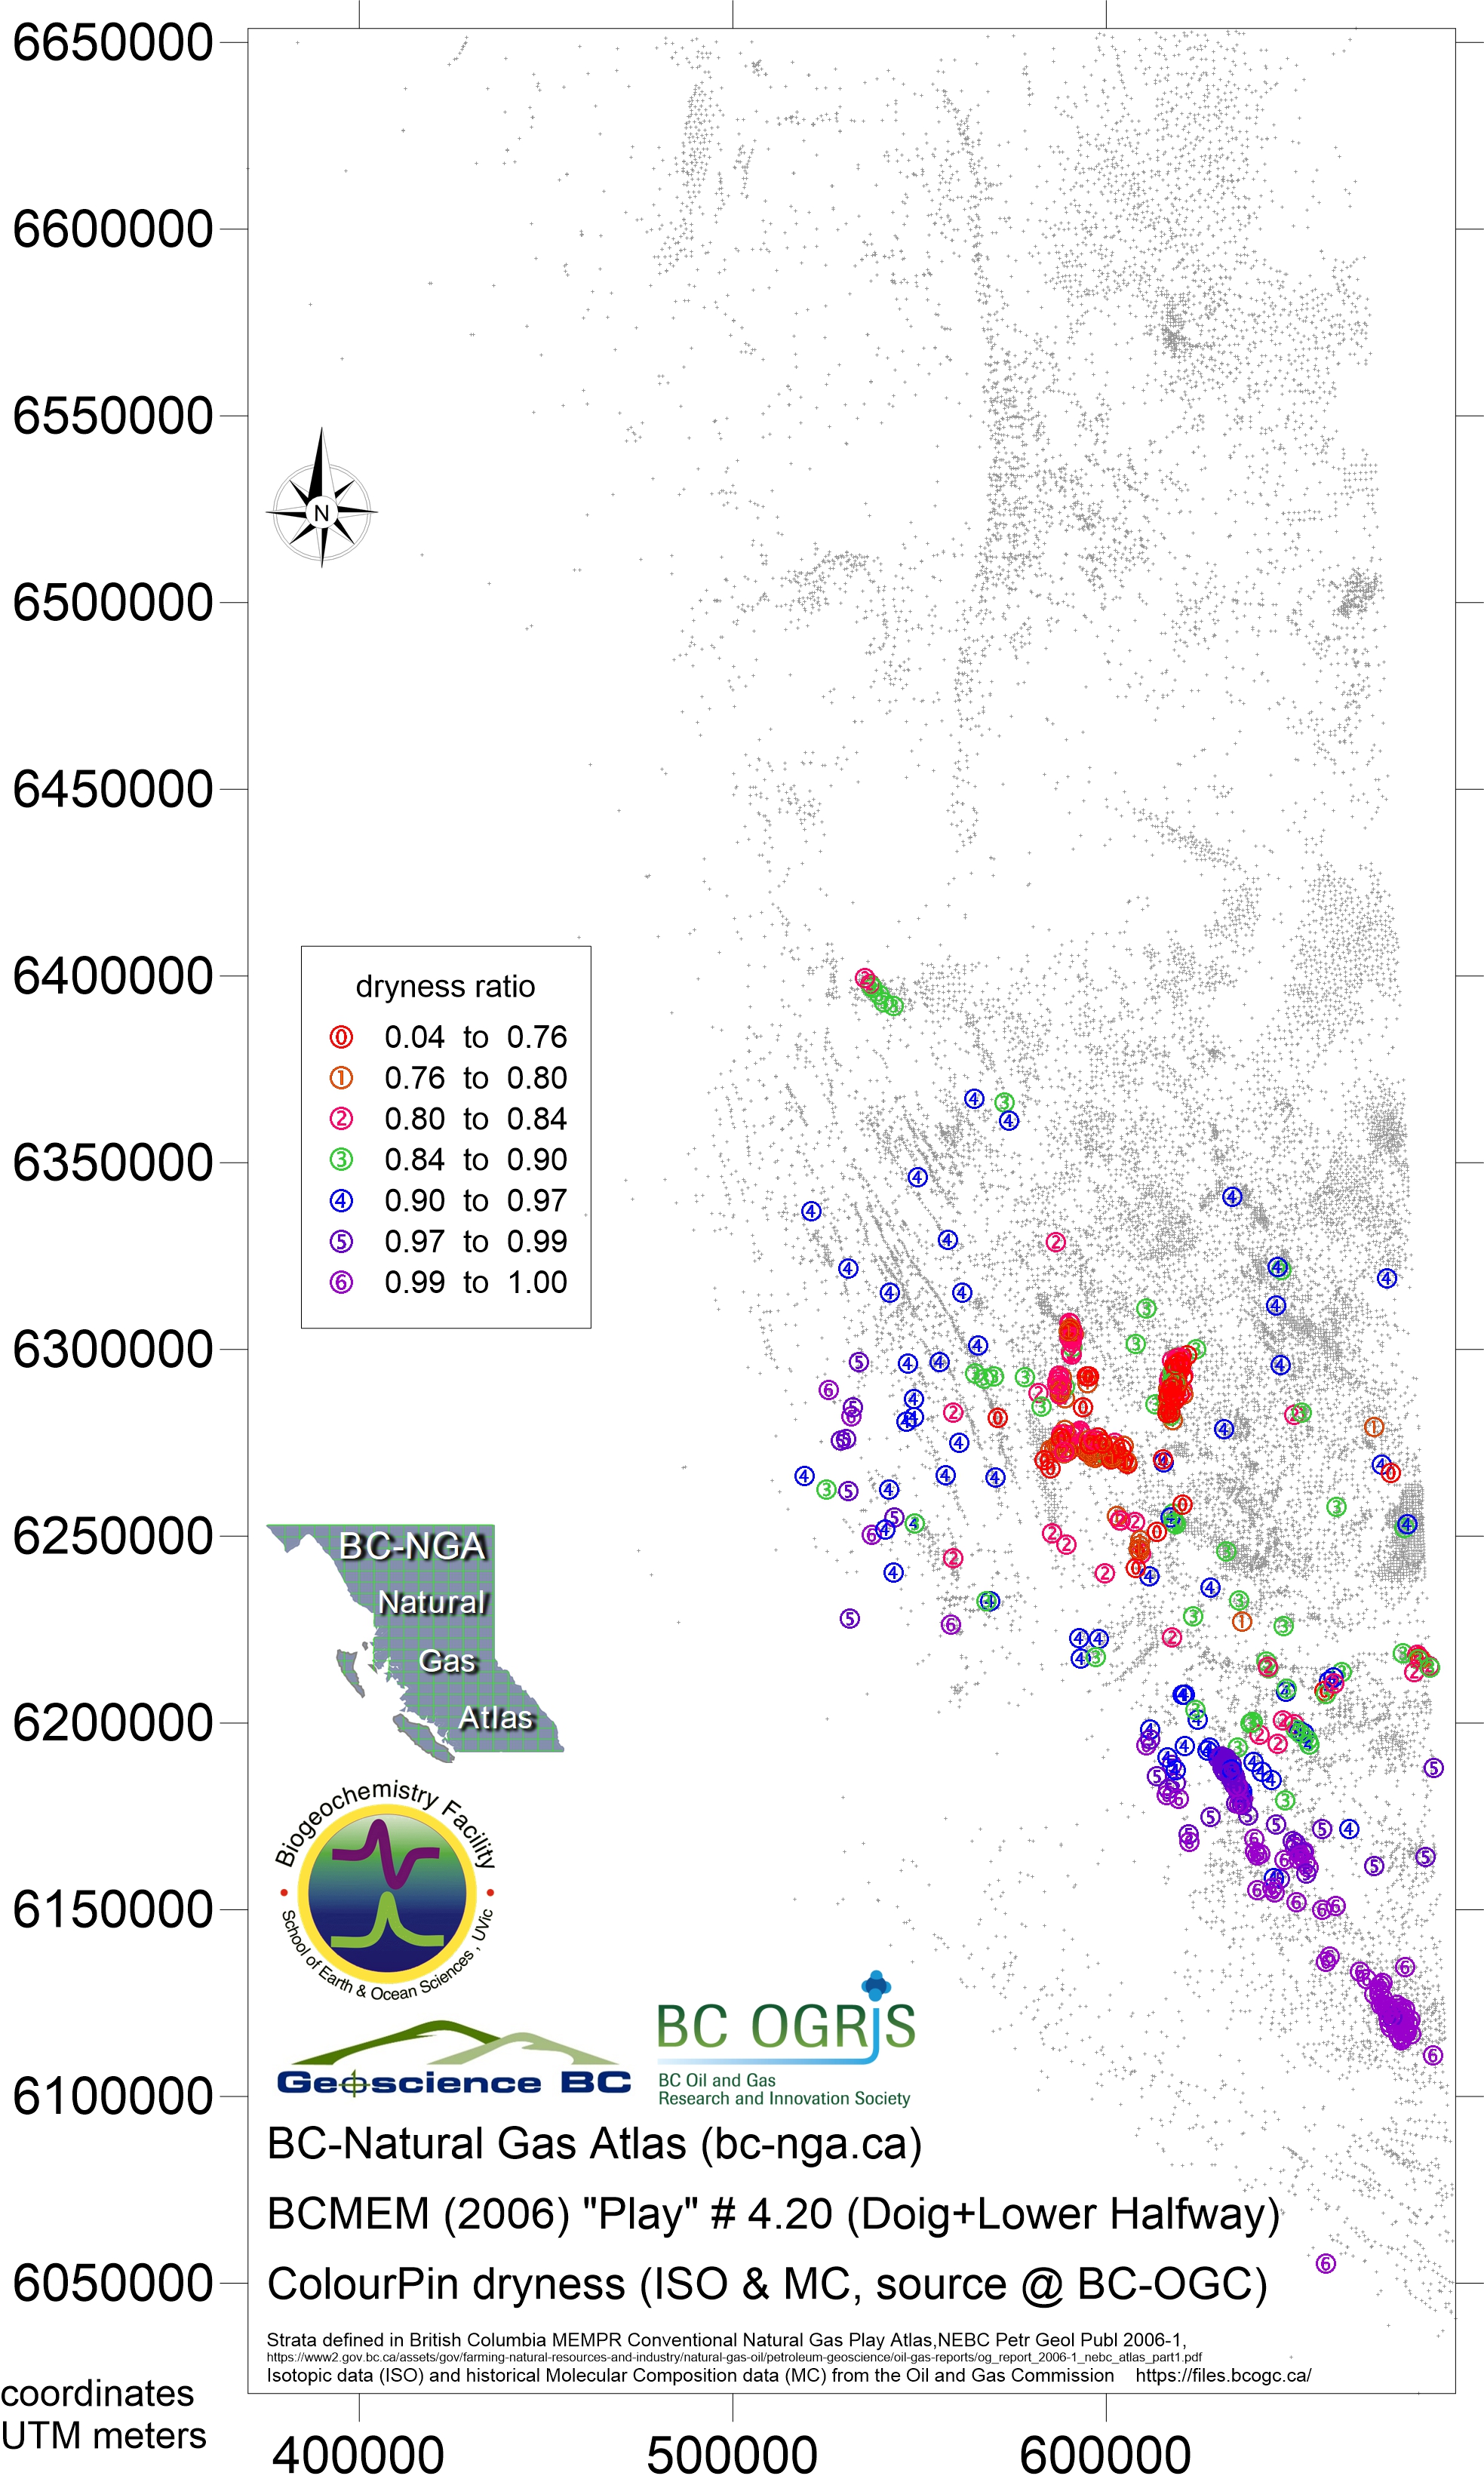
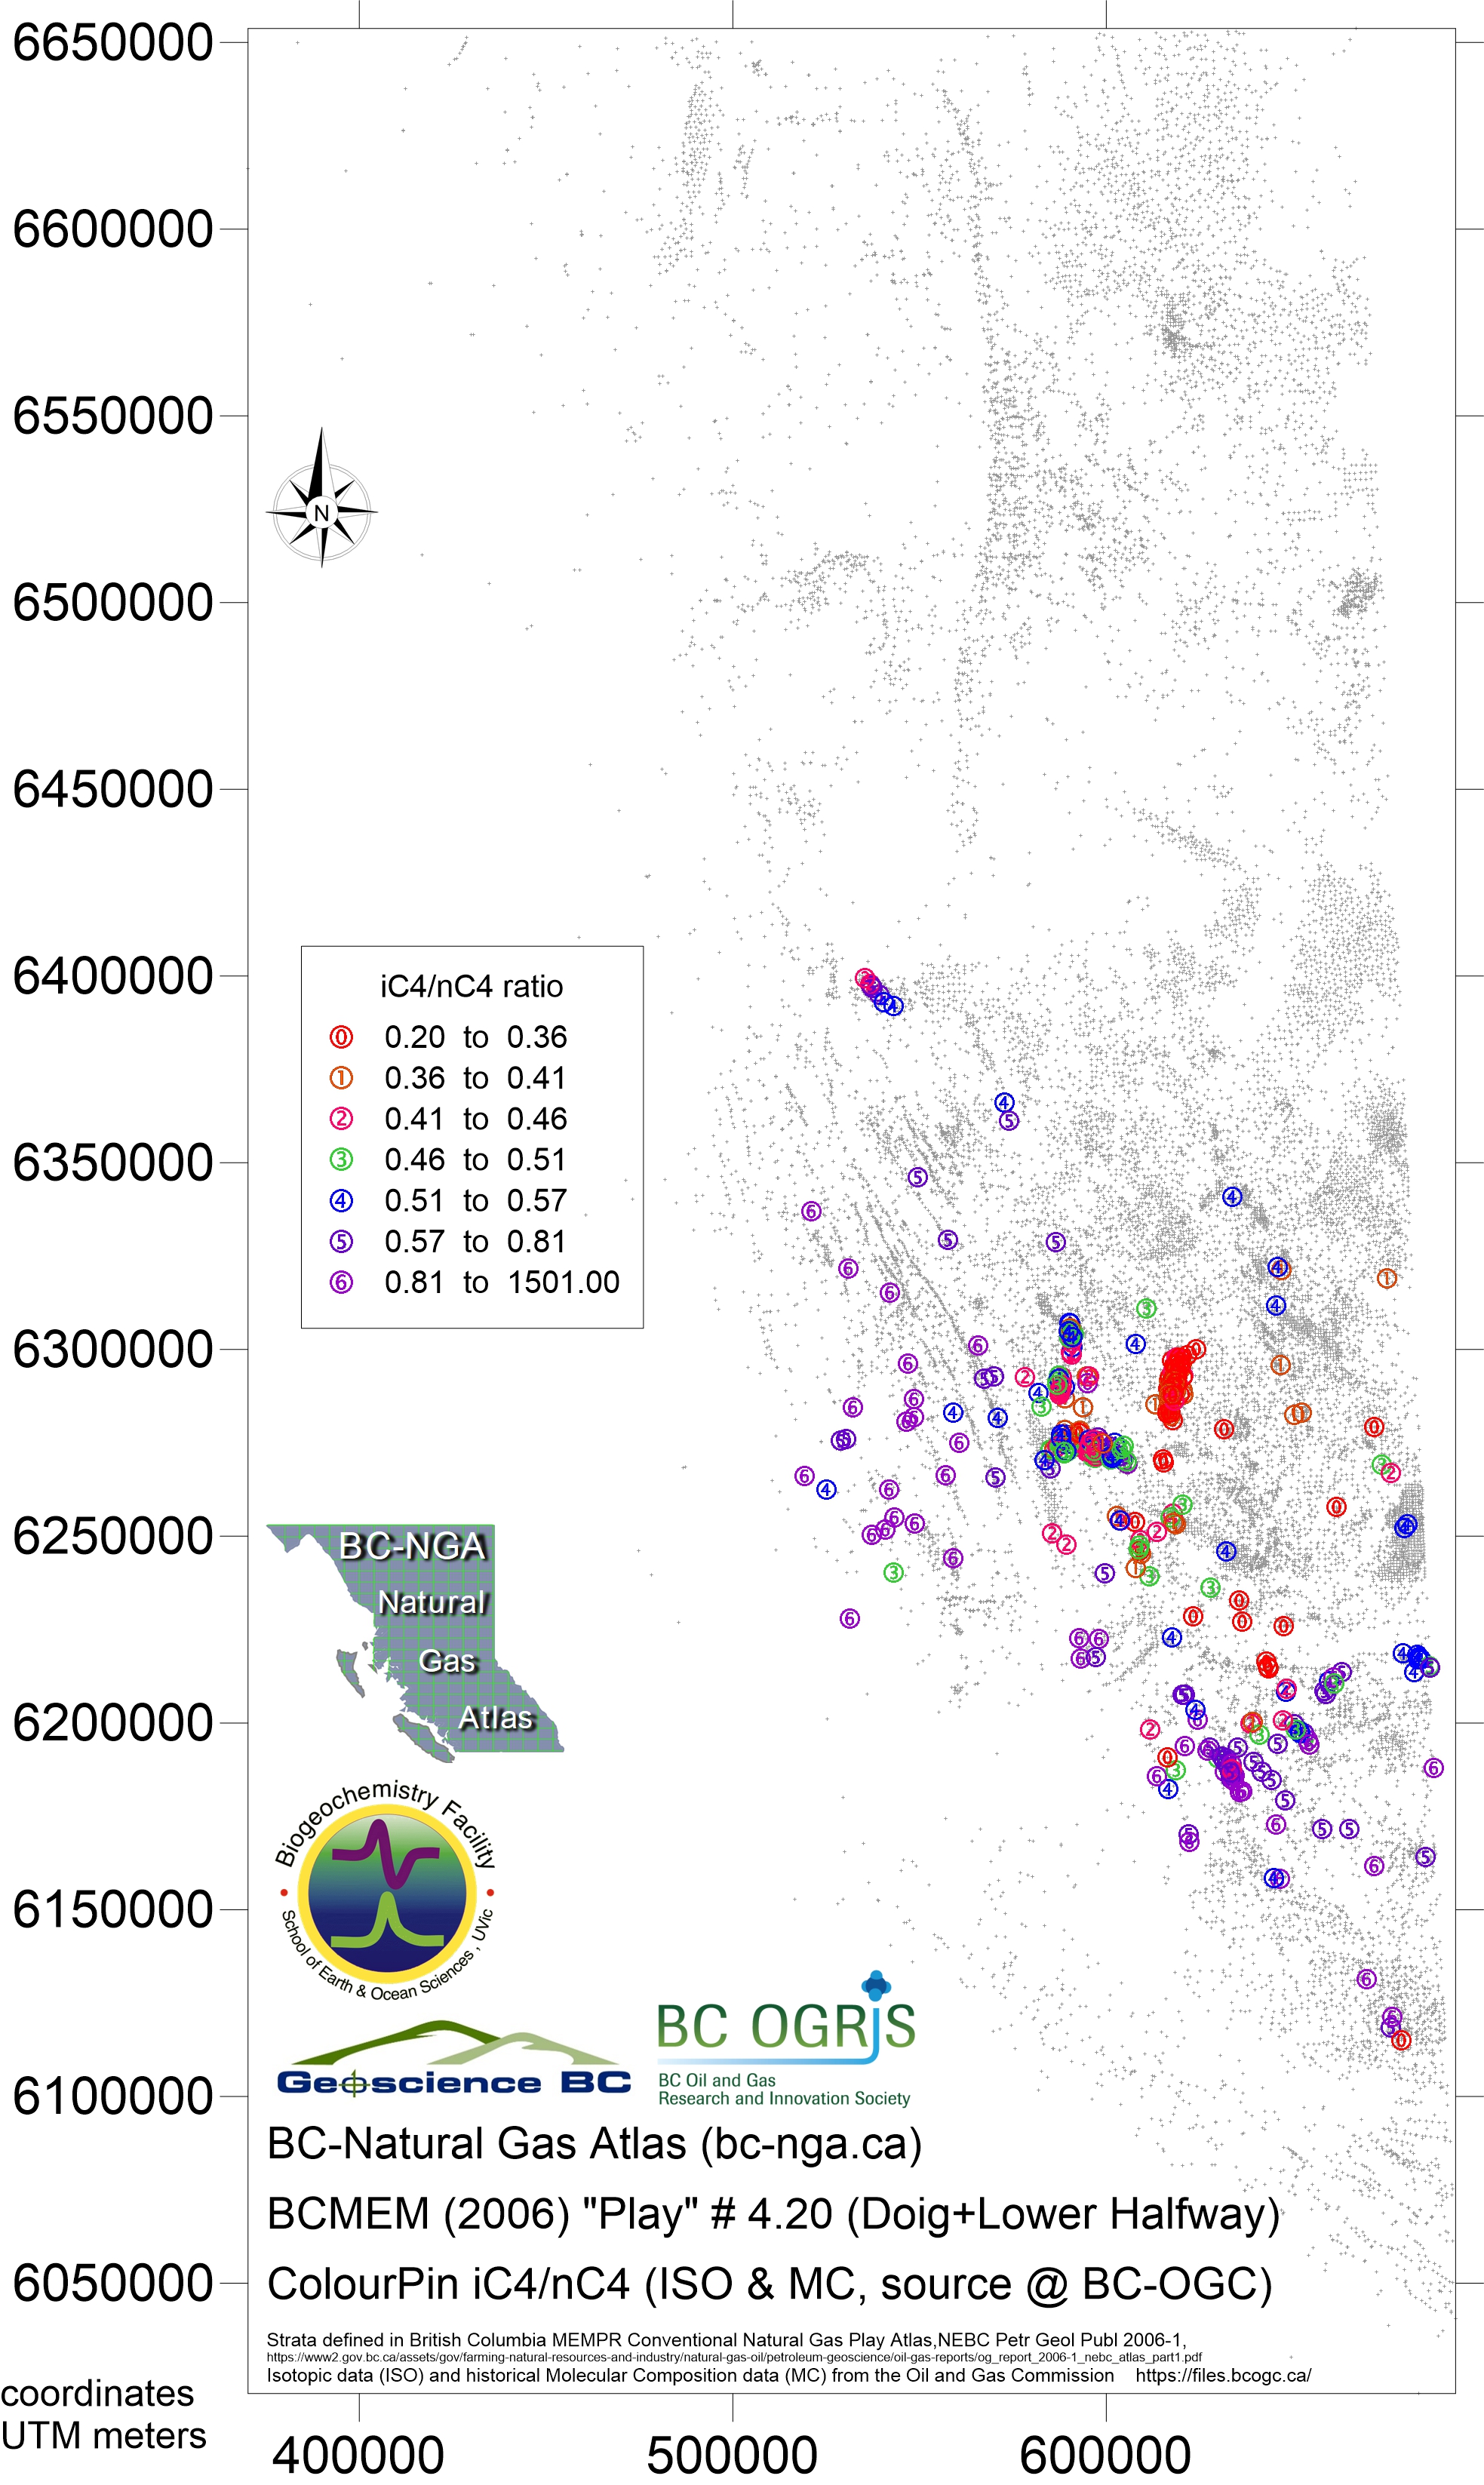
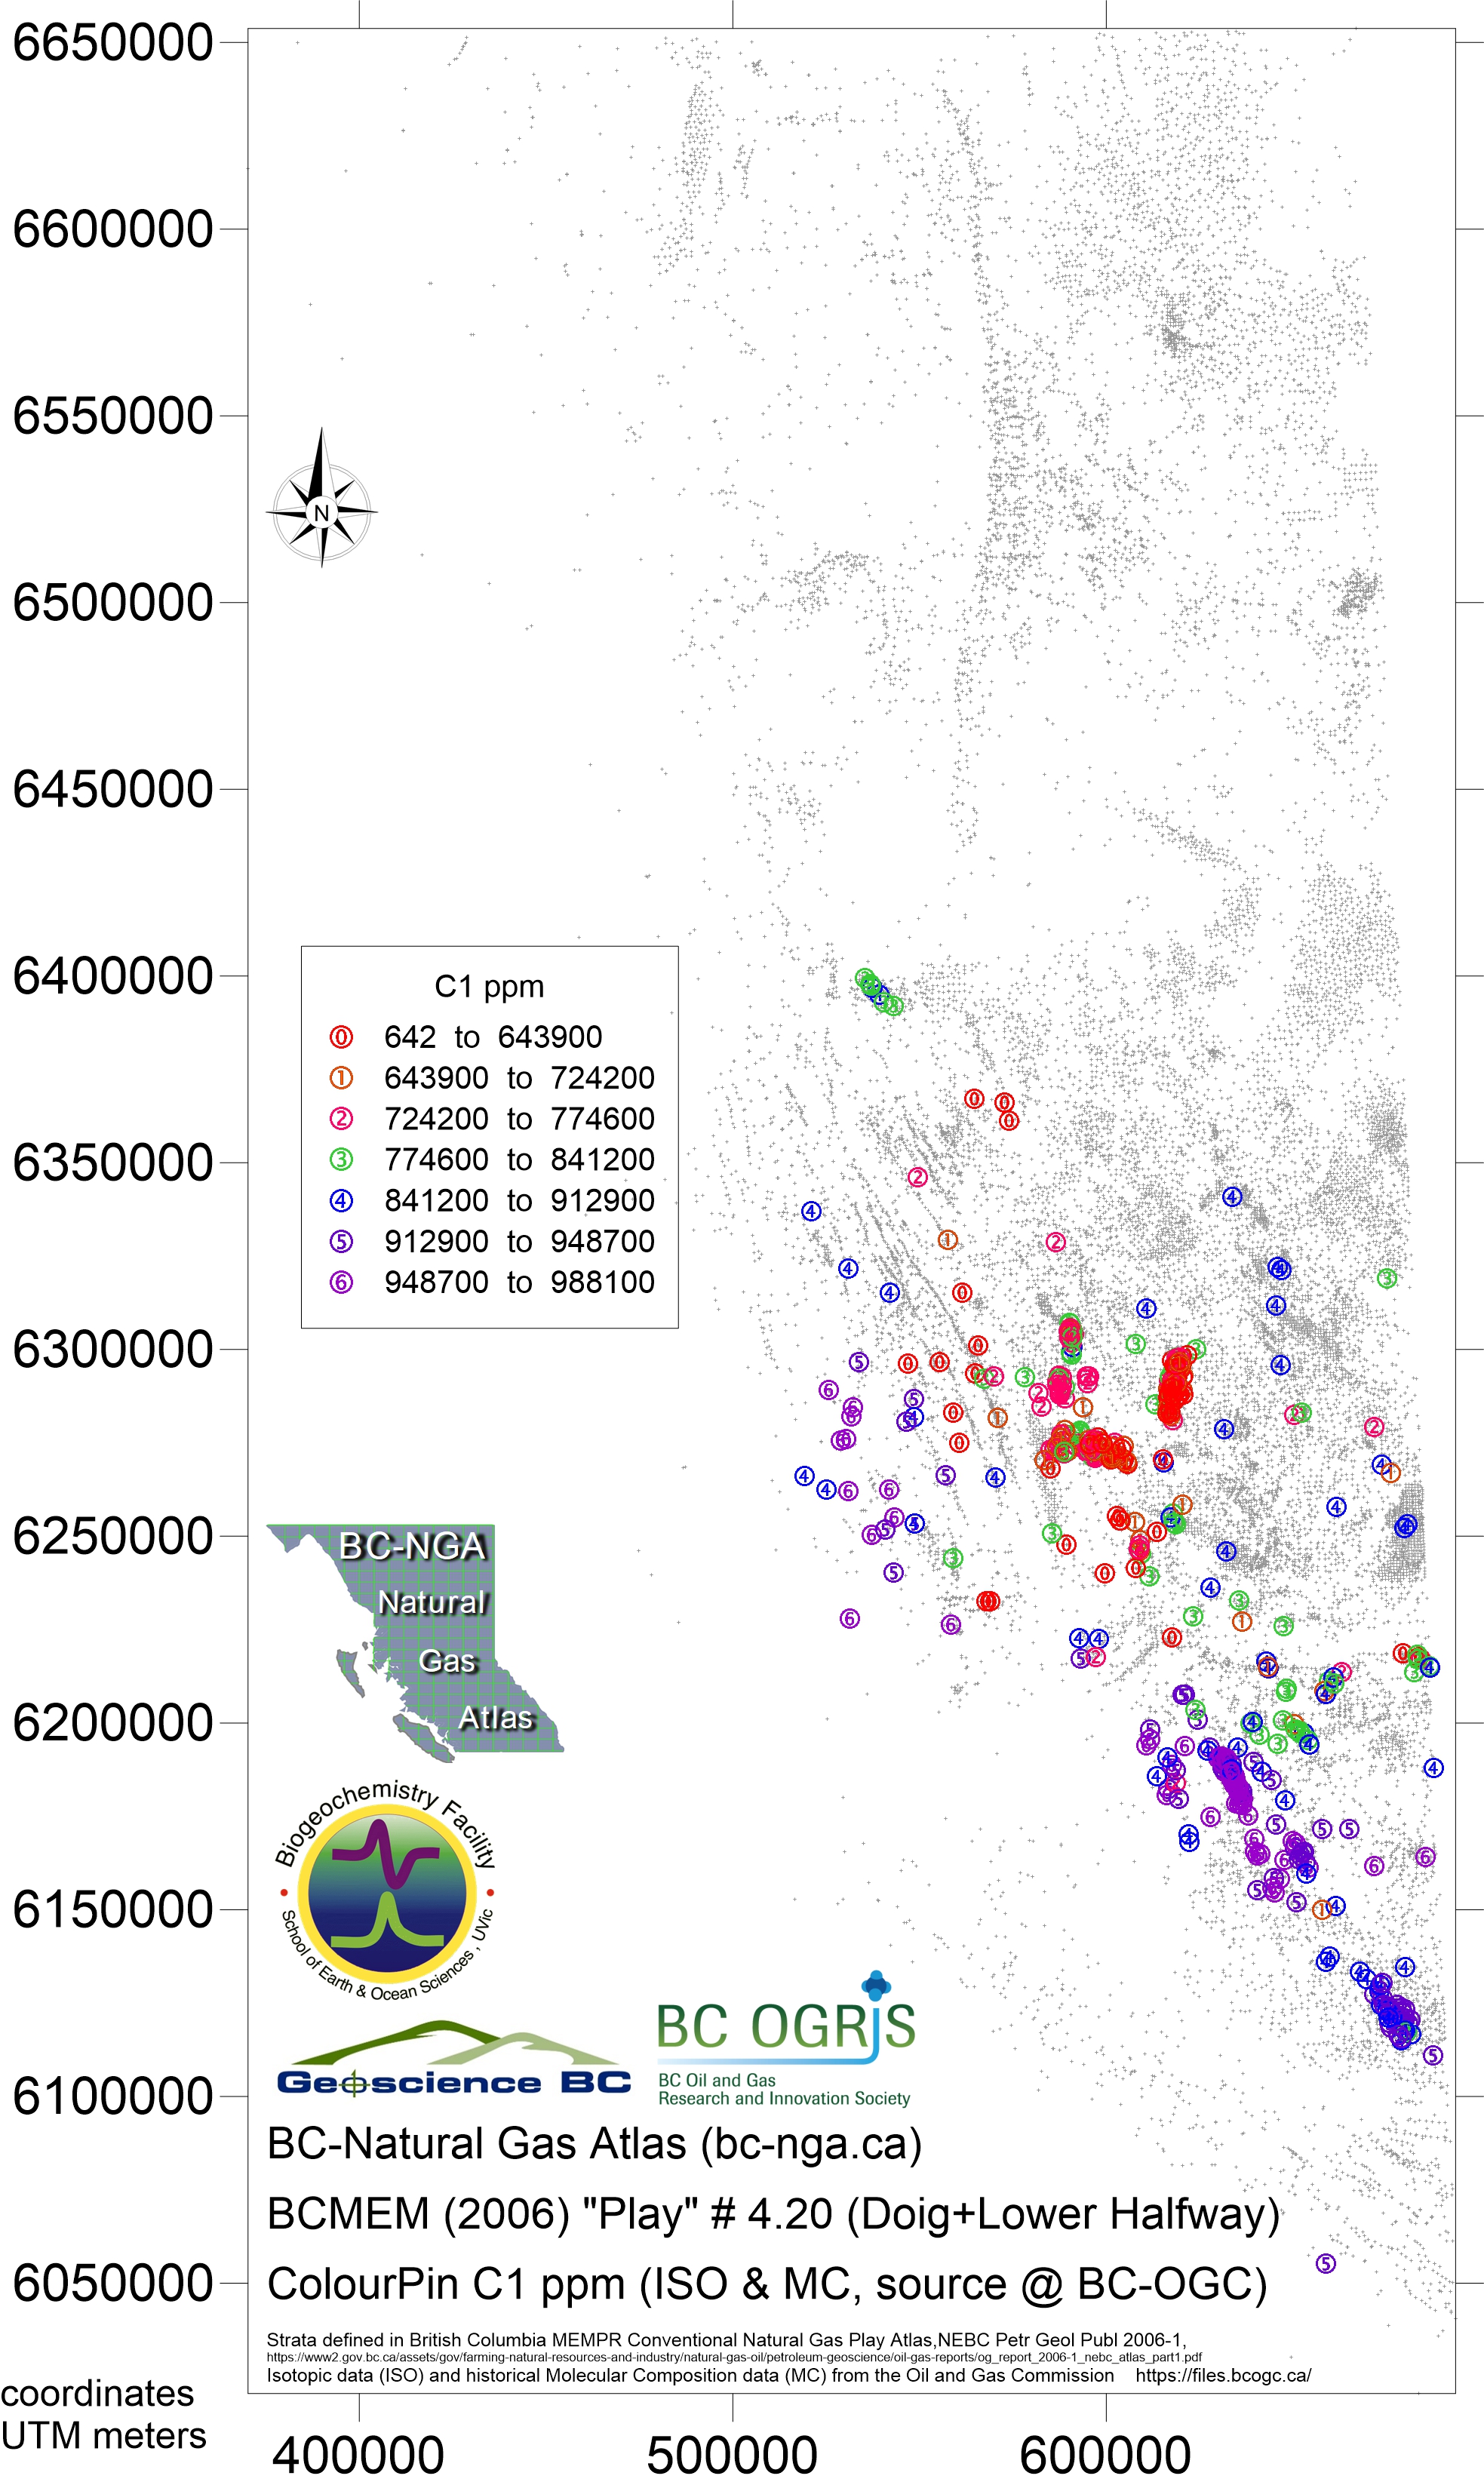
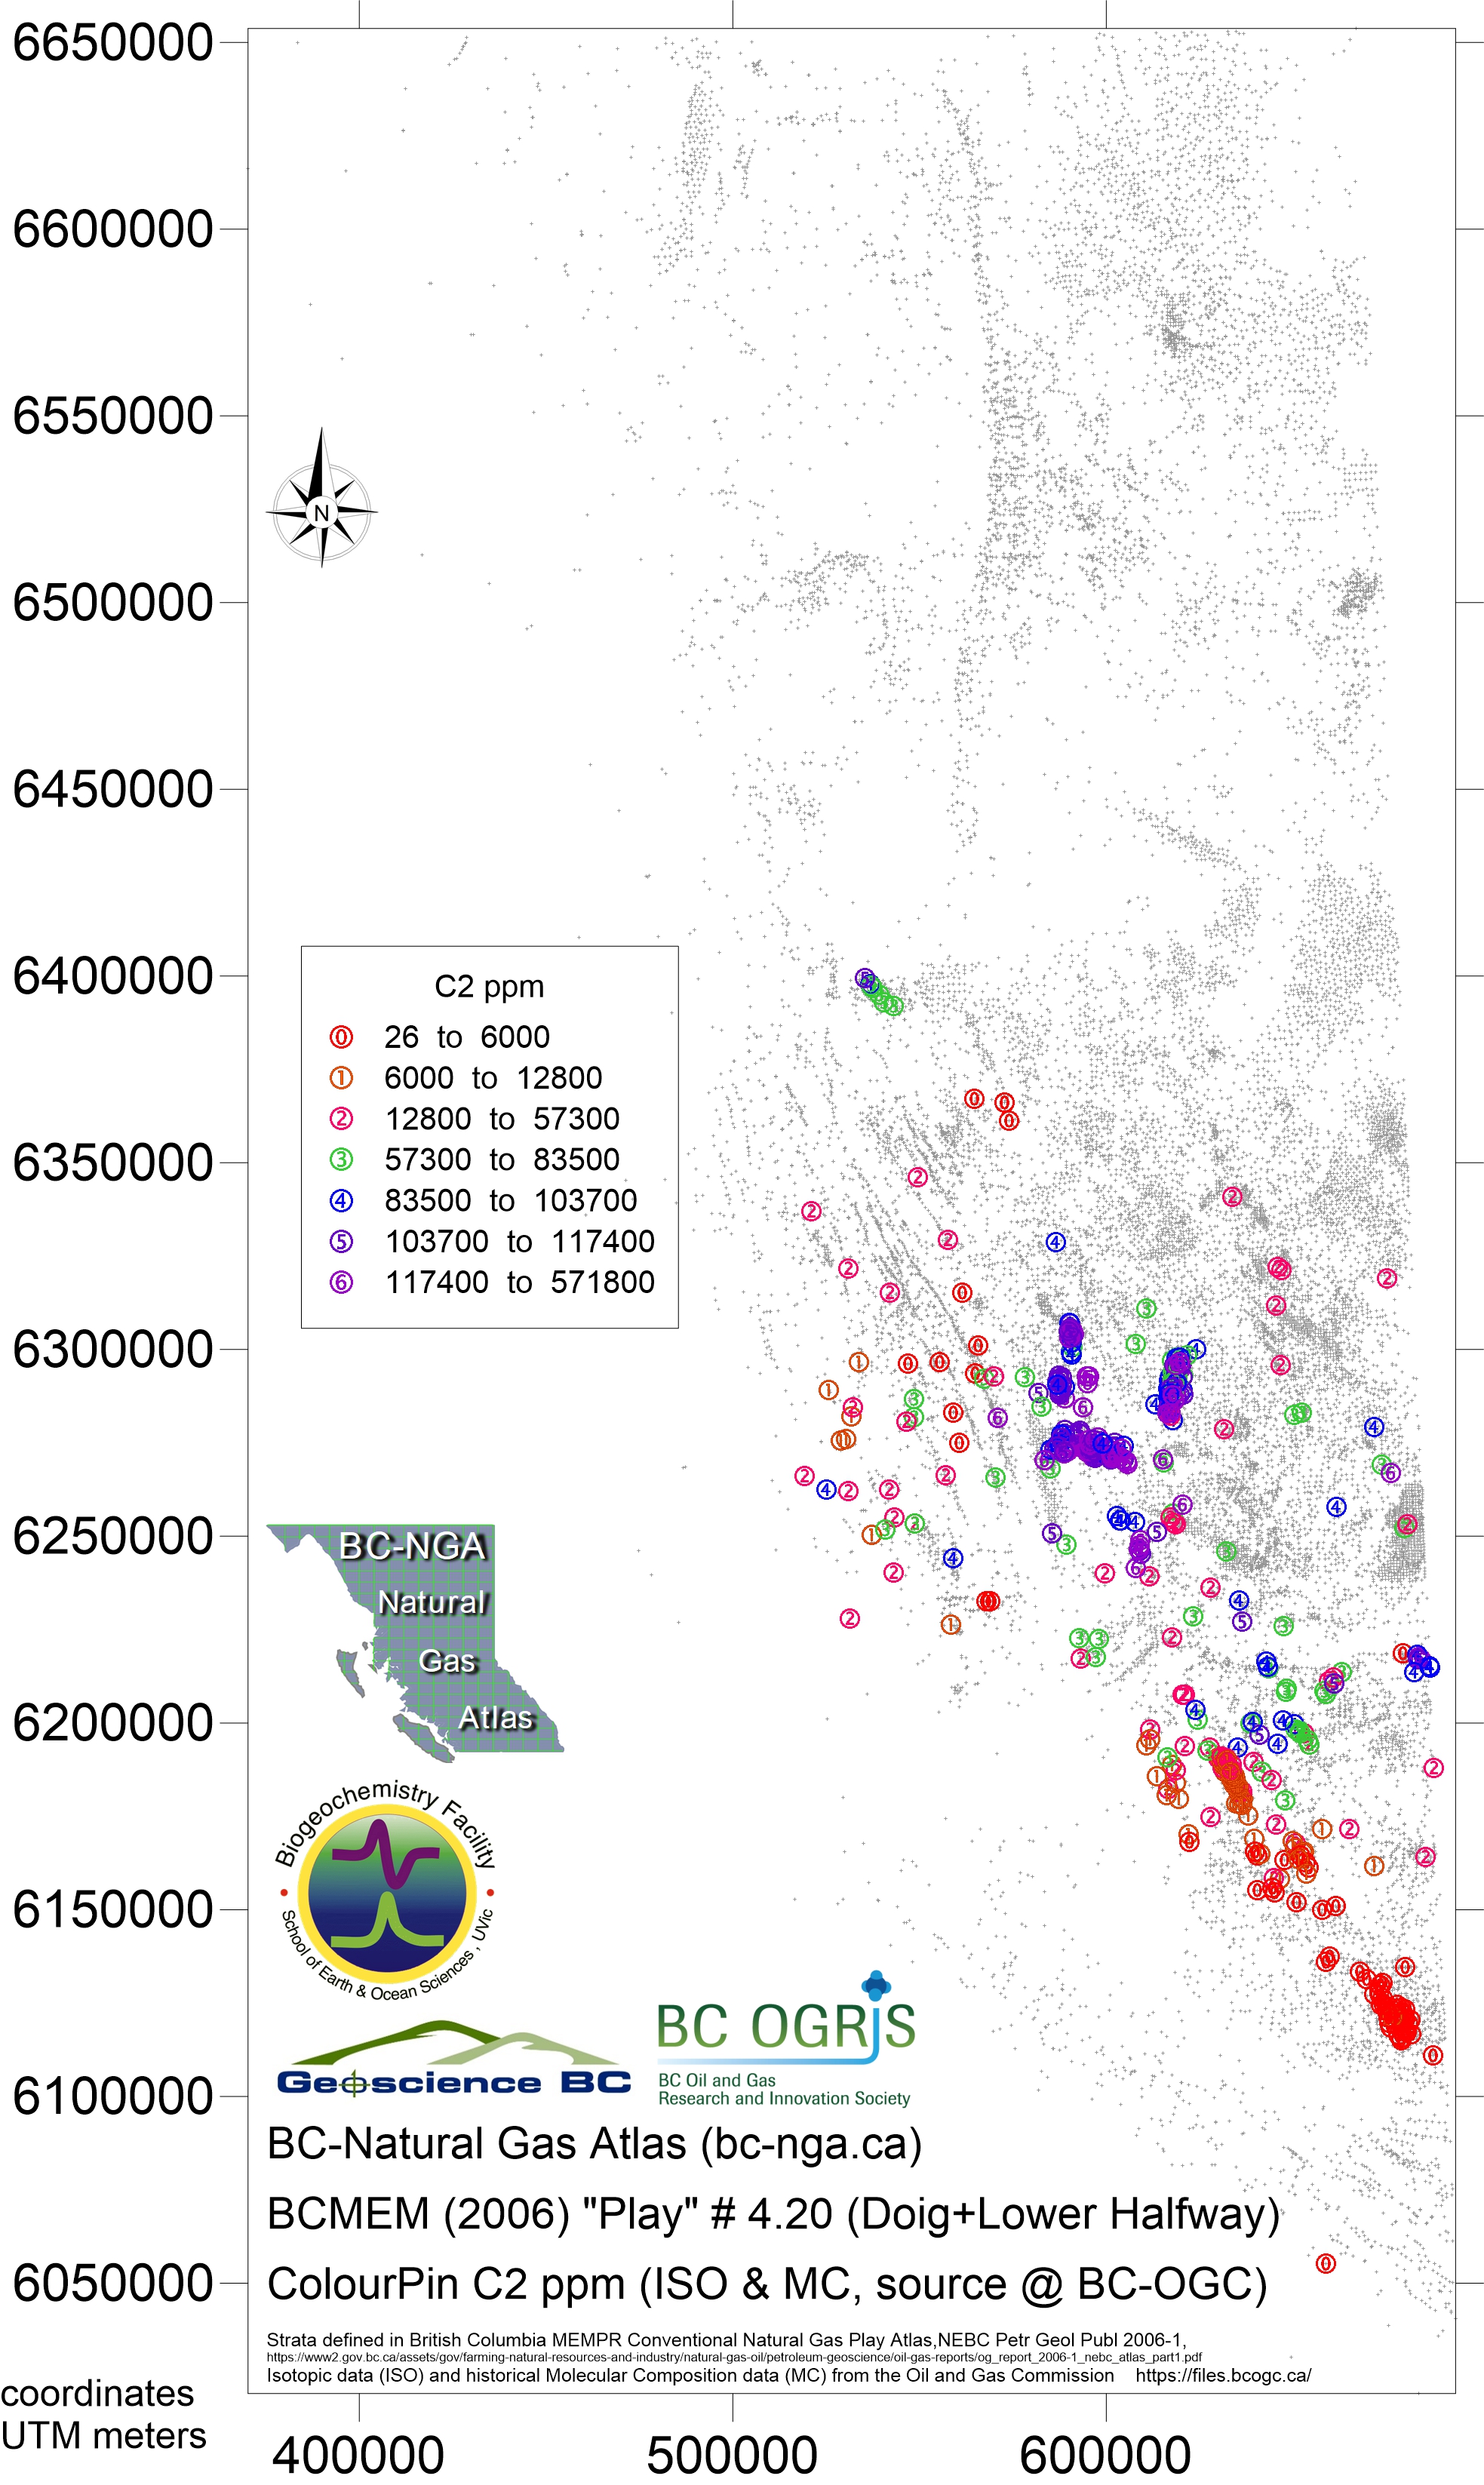
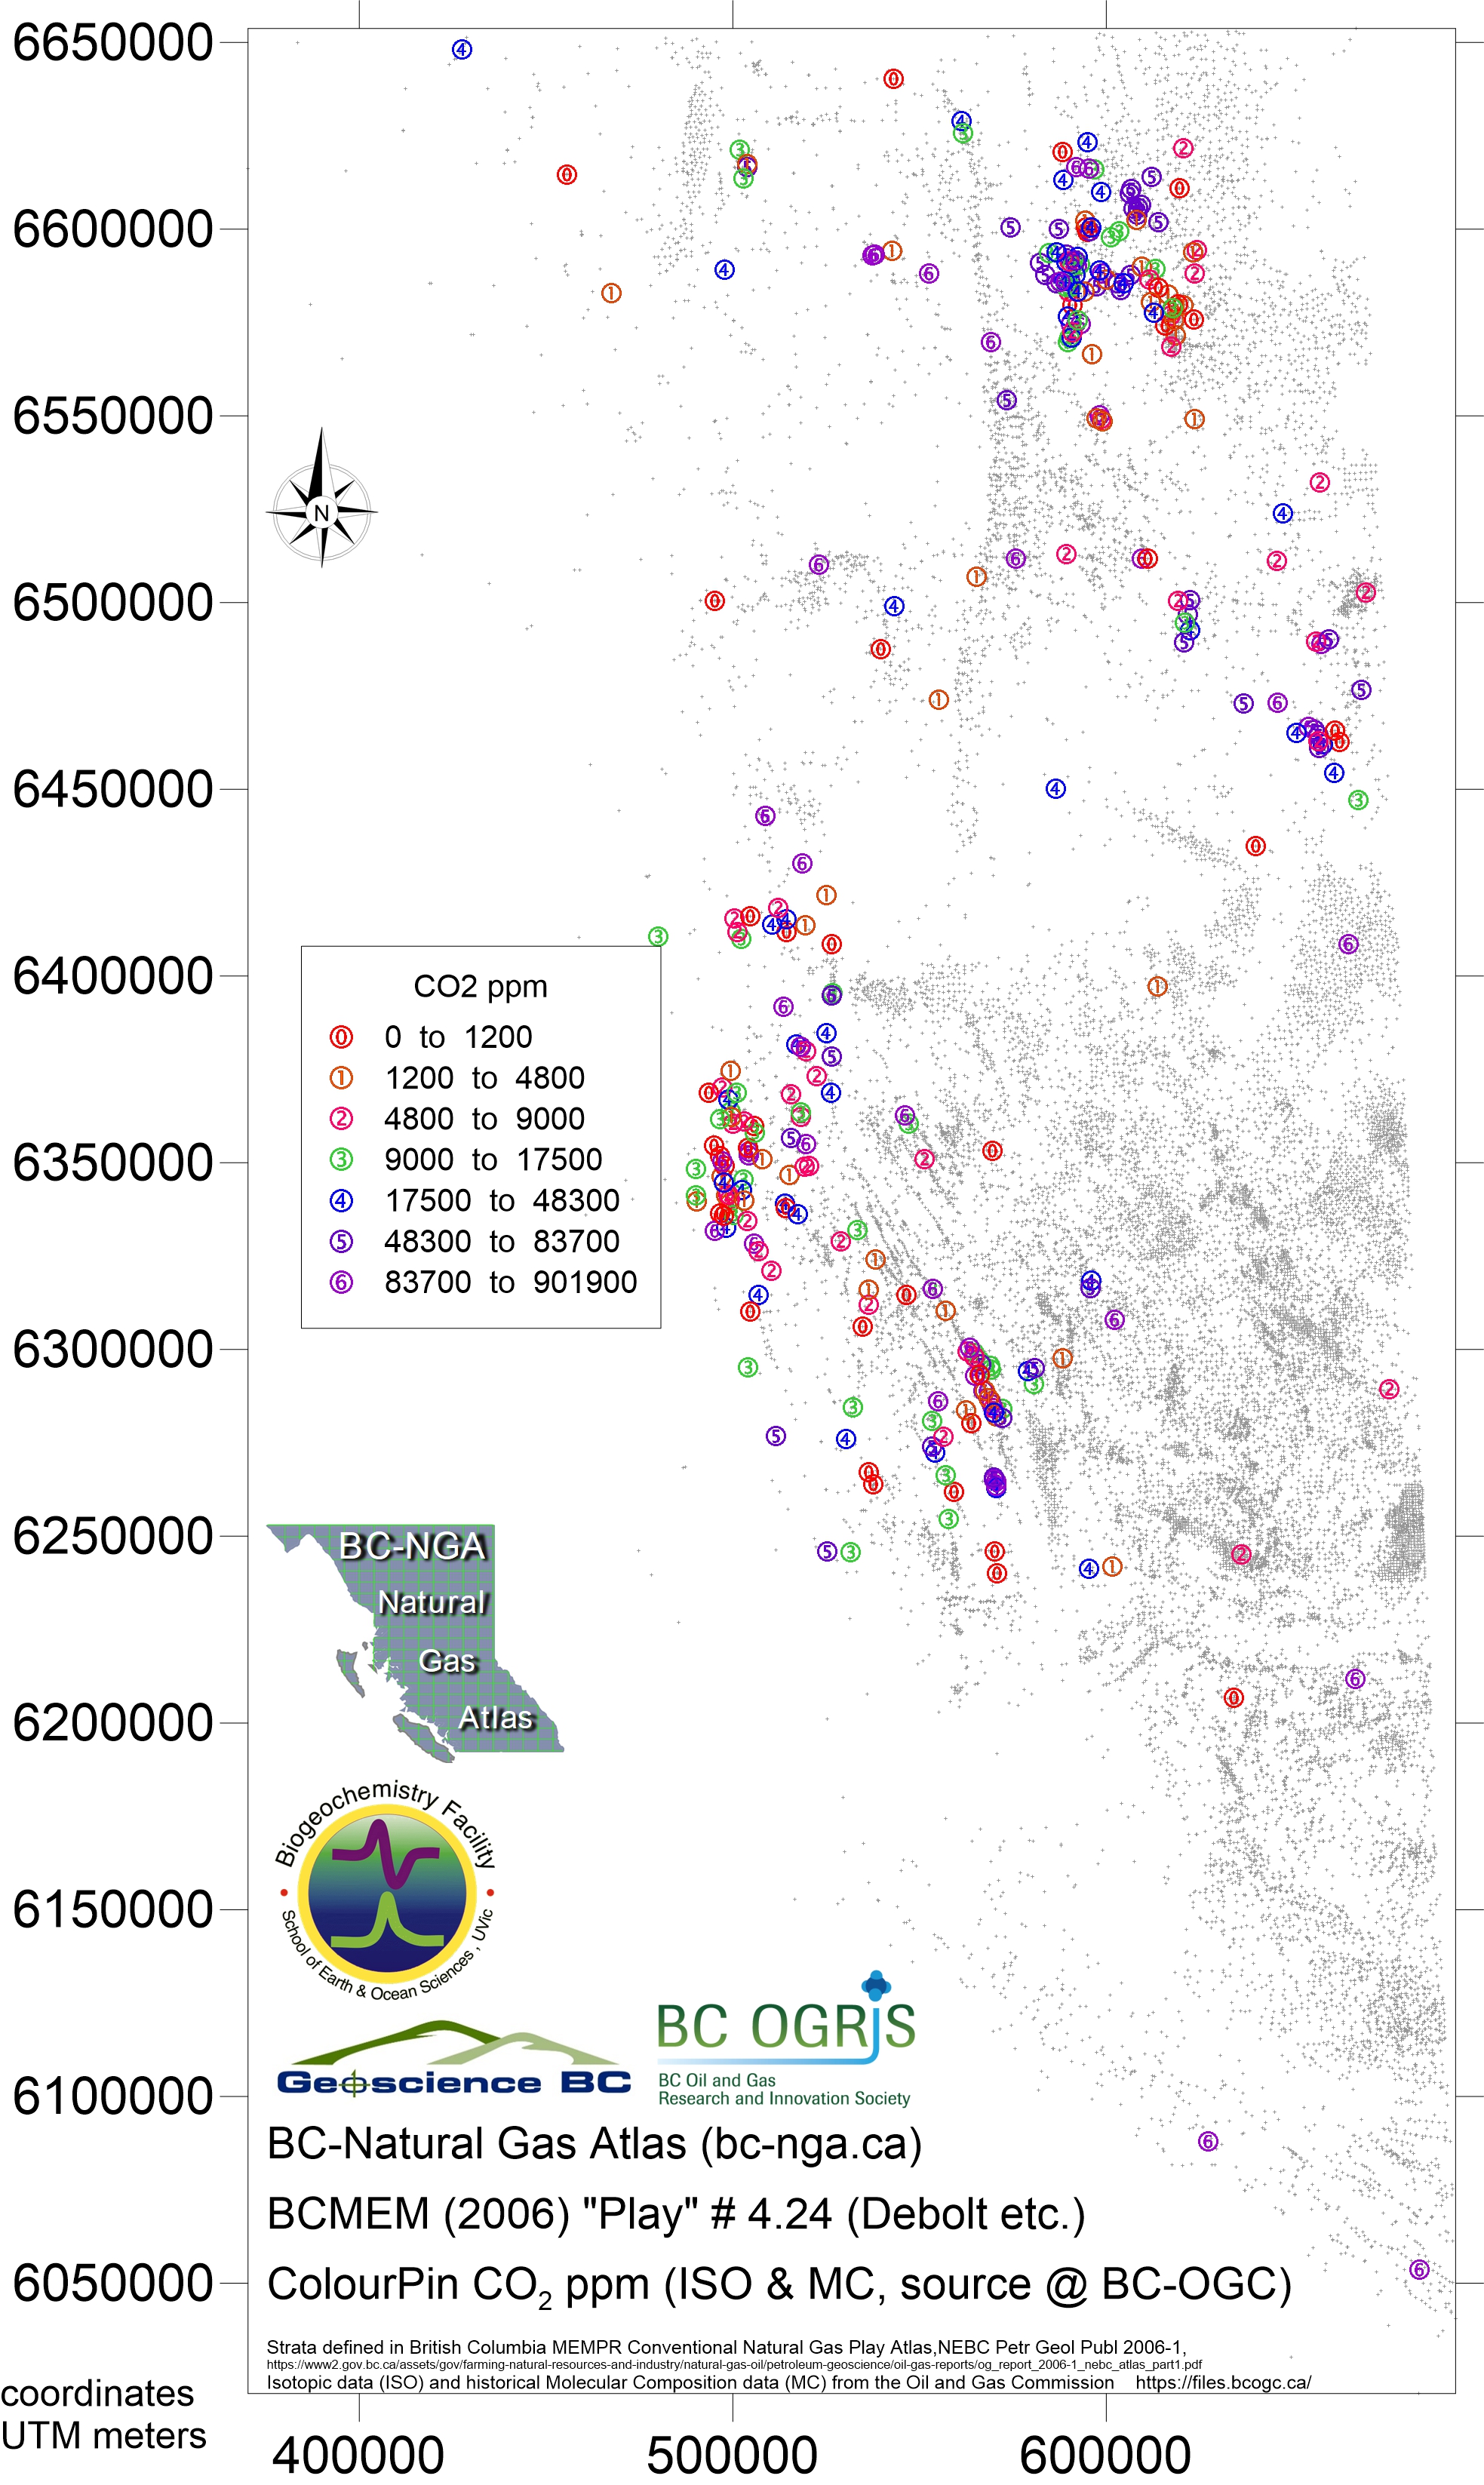
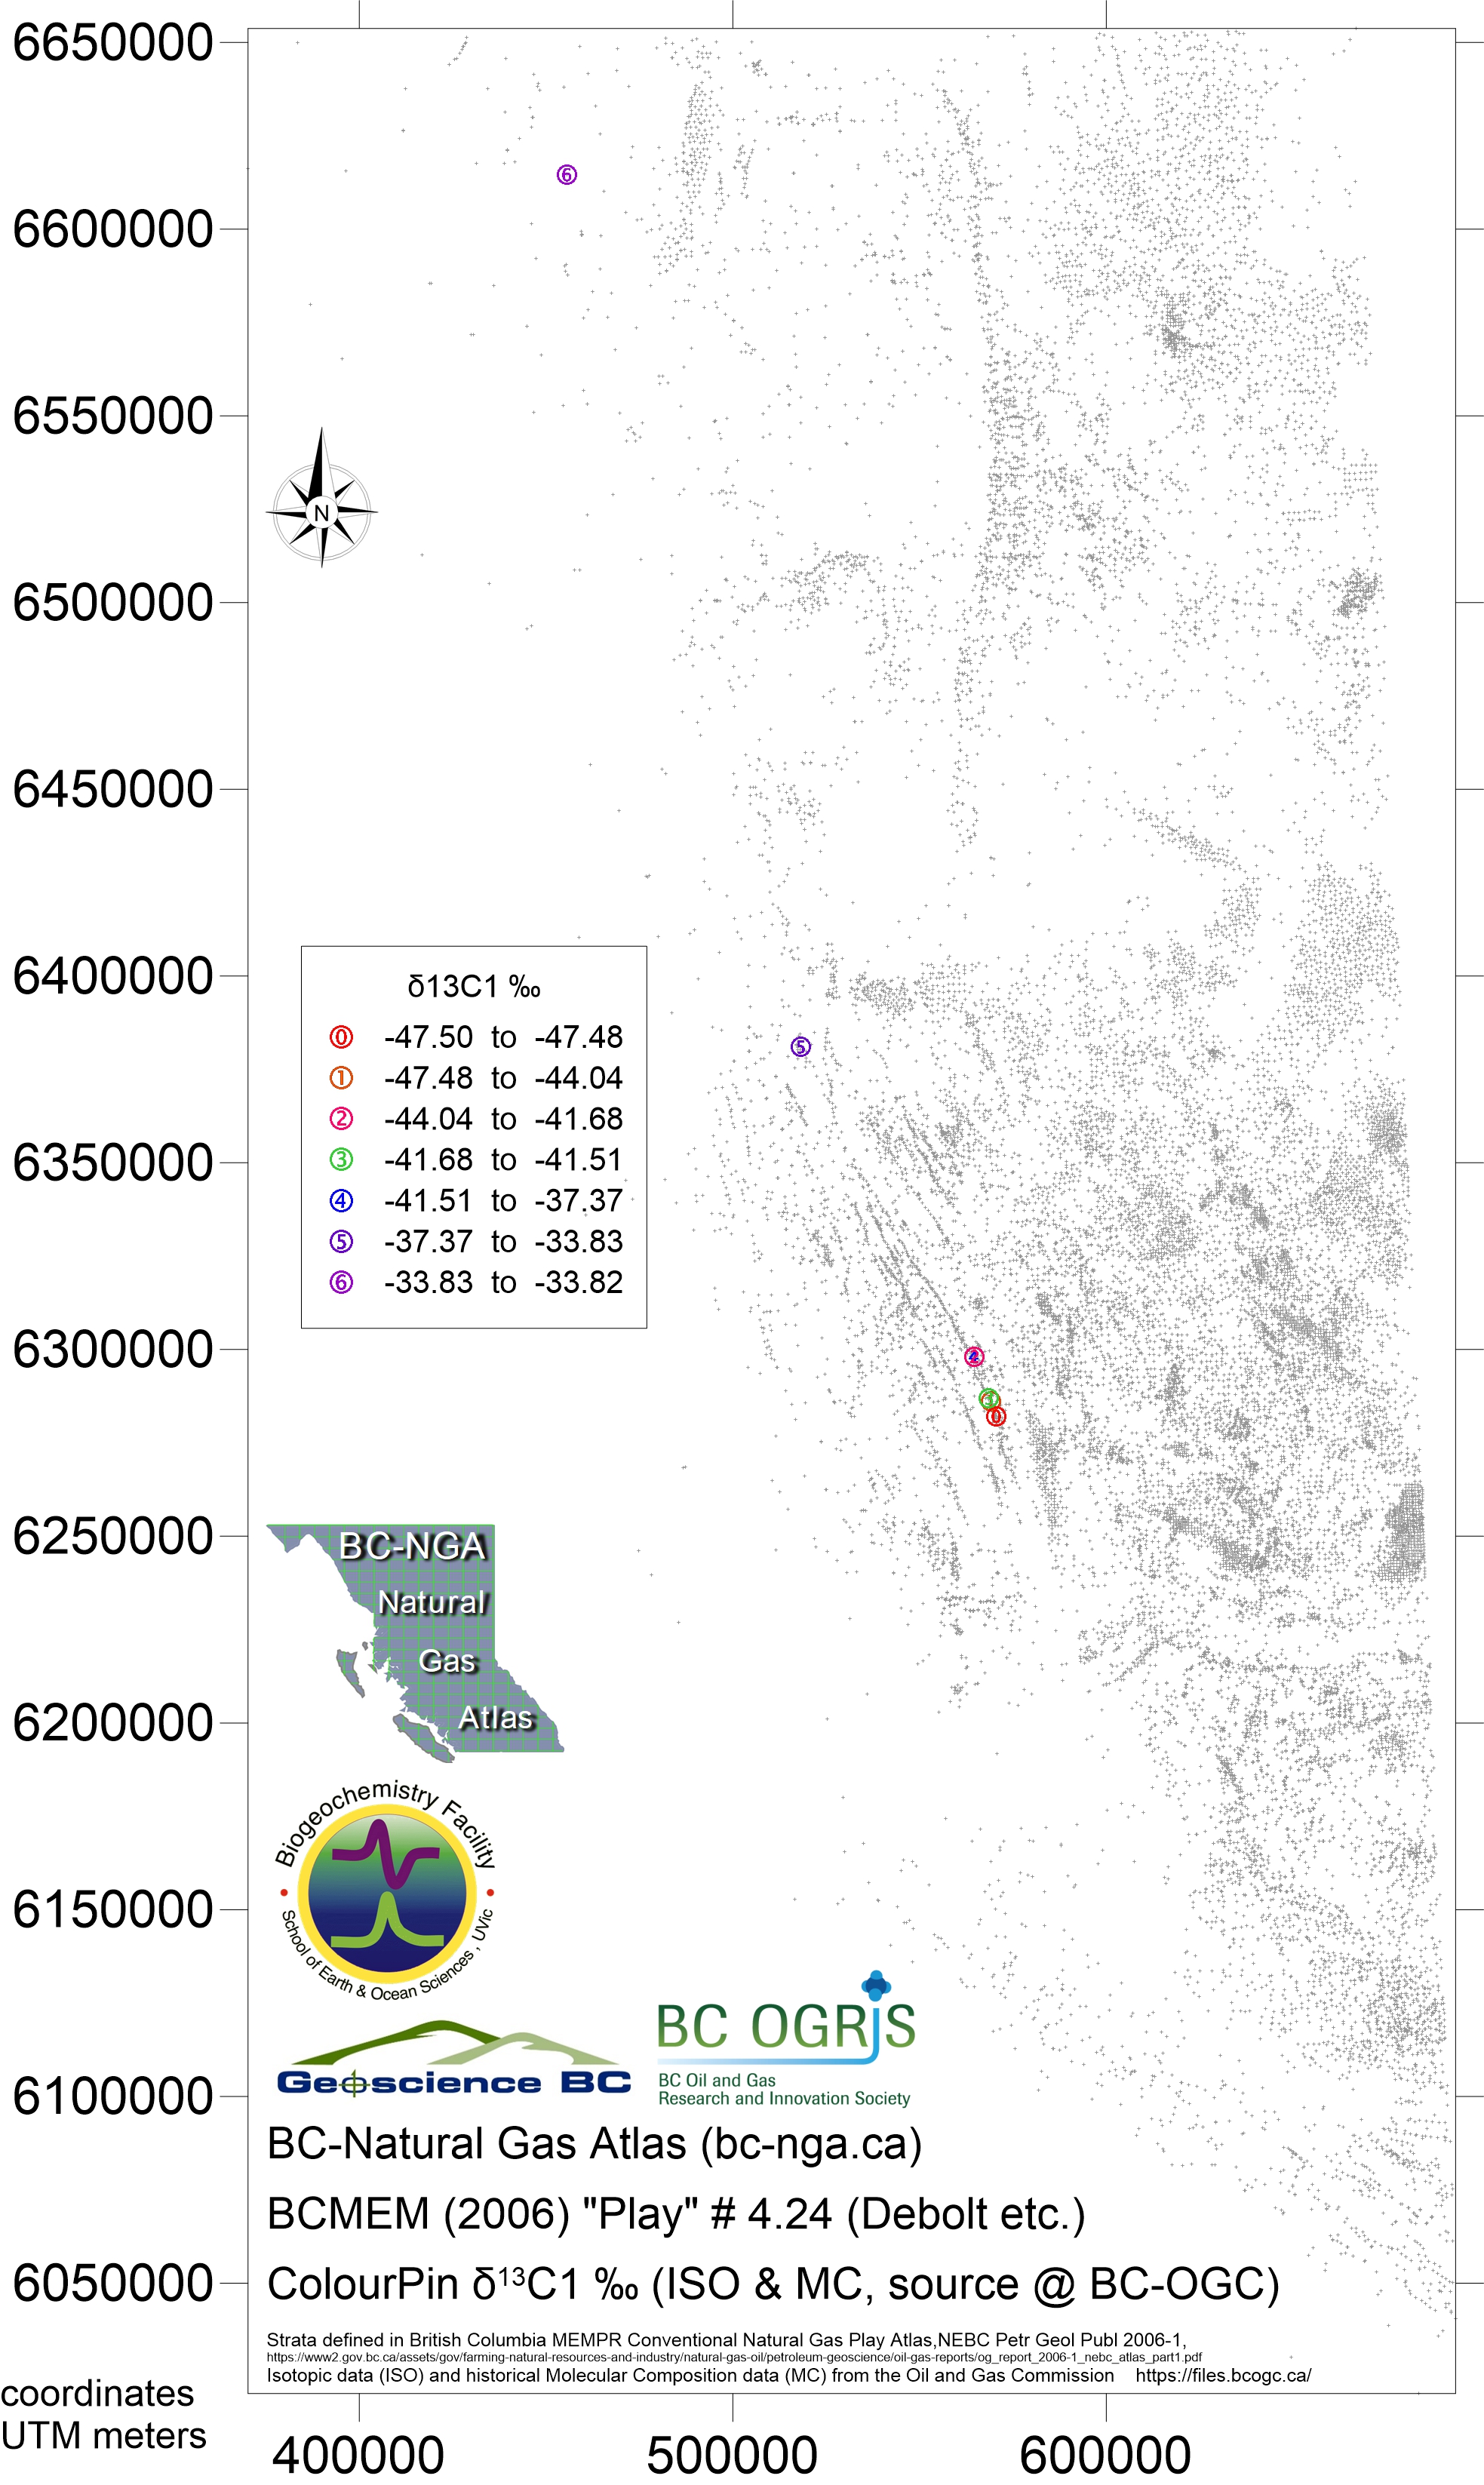
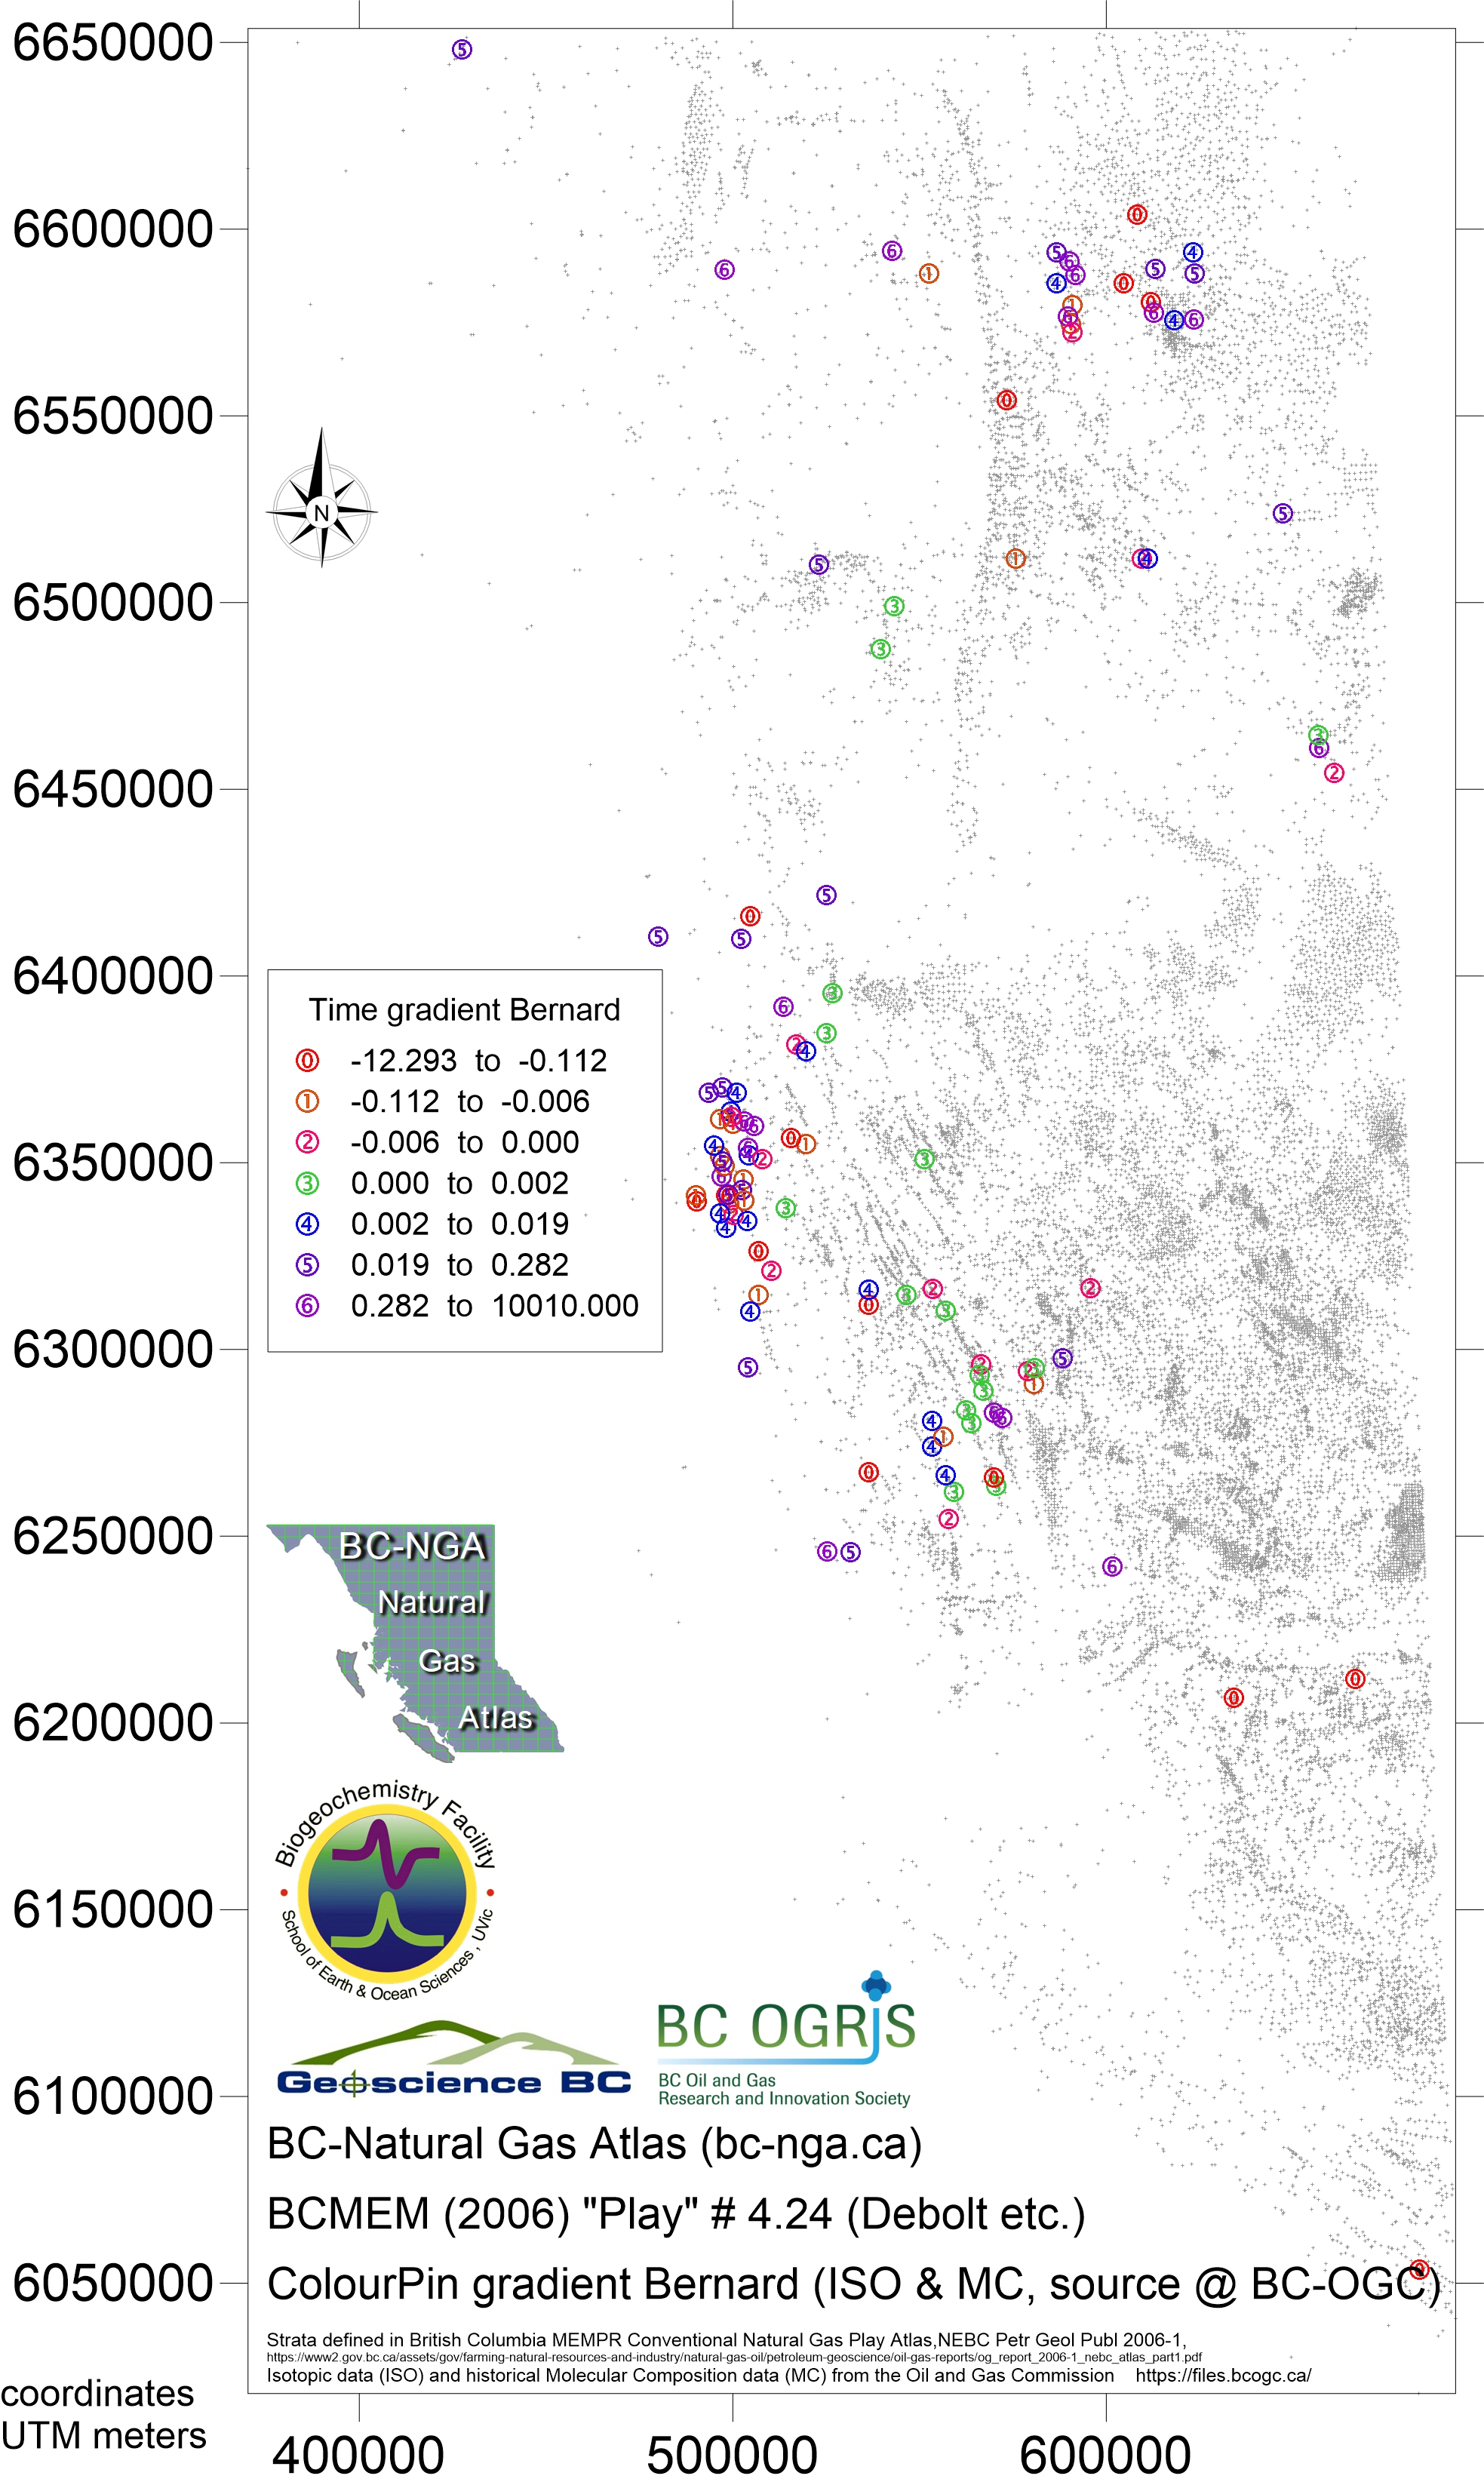
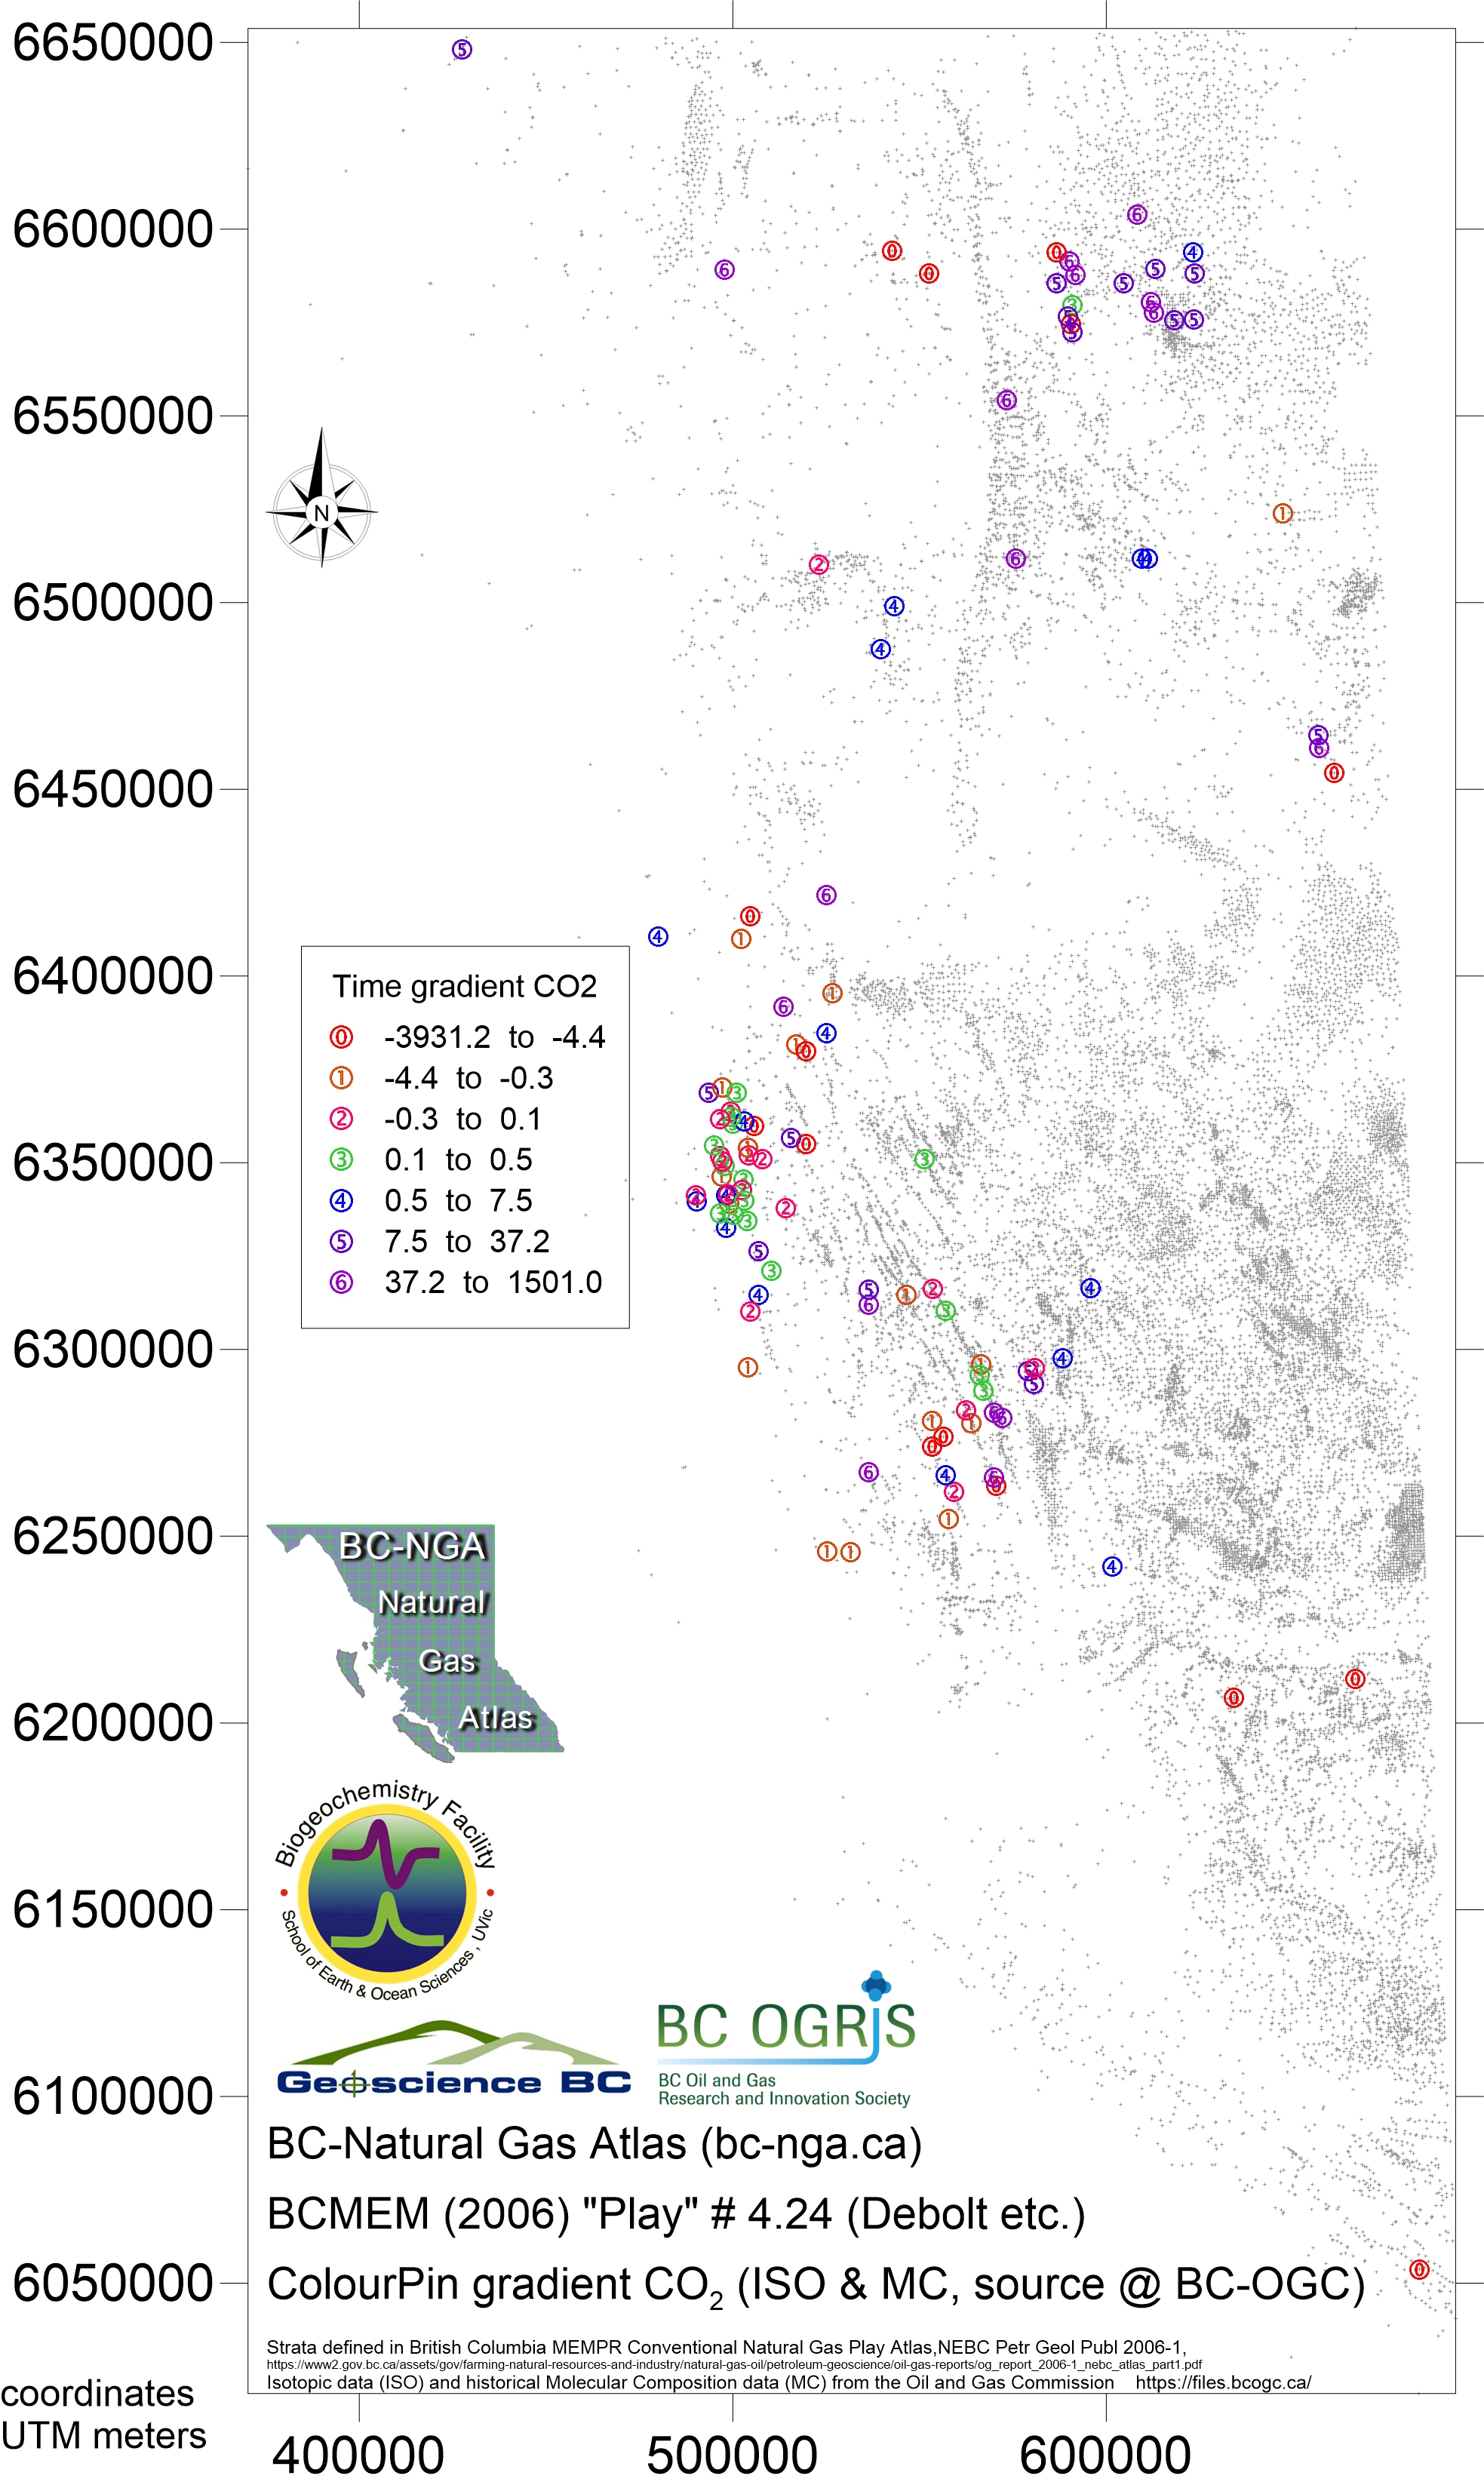
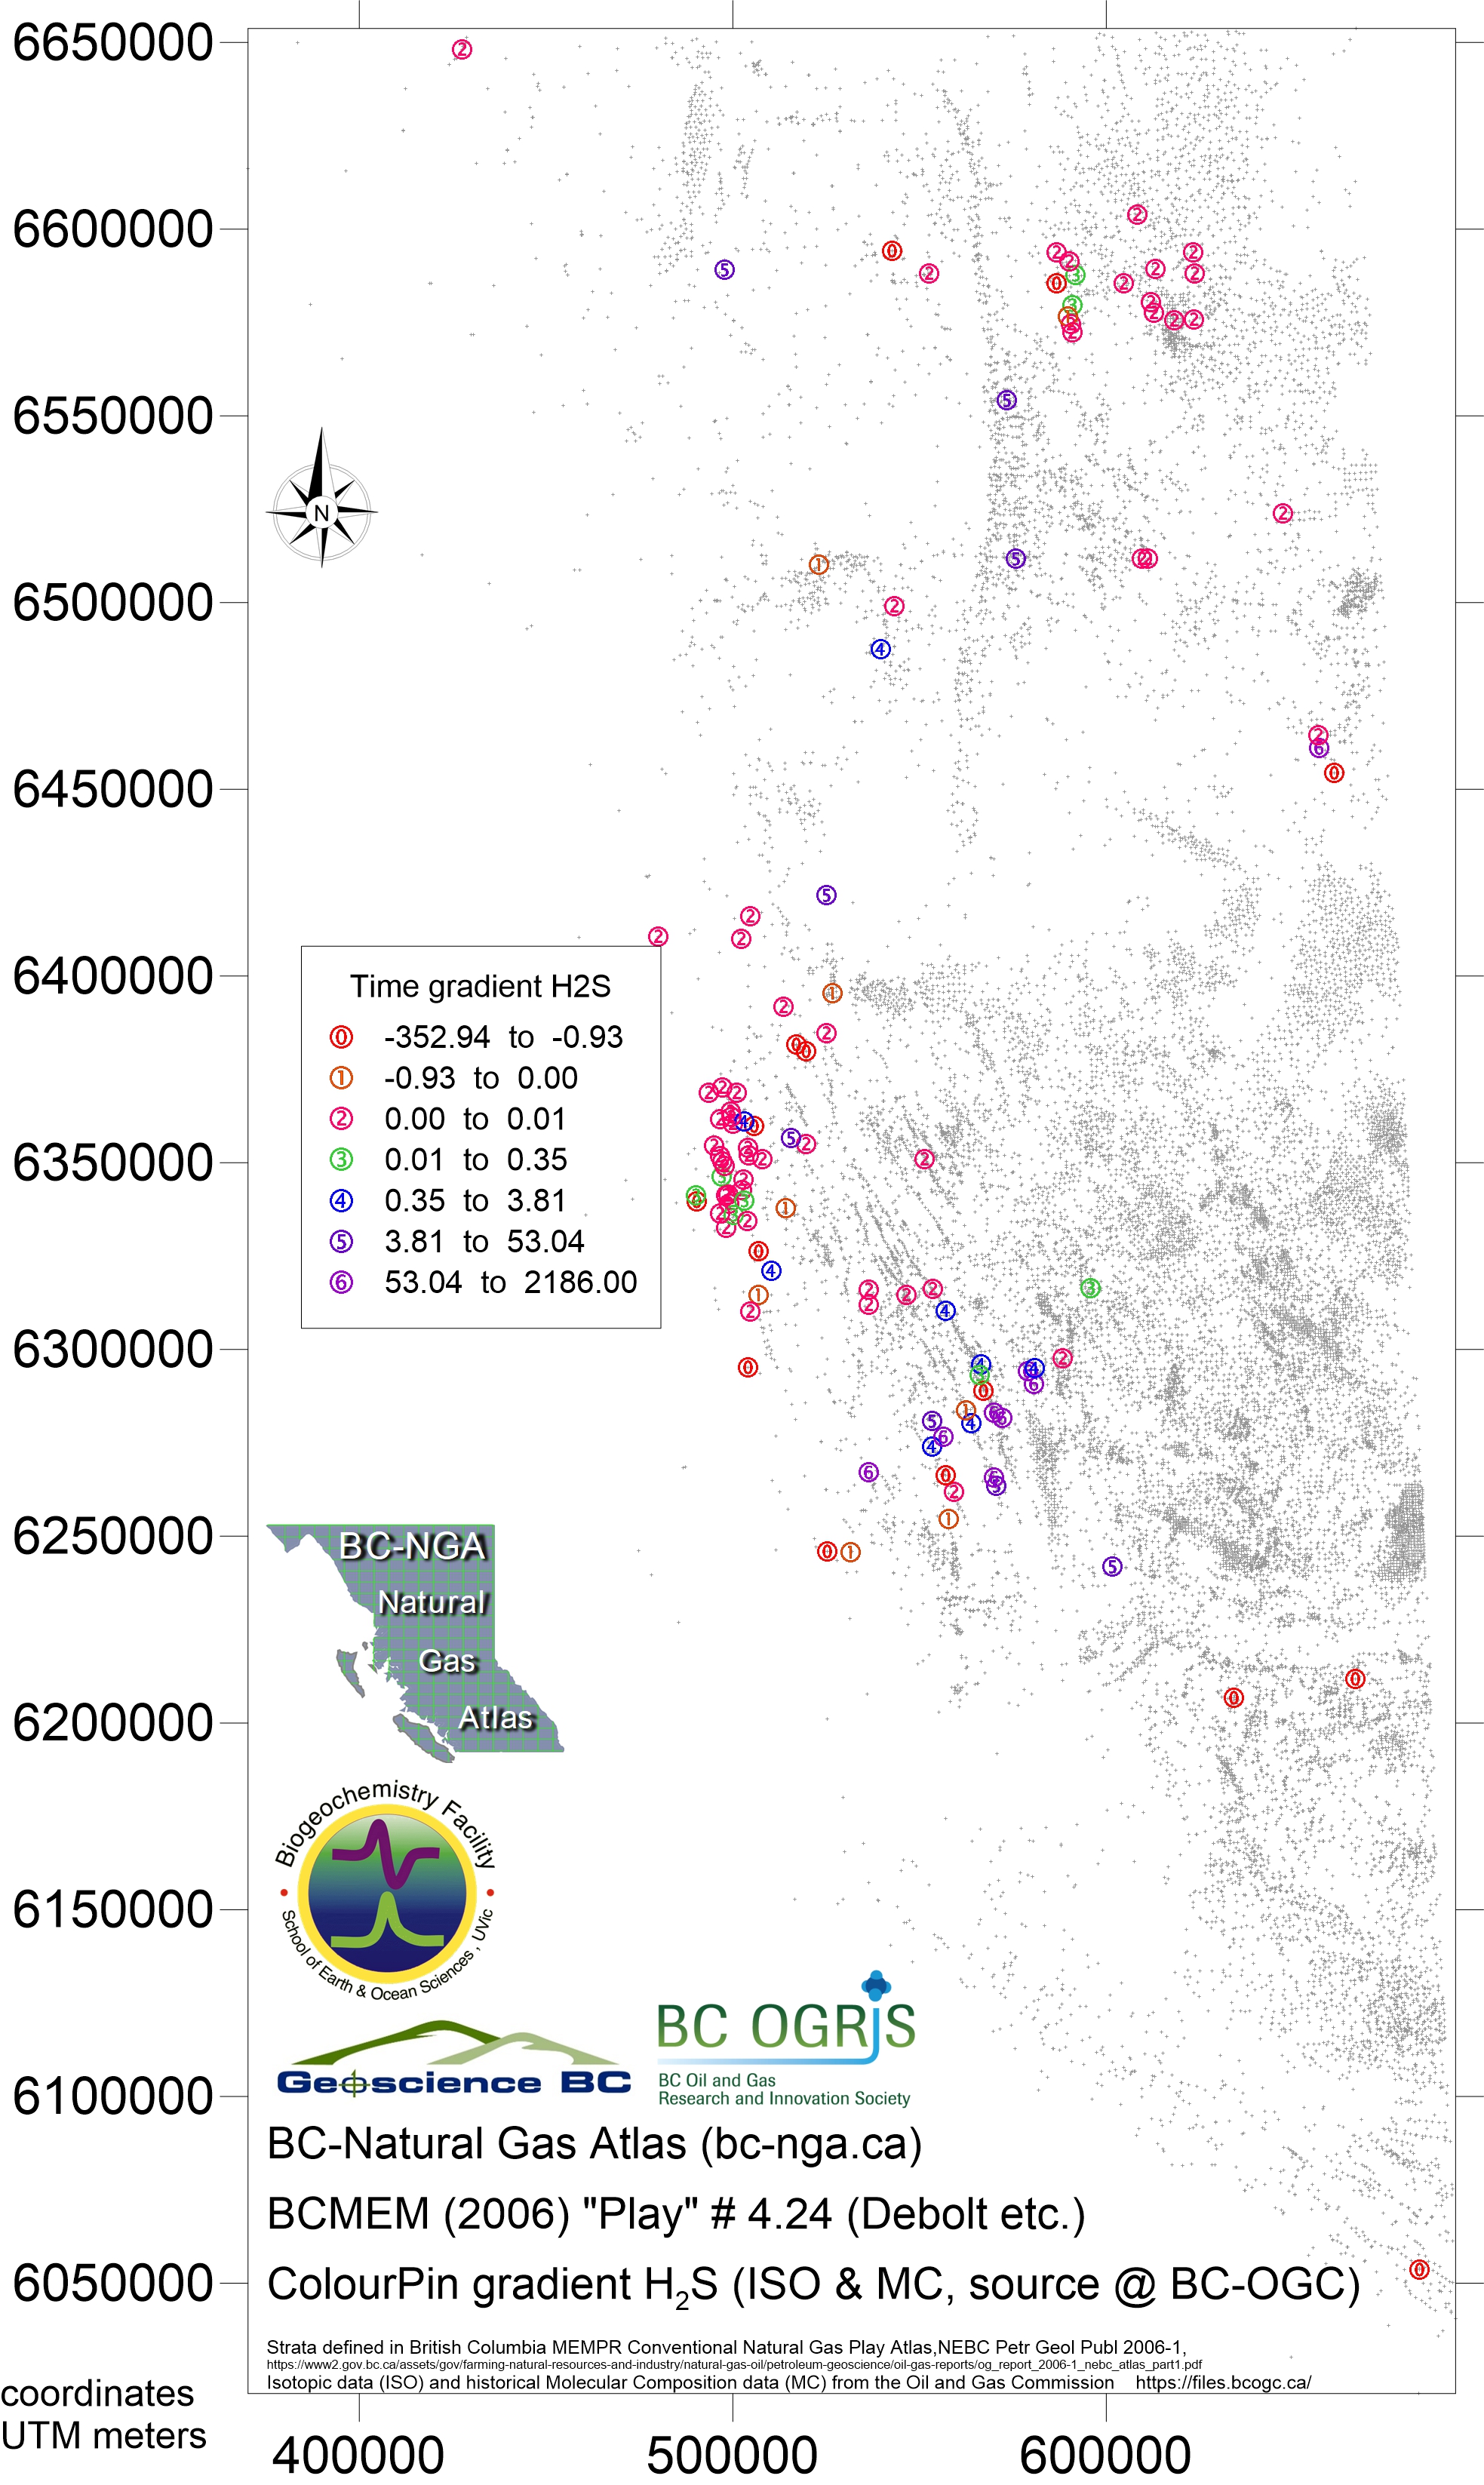
The maps were generated using basic kriging with a spherical algorithm and a Gaussian variogram. Declustering was done manually based on the data analysis. Many well test intervals have two or three gas analysis samples for molecular composition only. These samples are often inadequate to create a production profile and the geographic location is exactly the same. This creates estimation problems for the kriging algorithm and declustering is required. If all samples from a well test interval were flagged equally, only the first sample is used in mapping. If the first sample is problematic as identified in the flagging, the second or third sample is chosen. This declustering also applies to gas analysis from multiple legs on a single drilling pad, but instead of the first sample (usually the motherbore of a horizontal well), the horizontal leg with the longest reach and most frequent testing is used for mapping.
The maps should be viewed within the context of the previously referenced thesis and interpreative diagrams. This listing functions only within the structure of the Results page which should be read first.
Play 4.00 “Surface”
- Map001 Nov 2018 play 4.00 "surface gas" Bernard ratio
- Map002 Nov 2018 play 4.00 "surface gas" dryness ratio
- Map003 Nov 2018 play 4.00 "surface gas" iC4nC4 ratio
- Map004 Nov 2018 play 4.00 "surface gas" ISOratio Map005 Nov 2018 play 4.00 "surface gas" H2S not used error
- Map006 Nov 2018 play 4.00 "surface gas" δ13CH4
- Map007 Nov 2018 play 4.00 "surface gas" Cδ2H4
- Map008 Nov 2018 play 4.00 "surface gas" δ13C2H6
- Map009 Nov 2018 play 4.00 "surface gas" δ13C3H8
- Map010 Nov 2018 play 4.00 "surface gas" δ13C4H10
Plays above 4.06 Dunvegan Formation and equivalents
Play 4.06 Dunvegan Formation and equivalents
- Map011 Nov 2018 play 4.06 Dunvegan eqv Bernard ratio
- Map012 Nov 2018 play 4.06 Dunvegan eqv dryness ratio
- Map013 Nov 2018 play 4.06 Dunvegan eqv iC4nC4 ratio
- Map015 Nov 2018 play 4.06 Dunvegan eqv CH4 ppm
- Map016 Nov 2018 play 4.06 Dunvegan eqv C2H6 ppm
- Map017 Nov 2018 play 4.06 Dunvegan eqv C3H8 ppm
- Map018 Nov 2018 play 4.06 Dunvegan eqv iC4H10 ppm
- Map019 Nov 2018 play 4.06 Dunvegan eqv nC4H10 ppm
- Map020 Nov 2018 play 4.06 Dunvegan eqv iC5H12 ppm
- Map021 Nov 2018 play 4.06 Dunvegan eqv nC5H12 ppm
The shallower plays in NEBC are constrained to the southern extent as the conventional reservoirs in the Atlas (MEM 2006a, b, c) do not exist in the main part of the region. The stratigraphic equivalent is the undivided Buckinghorse Formation comprising predominantly marine mudstones (see the extensive data on the well profiles in Evans 2019, Appendix A.
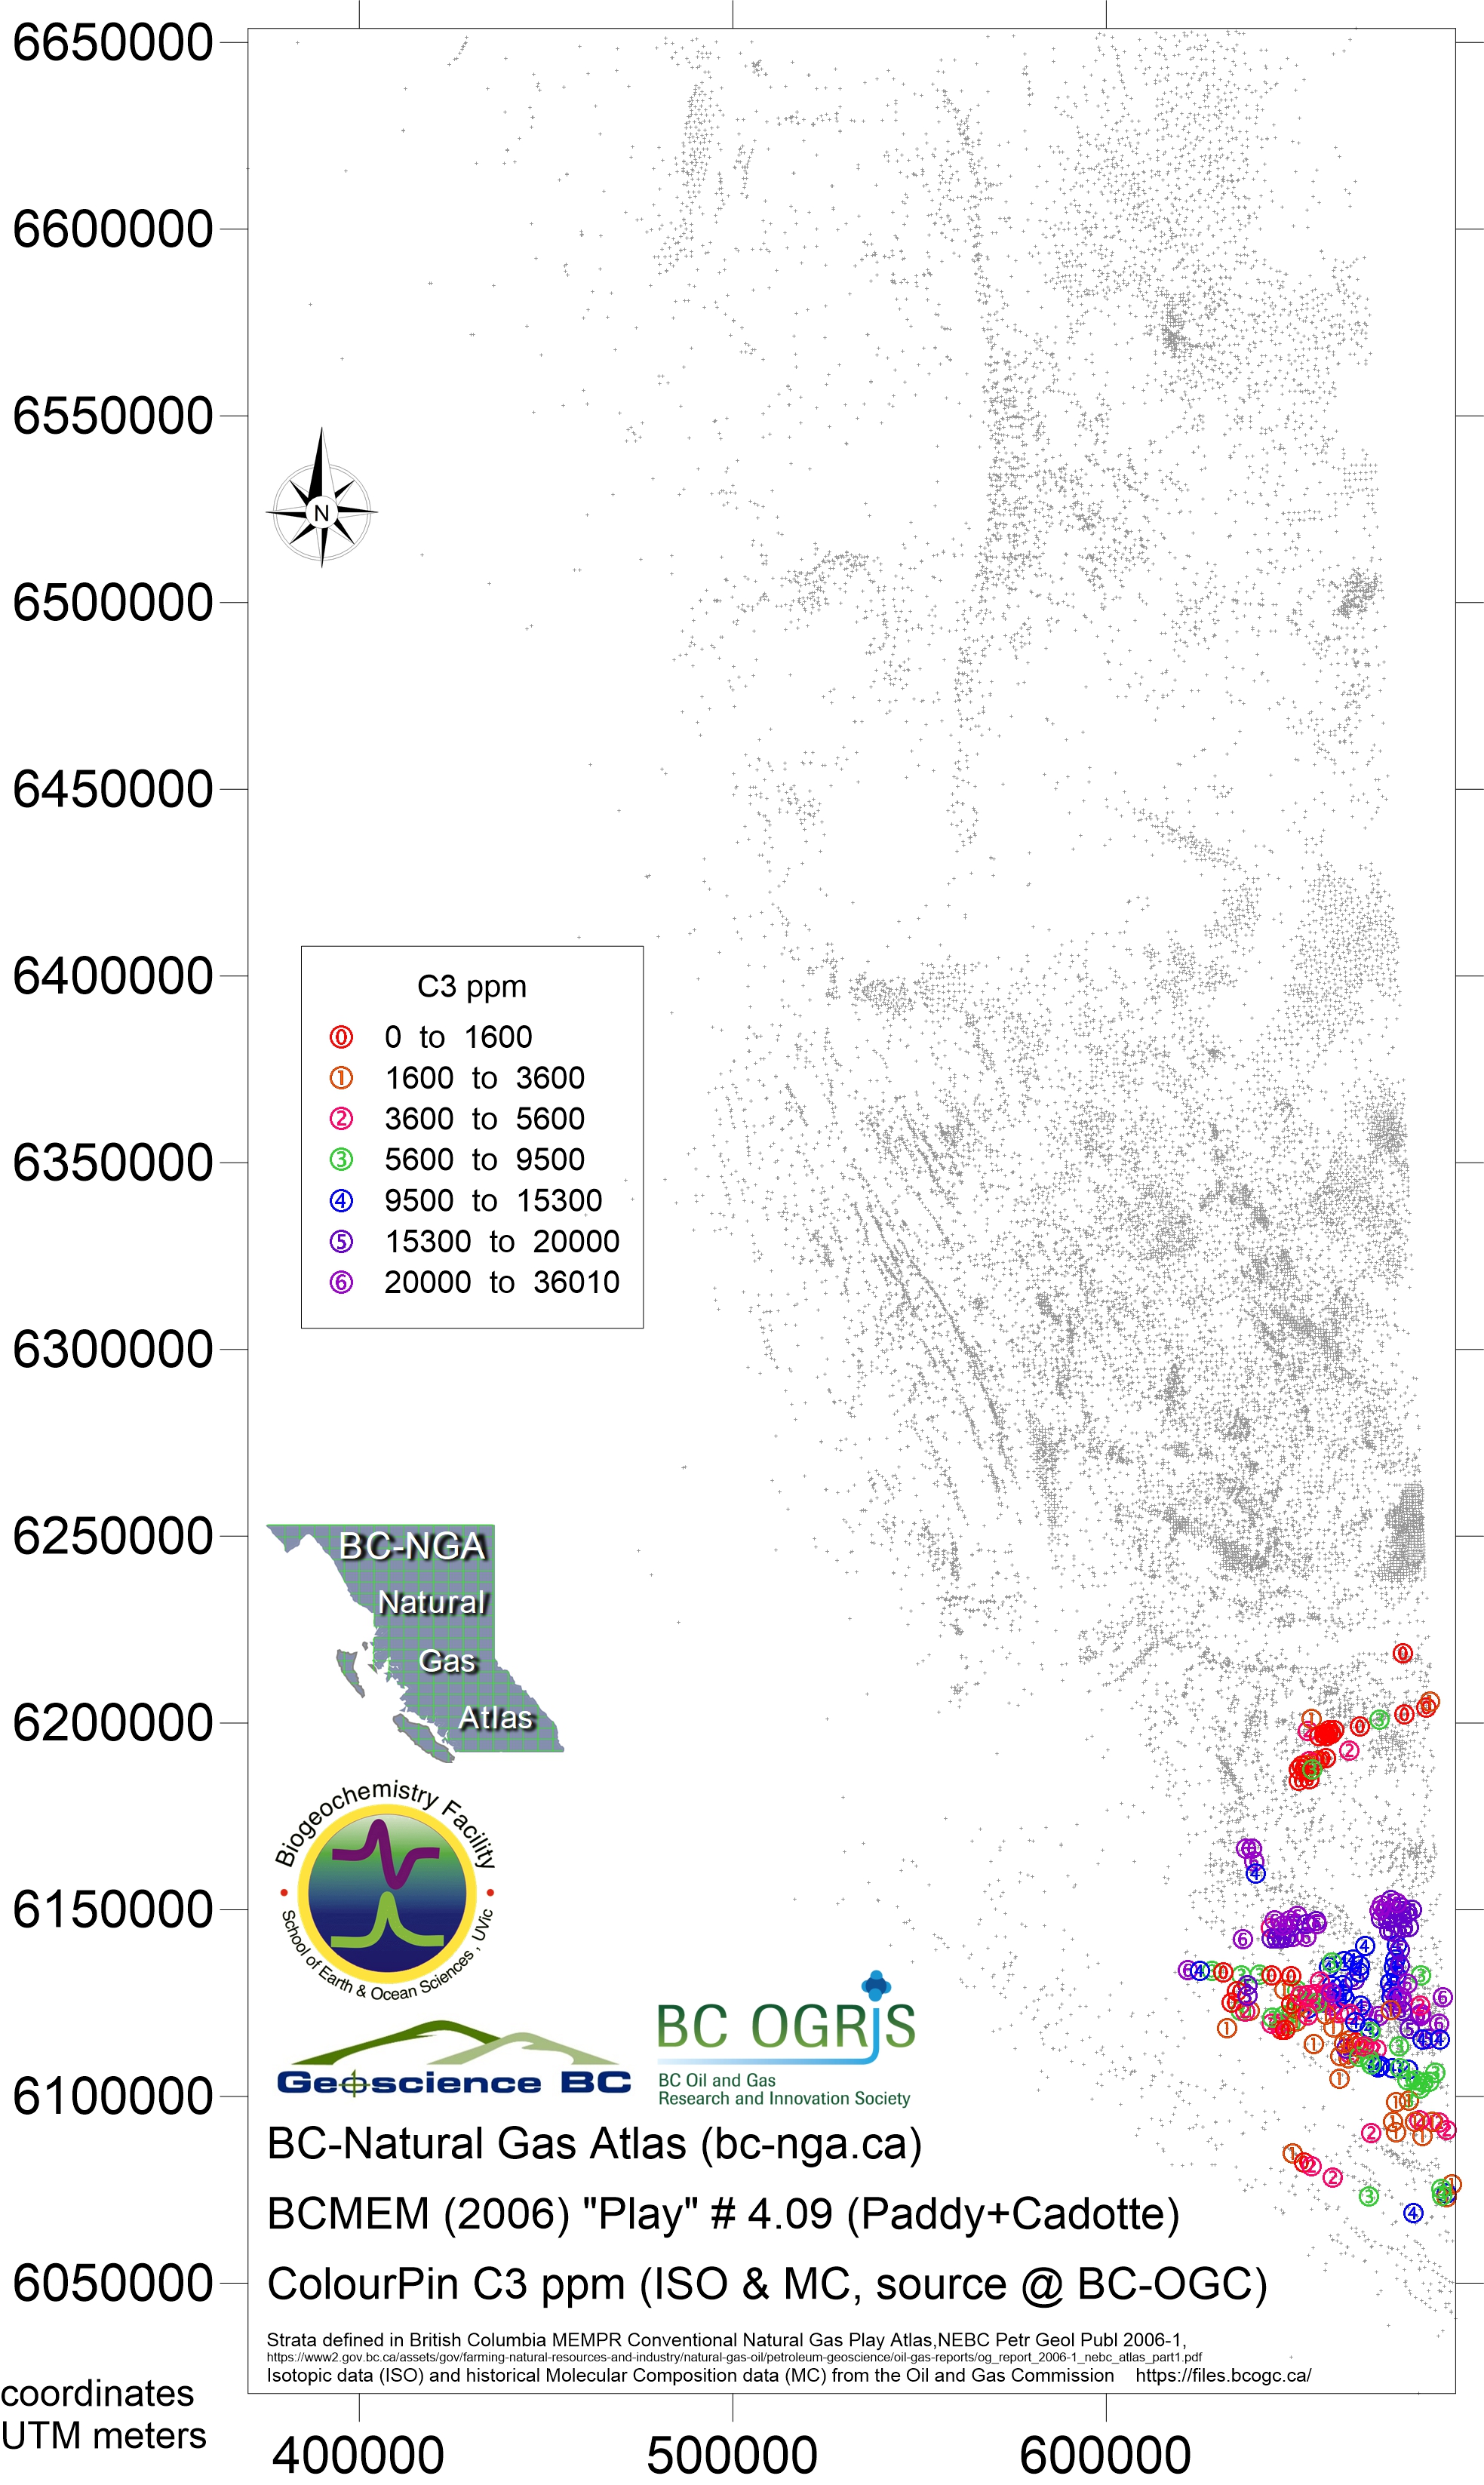
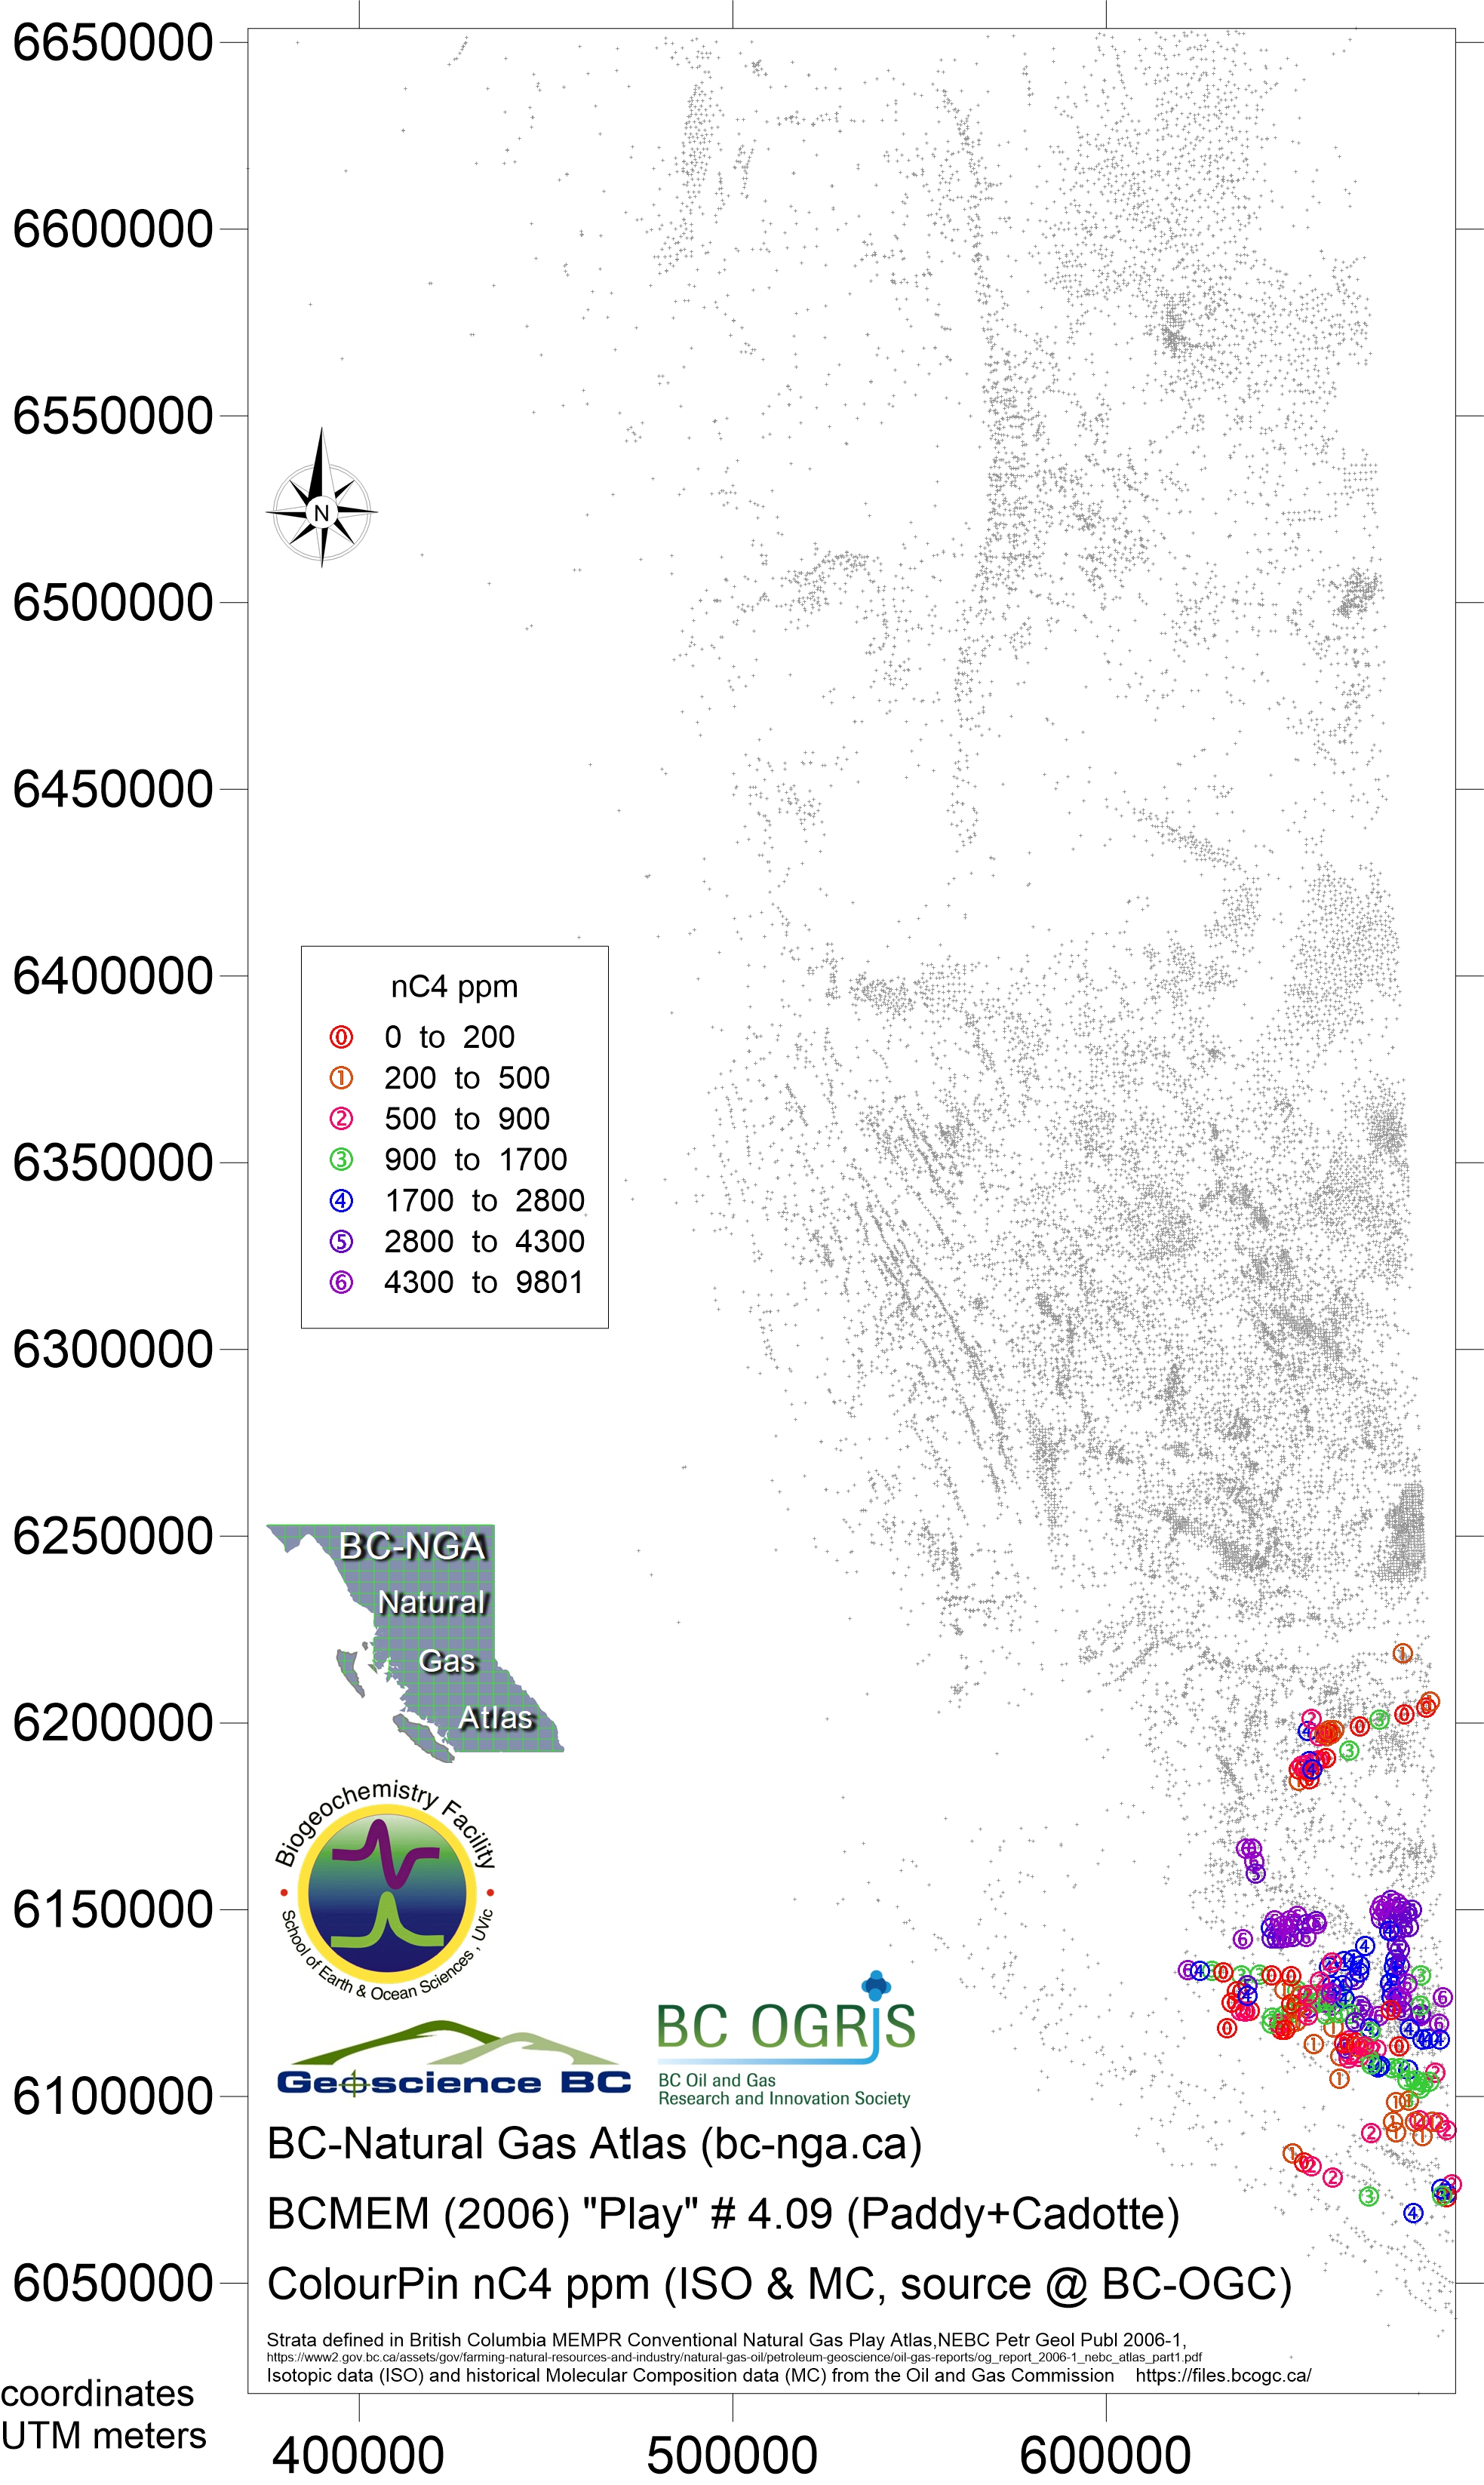
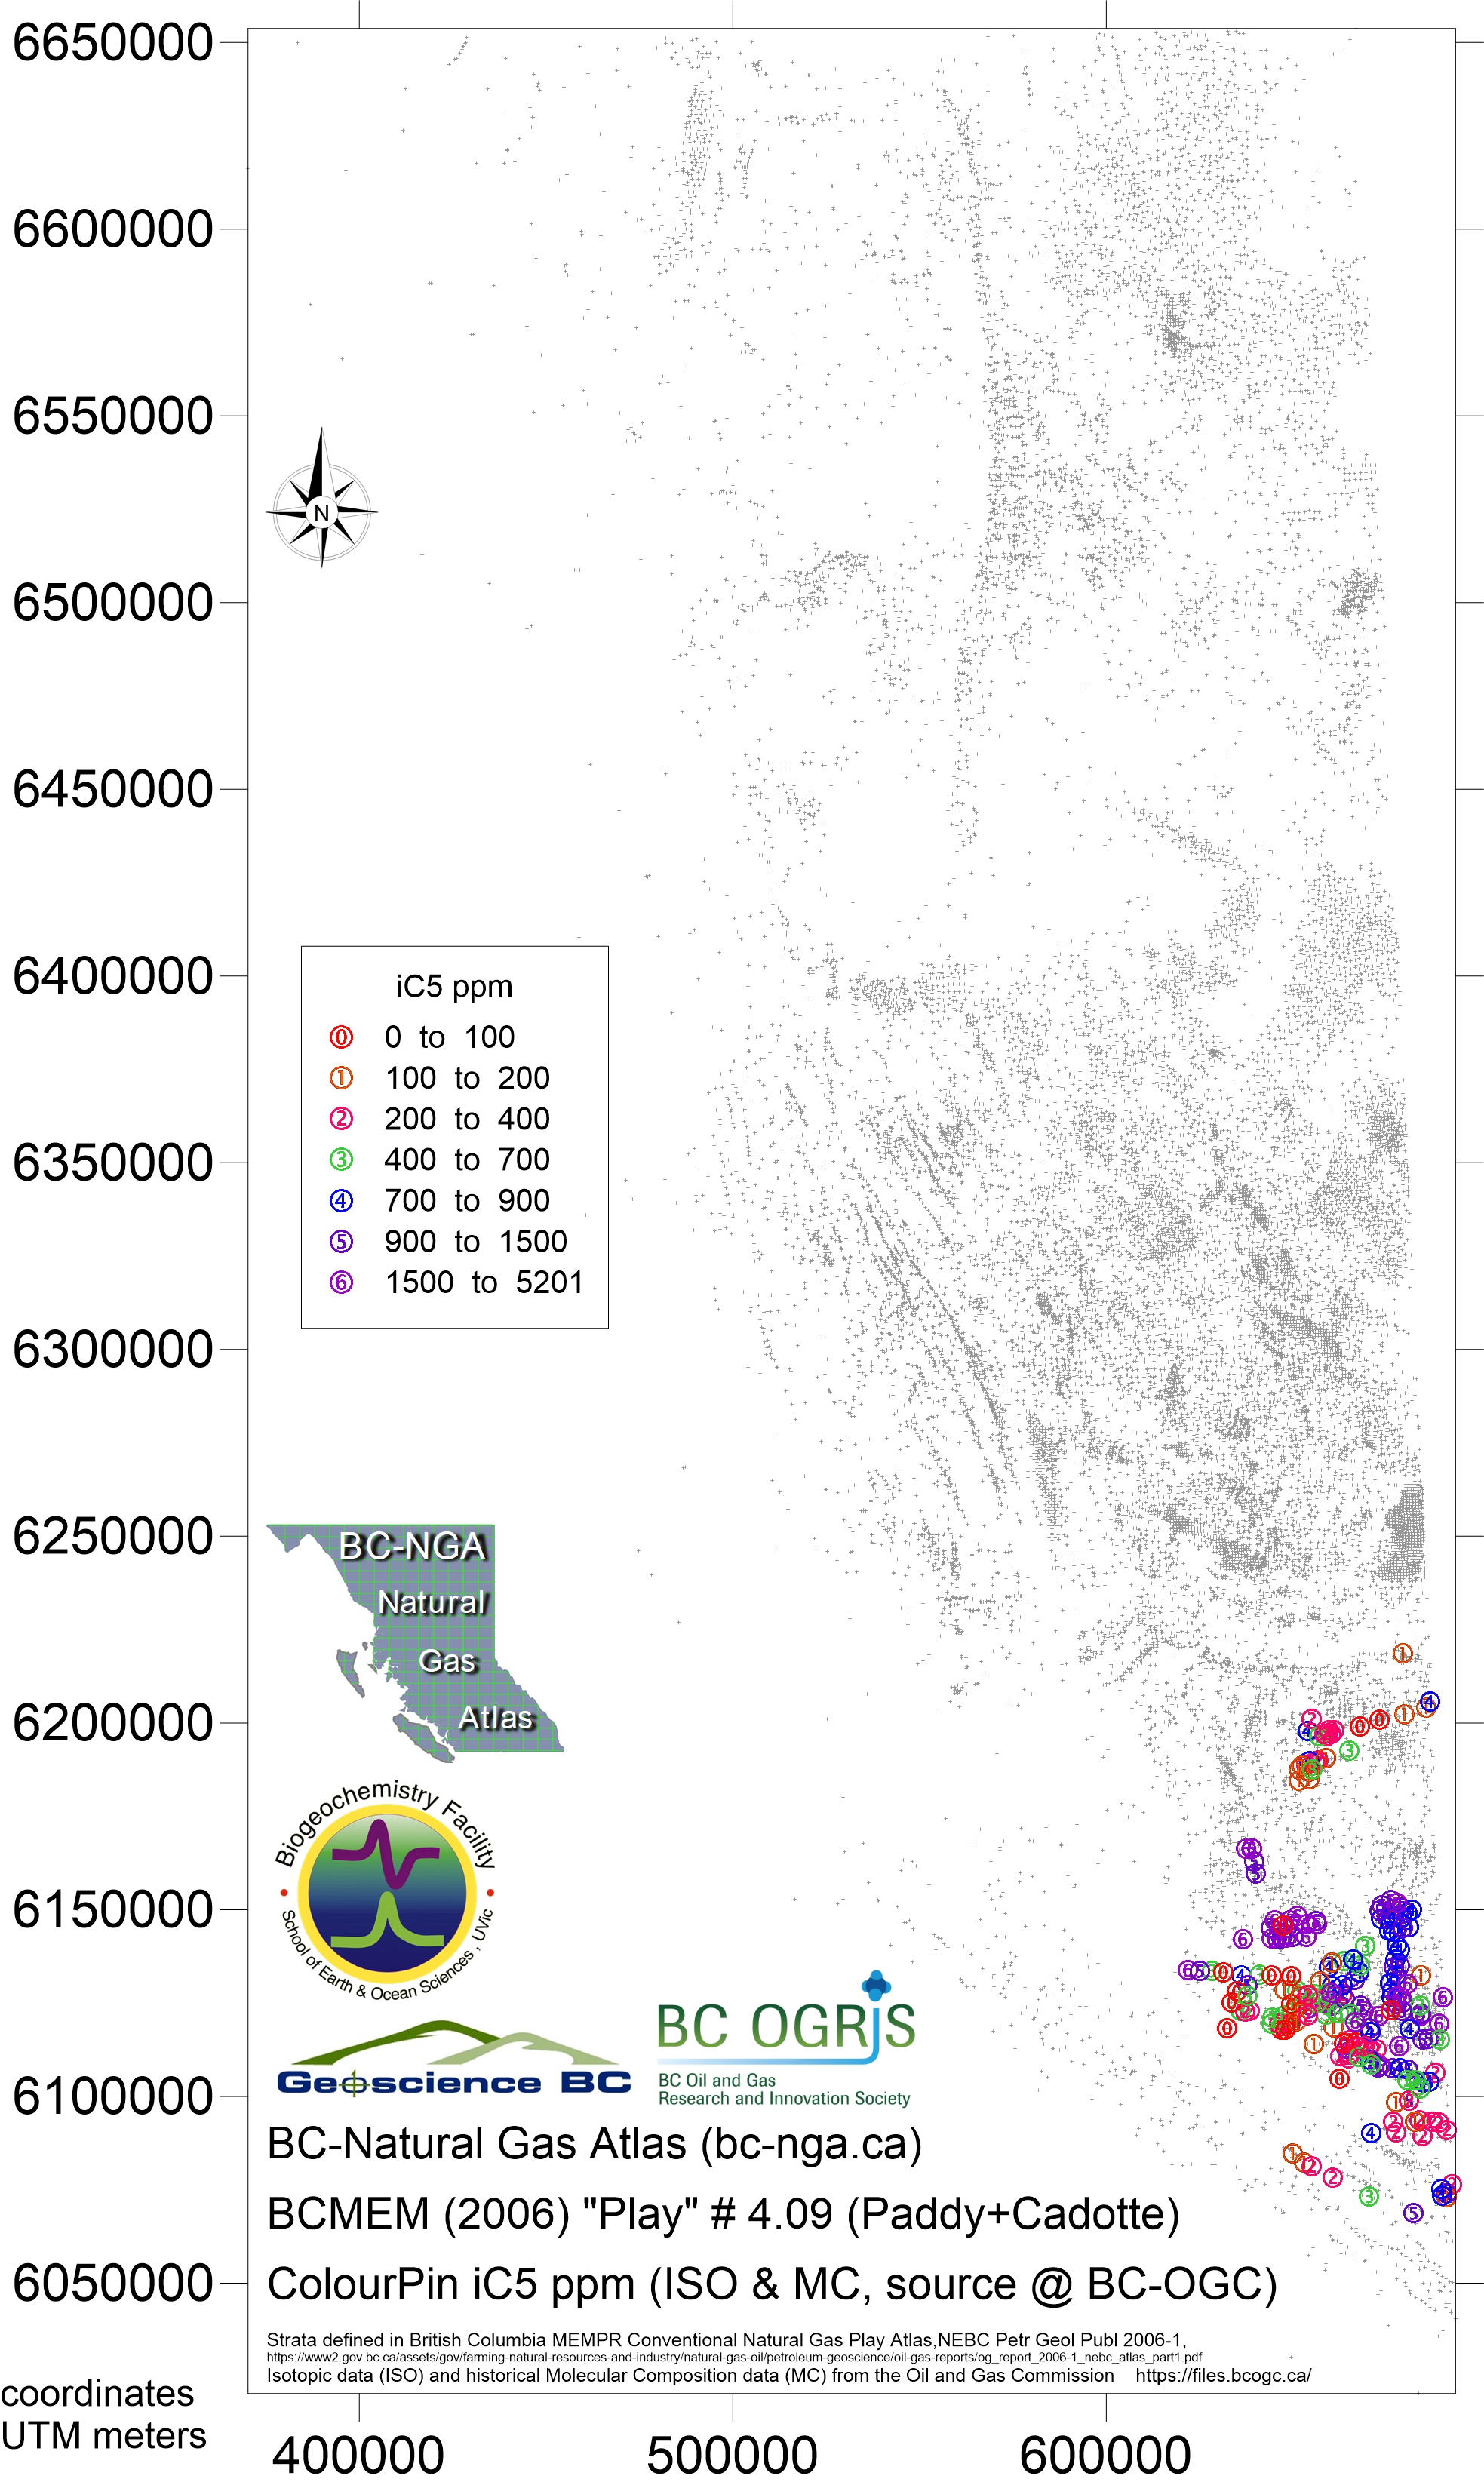
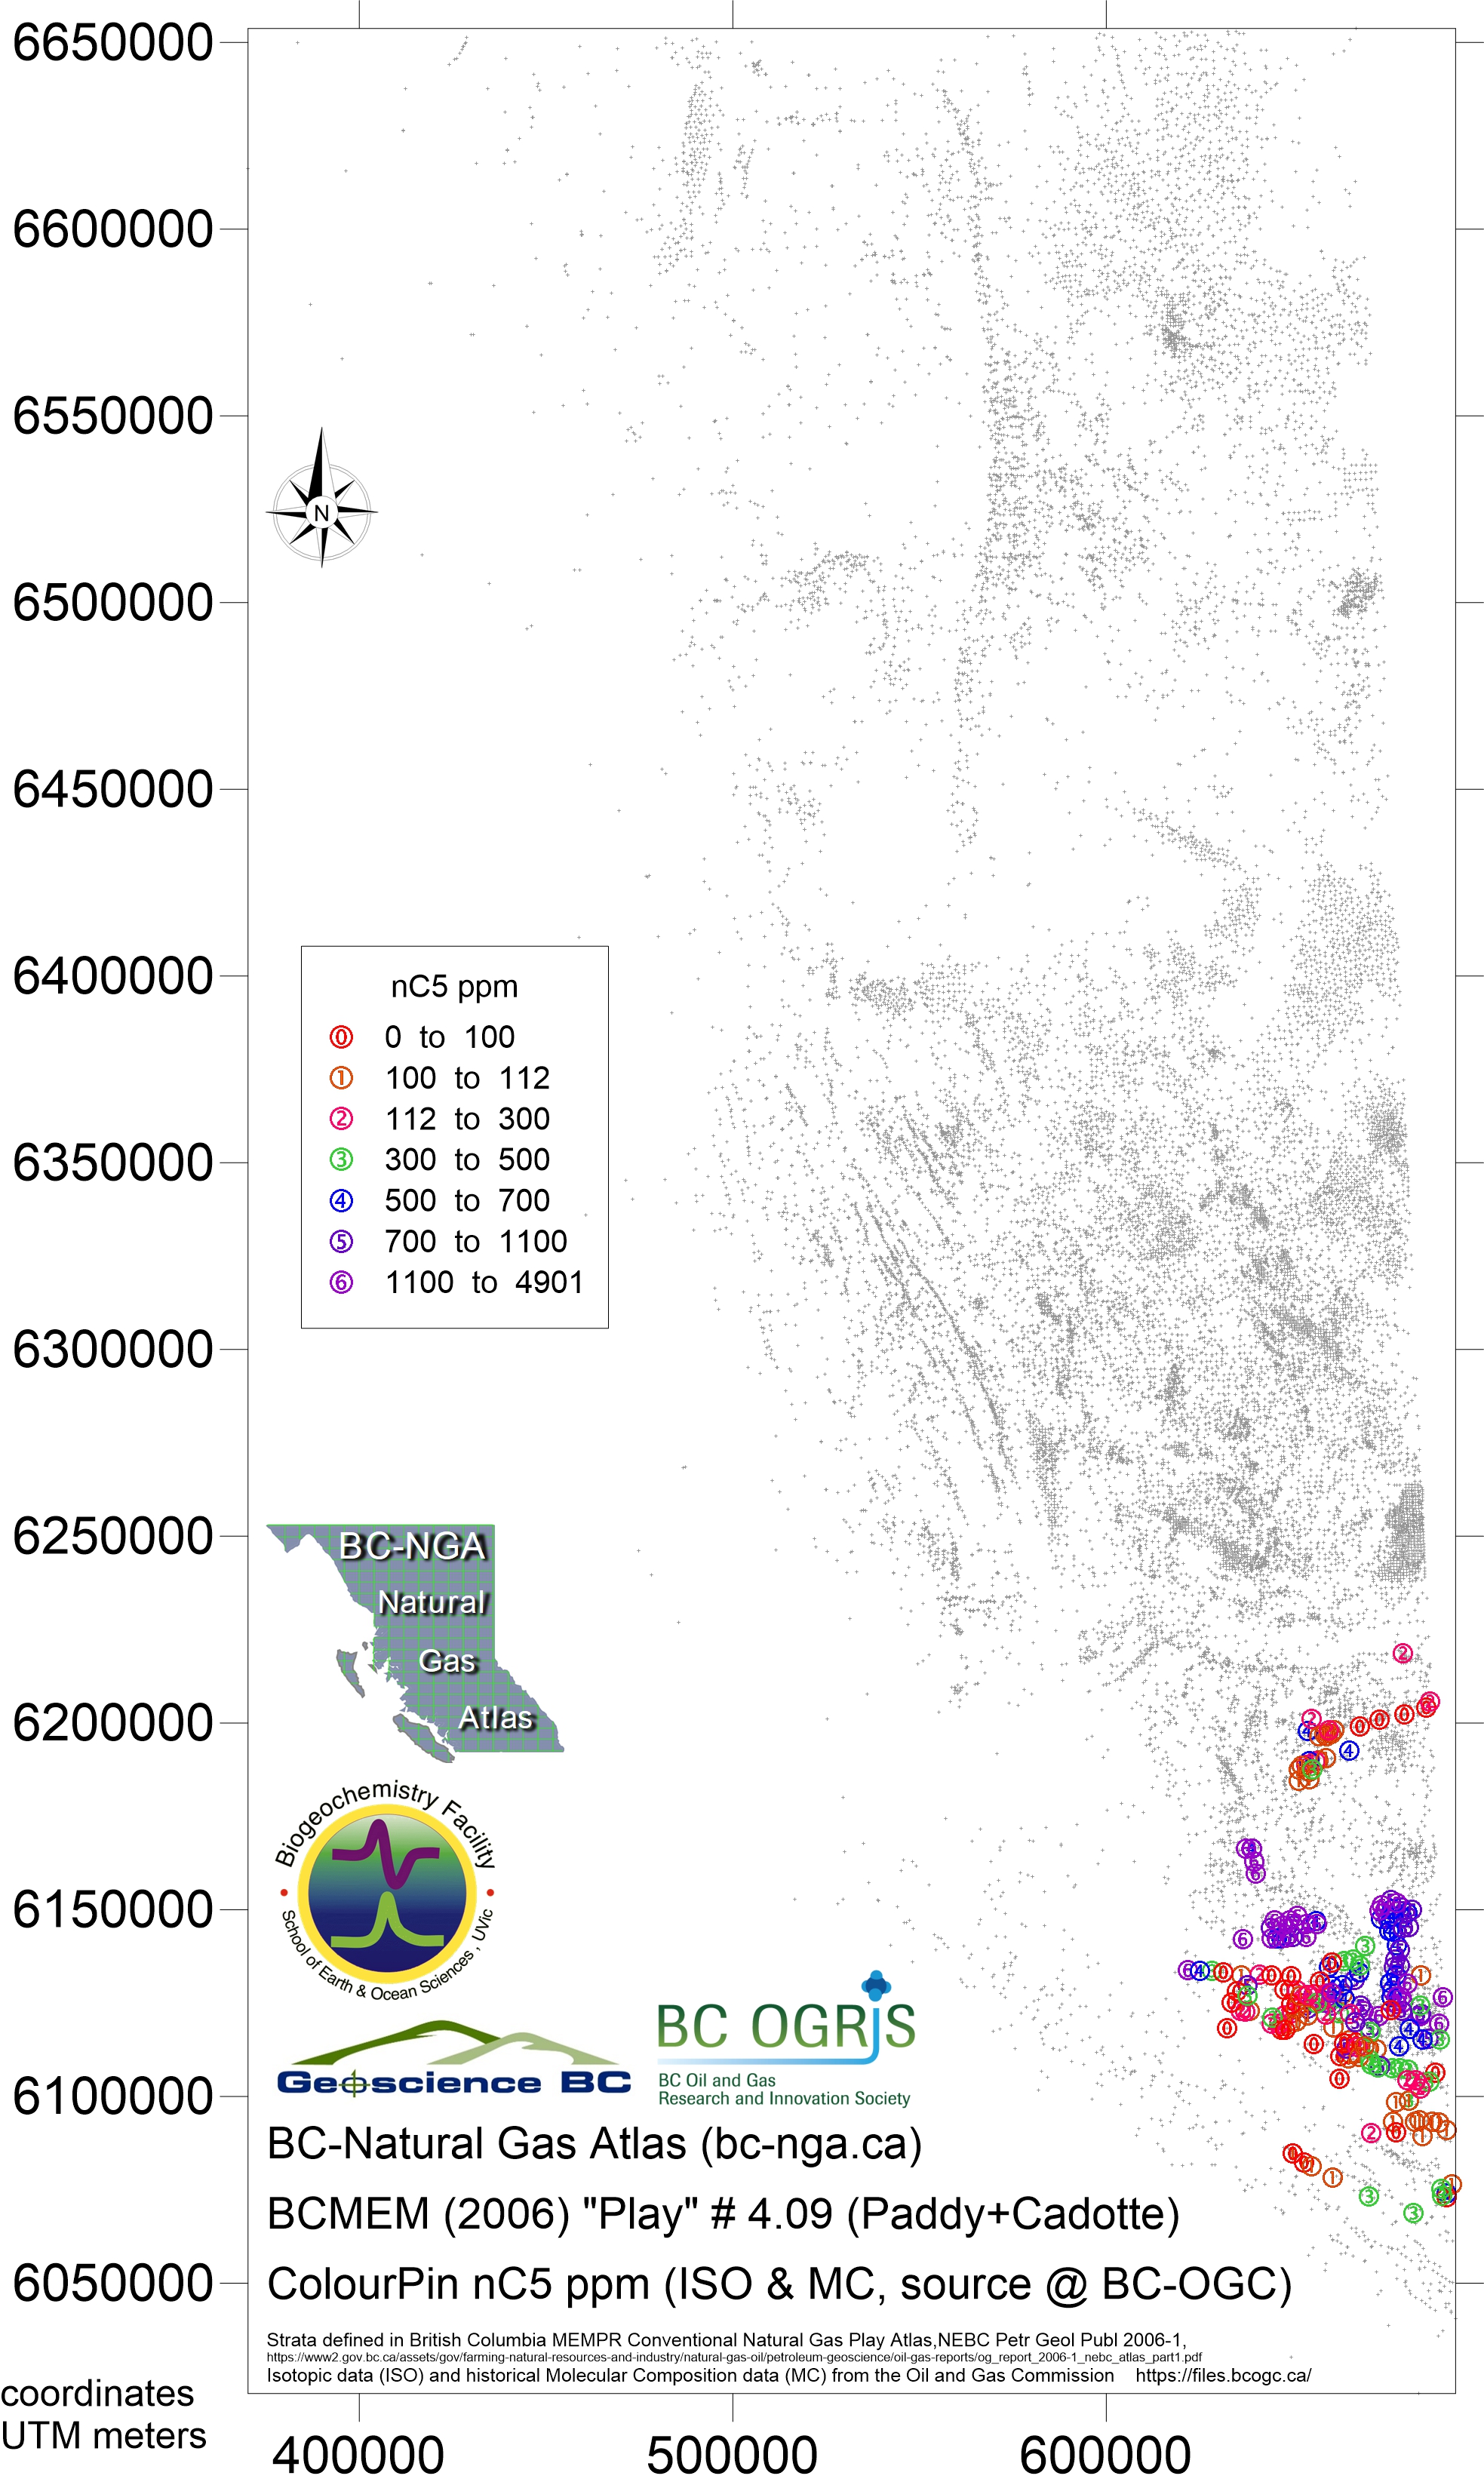
Play 4.09 Paddy and Cadotte Formations and equivalents
- Map022 Nov 2018 play 4.09 PaddyCadotte eqv Bernard ratio
- Map023 Nov 2018 play 4.09 PaddyCadotte eqv dryness ratio
- Map024 Nov 2018 play 4.09 PaddyCadotte eqv iC4nC4 ratio
- Map025 Nov 2018 play 4.09 PaddyCadotte eqv CH4 ppm
- Map026 Nov 2018 play 4.09 PaddyCadotte eqv C2H6 ppm
- Map027 Nov 2018 play 4.09 PaddyCadotte eqv C3H8 ppm
- Map028 Nov 2018 play 4.09 PaddyCadotte eqv iC4H10 ppm
- Map029 Nov 2018 play 4.09 PaddyCadotte eqv nC4H10 ppm
- Map030 Nov 2018 play 4.09 PaddyCadotte eqv iC5H12 ppm
- Map031 Nov 2018 play 4.09 PaddyCadotte eqv nC5H12 ppm
- Map032 Nov 2018 play 4.09 PaddyCadotte eqv time series gradient Bernard ratio
- Map033 Nov 2018 play 4.09 PaddyCadotte eqv time series gradient CO2
- Map034 Nov 2018 play 4.09 PaddyCadotte eqv time series start point Bernard ratio
- Map035 Nov 2018 play 4.09 PaddyCadotte eqv time series start point CO2
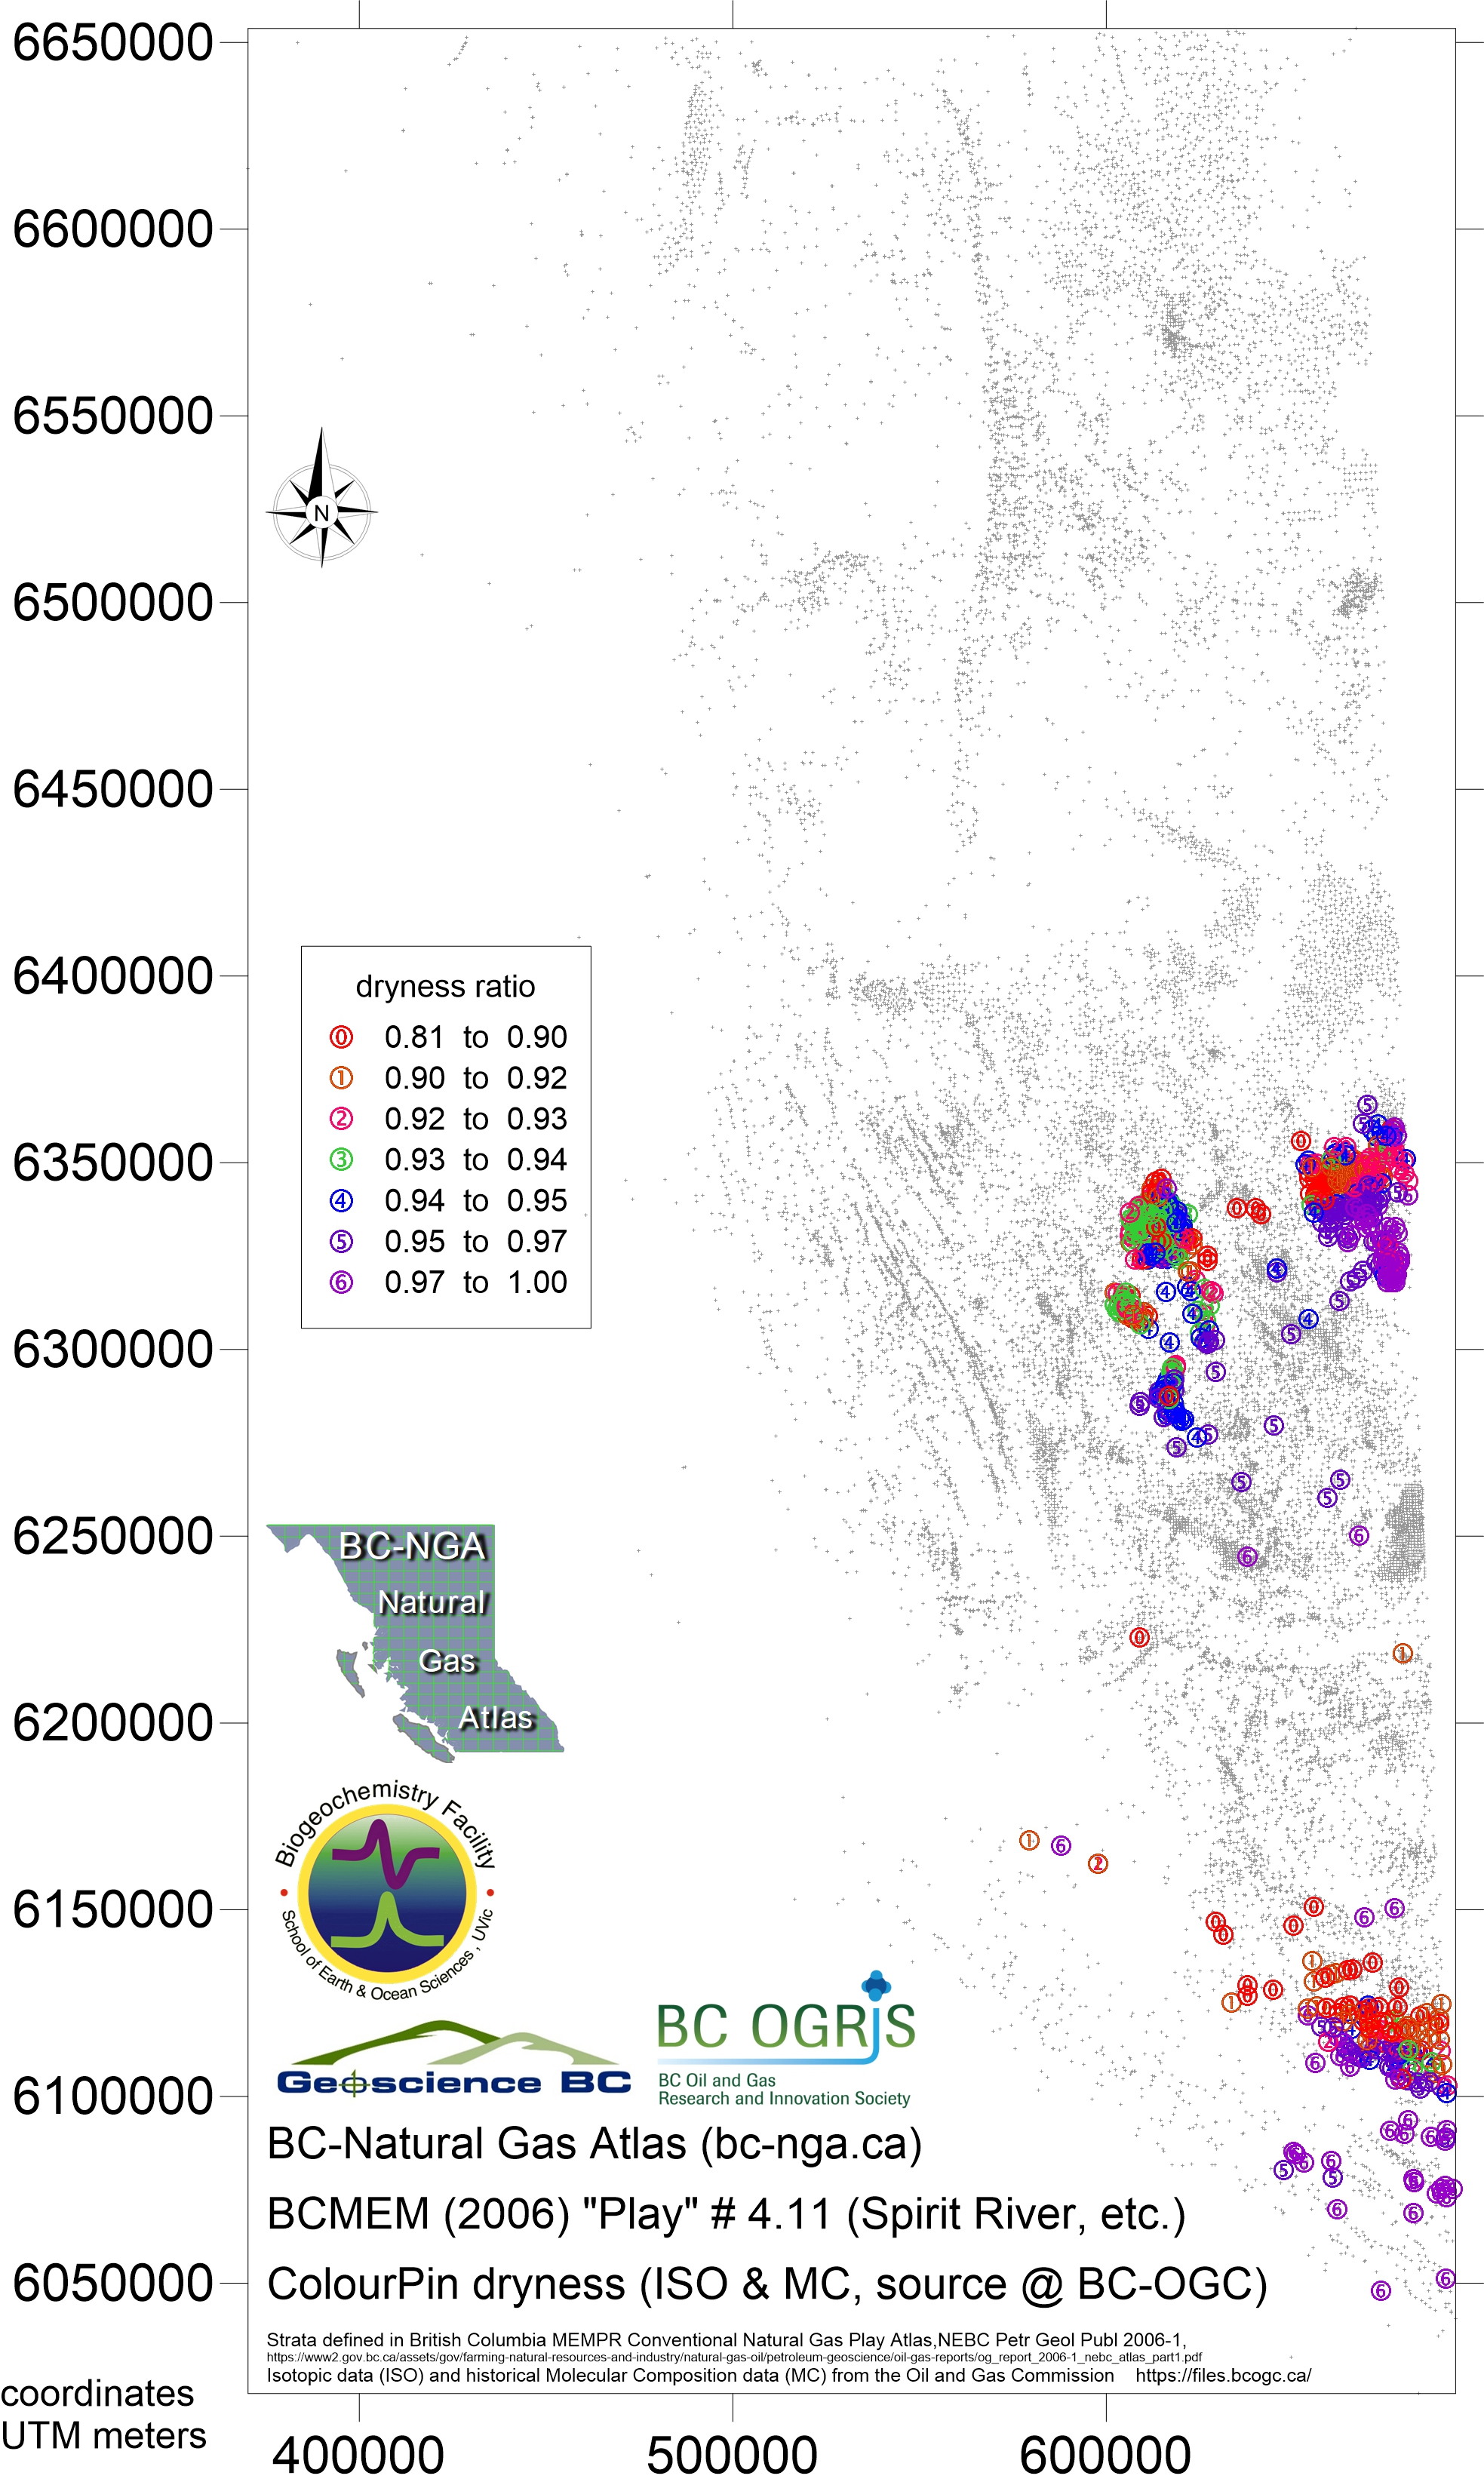
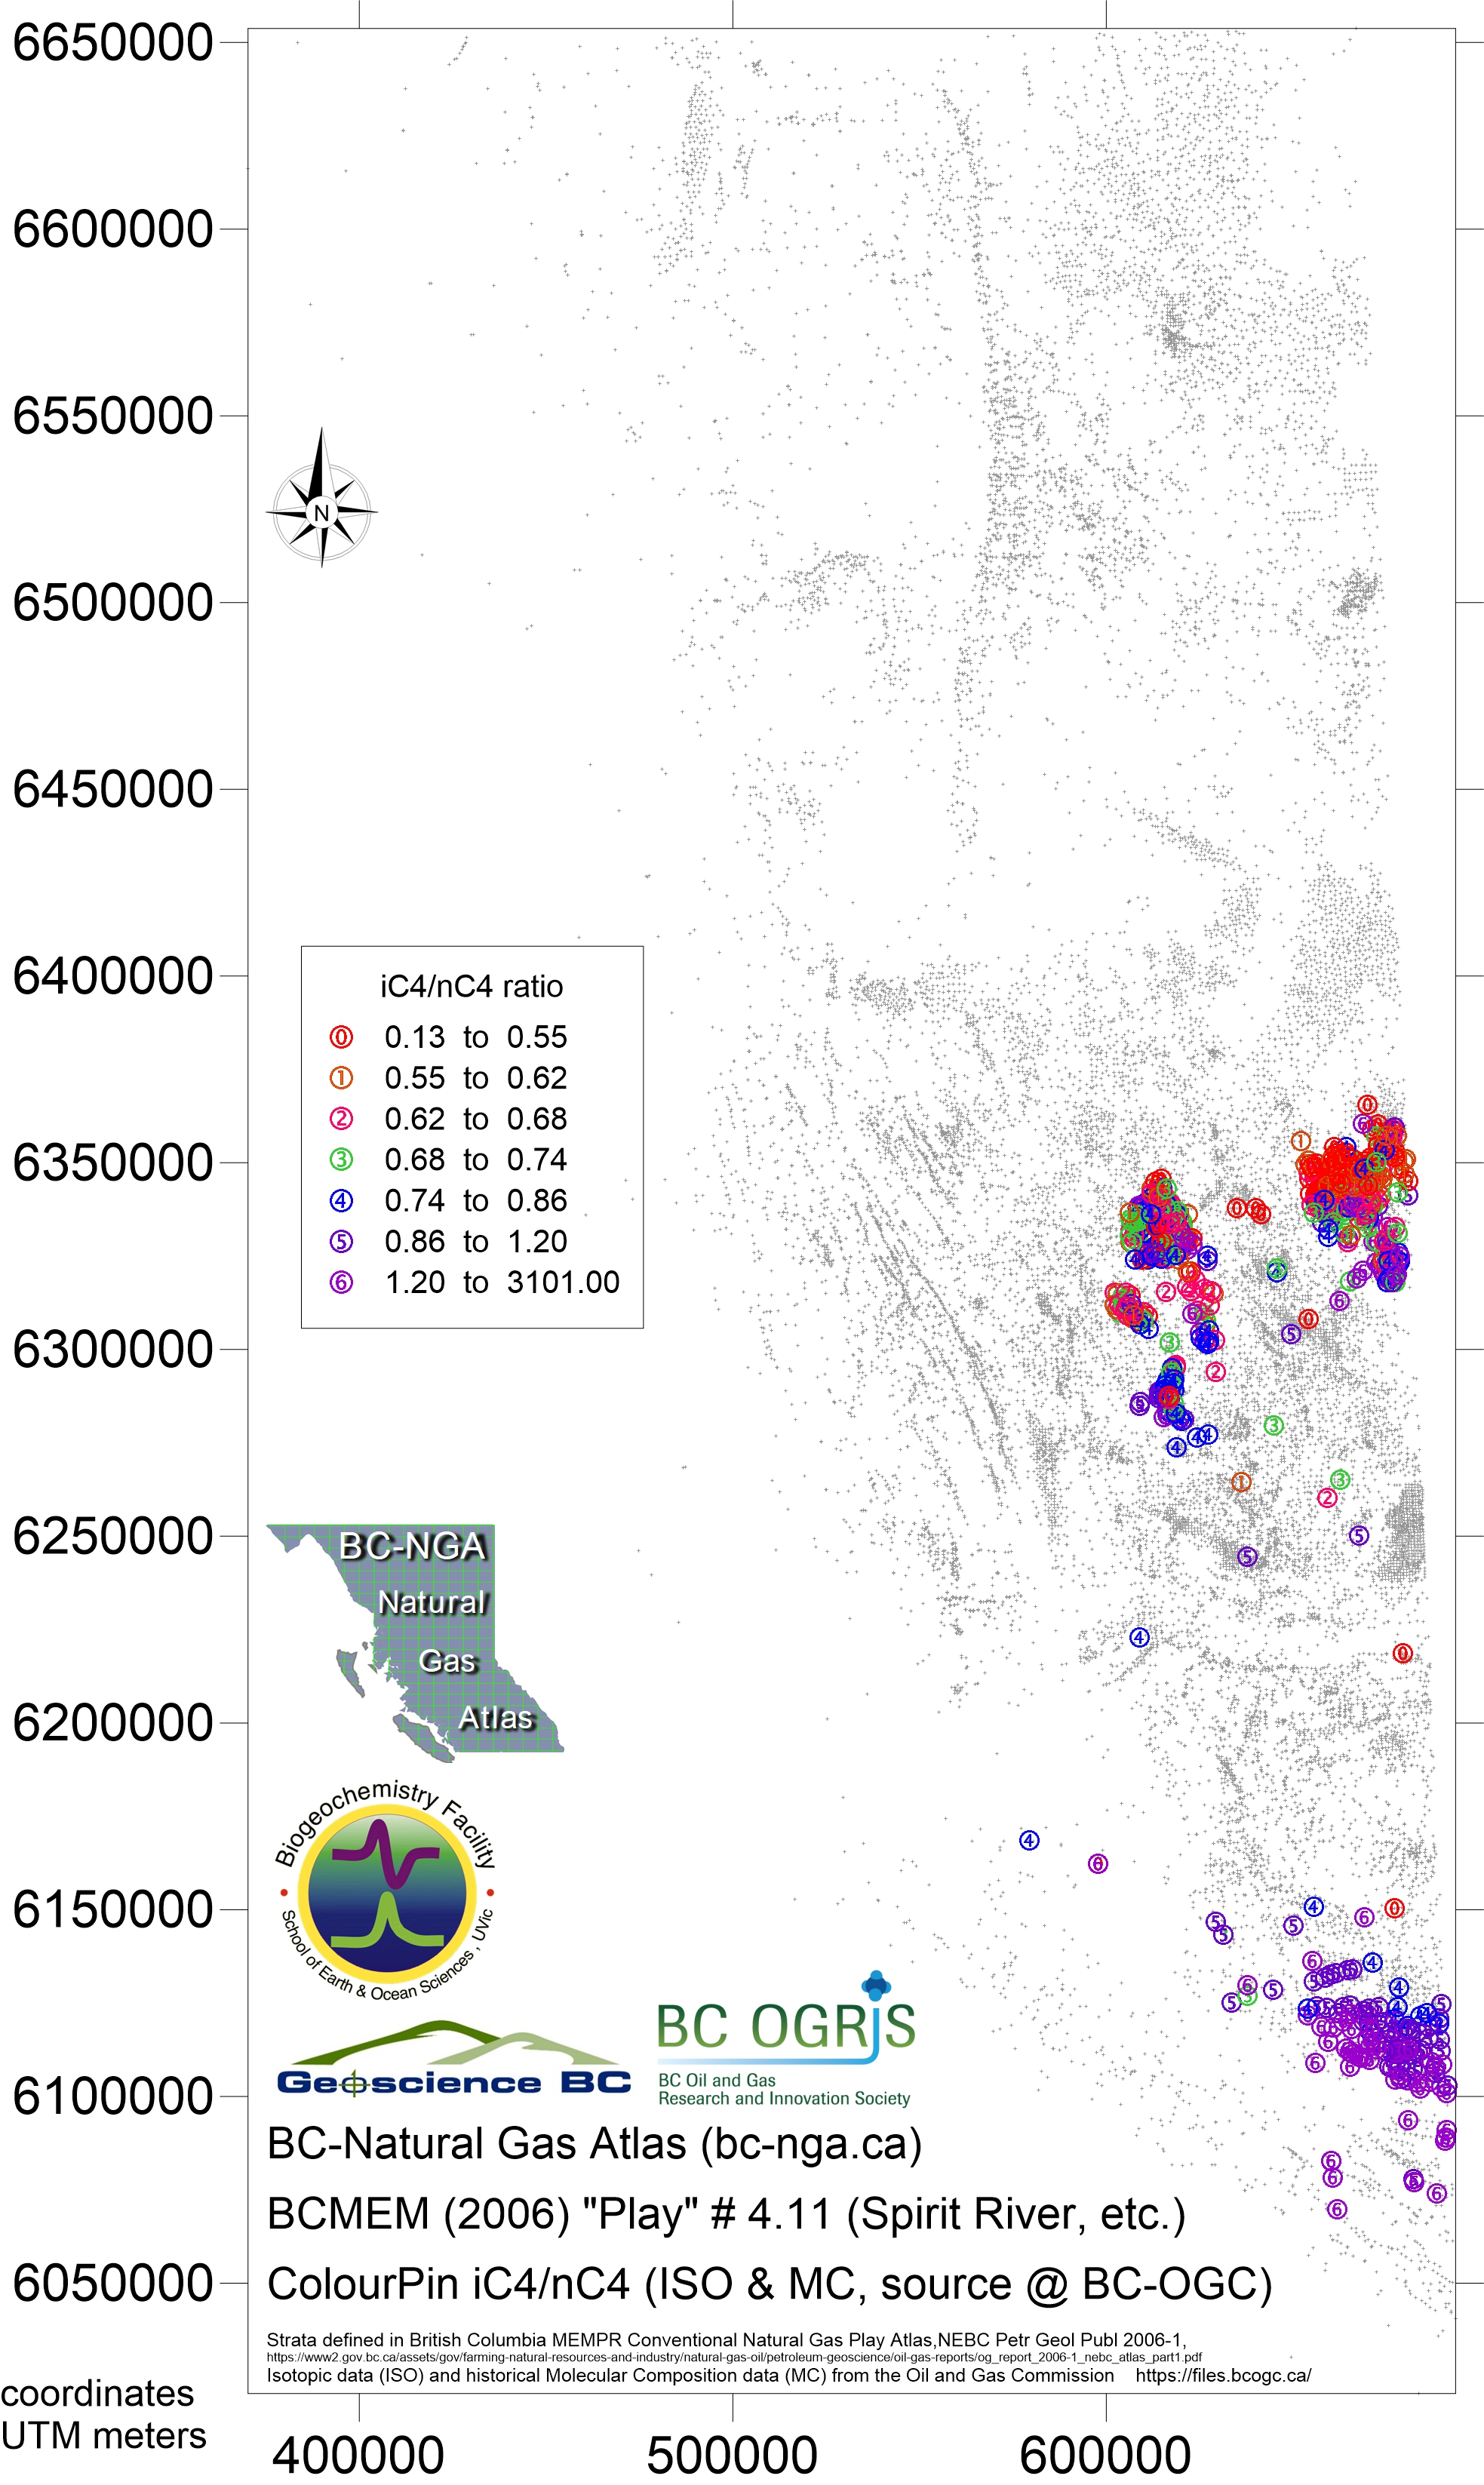
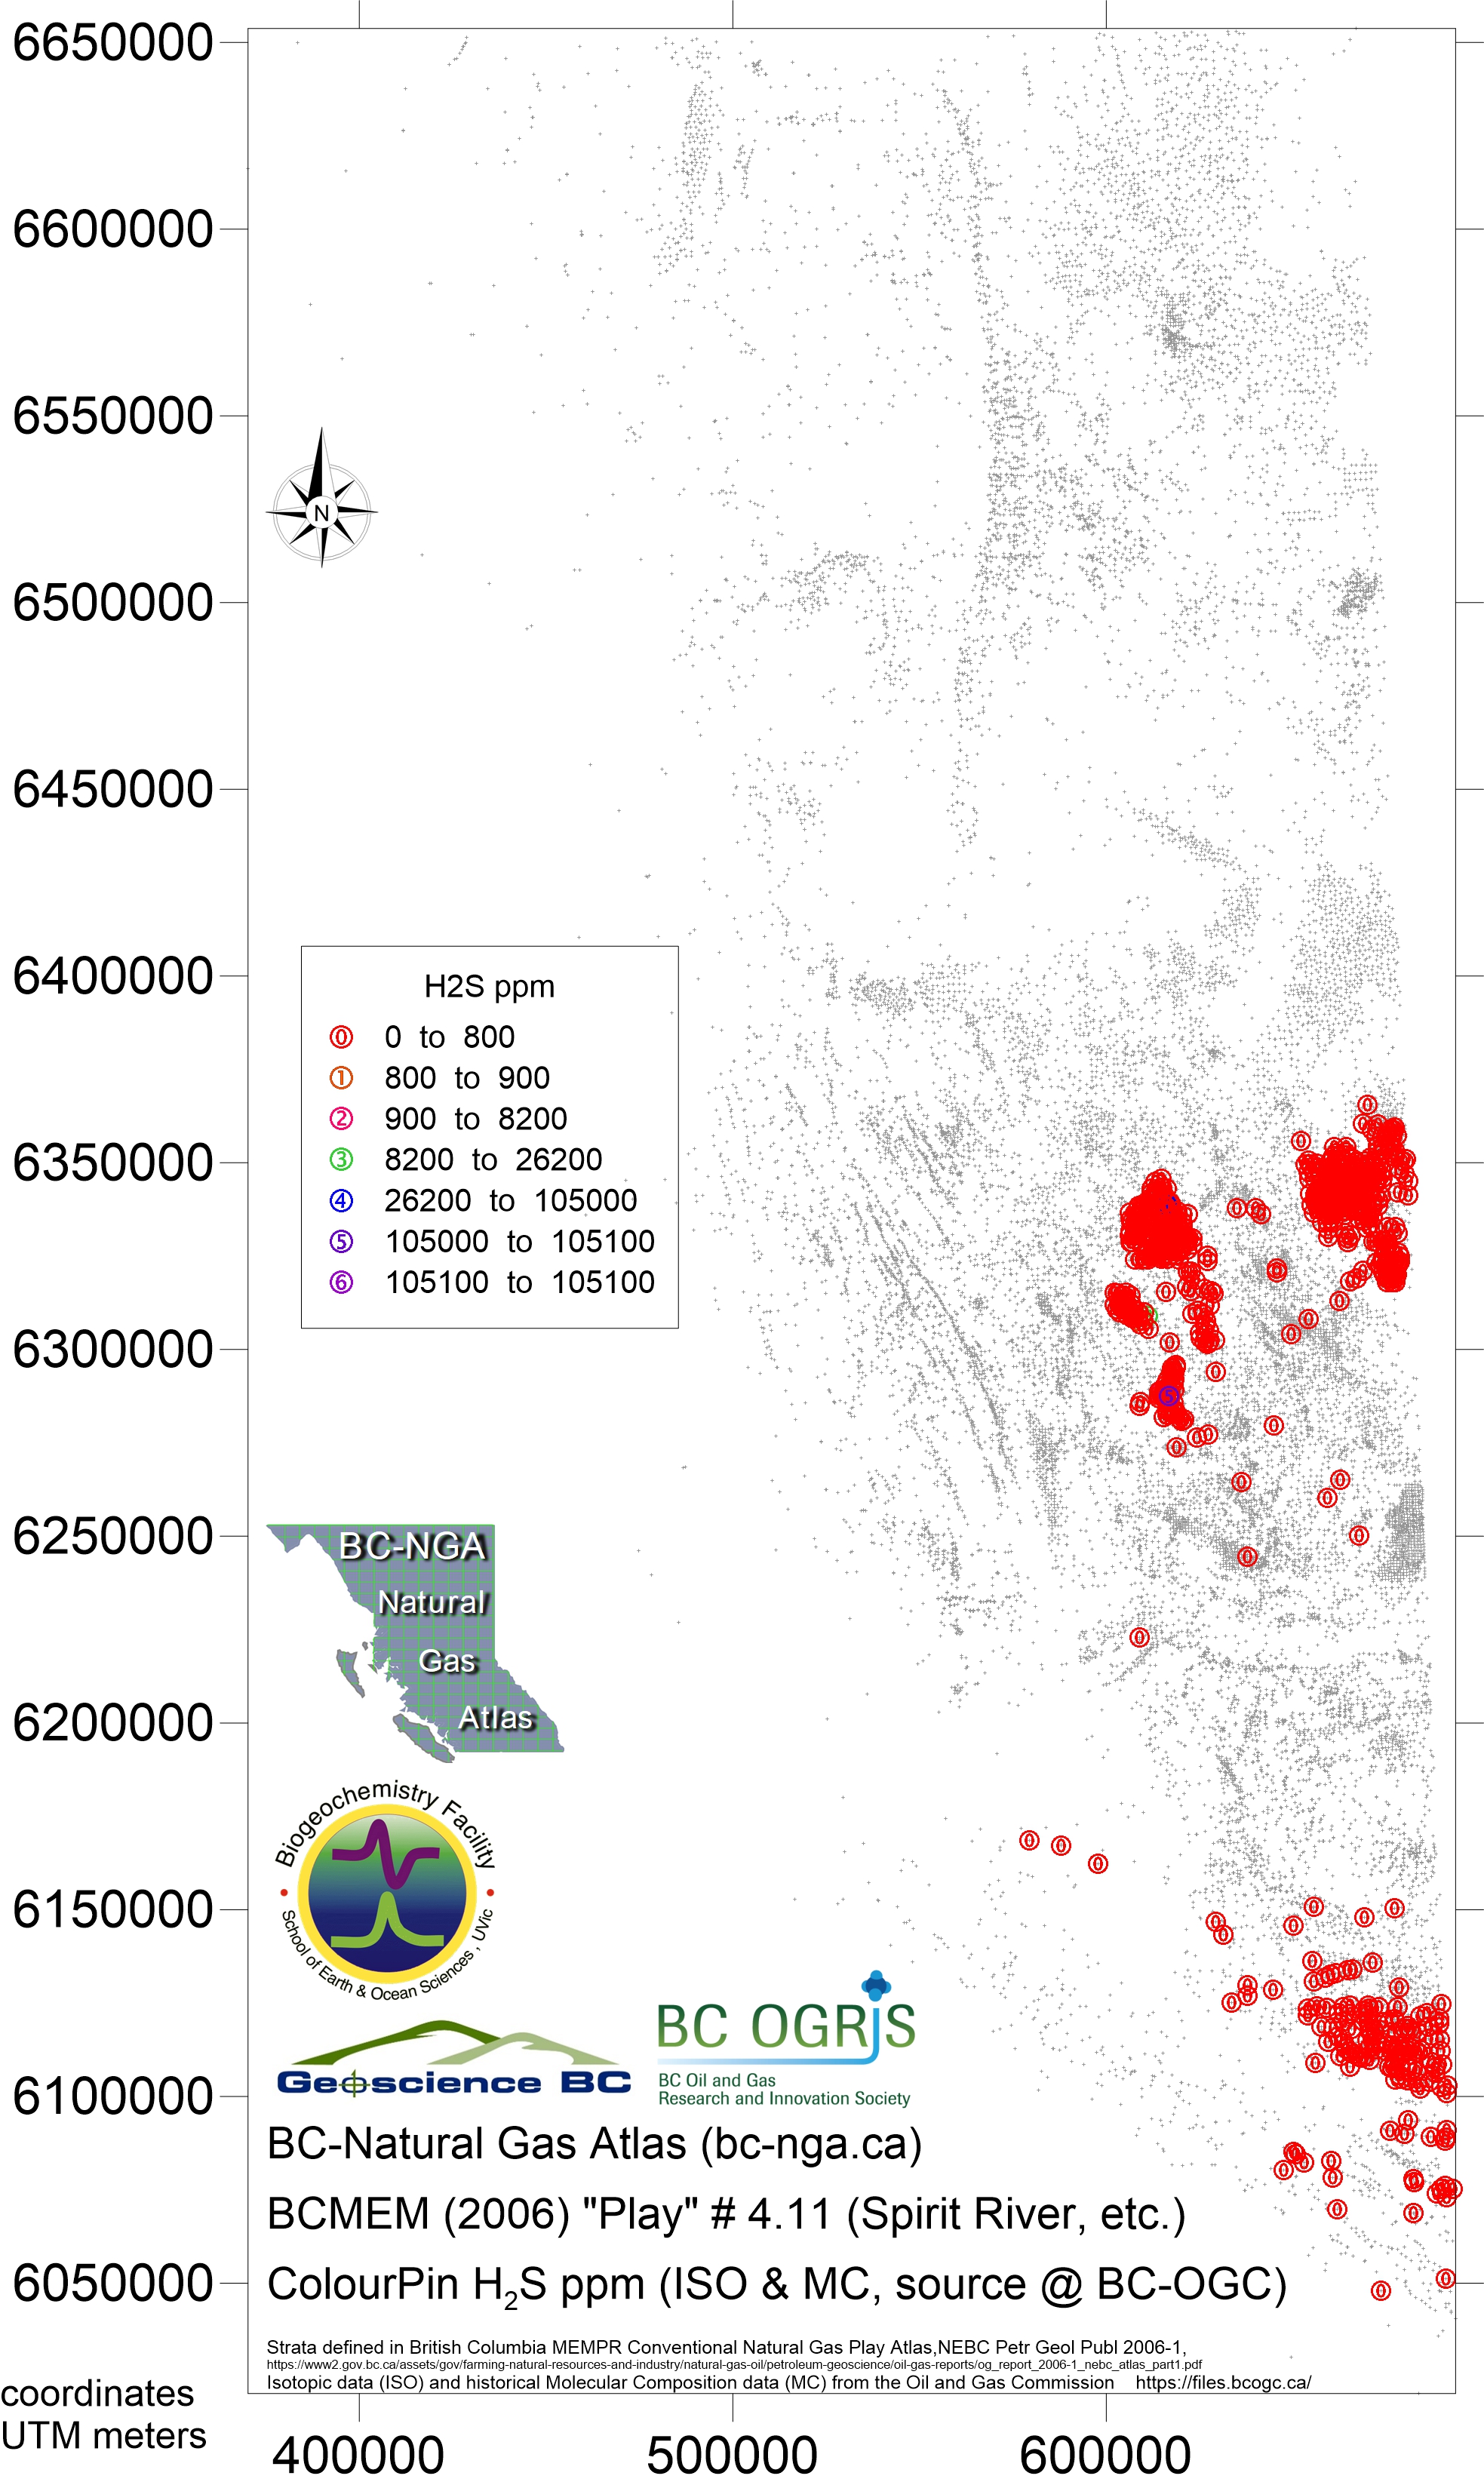
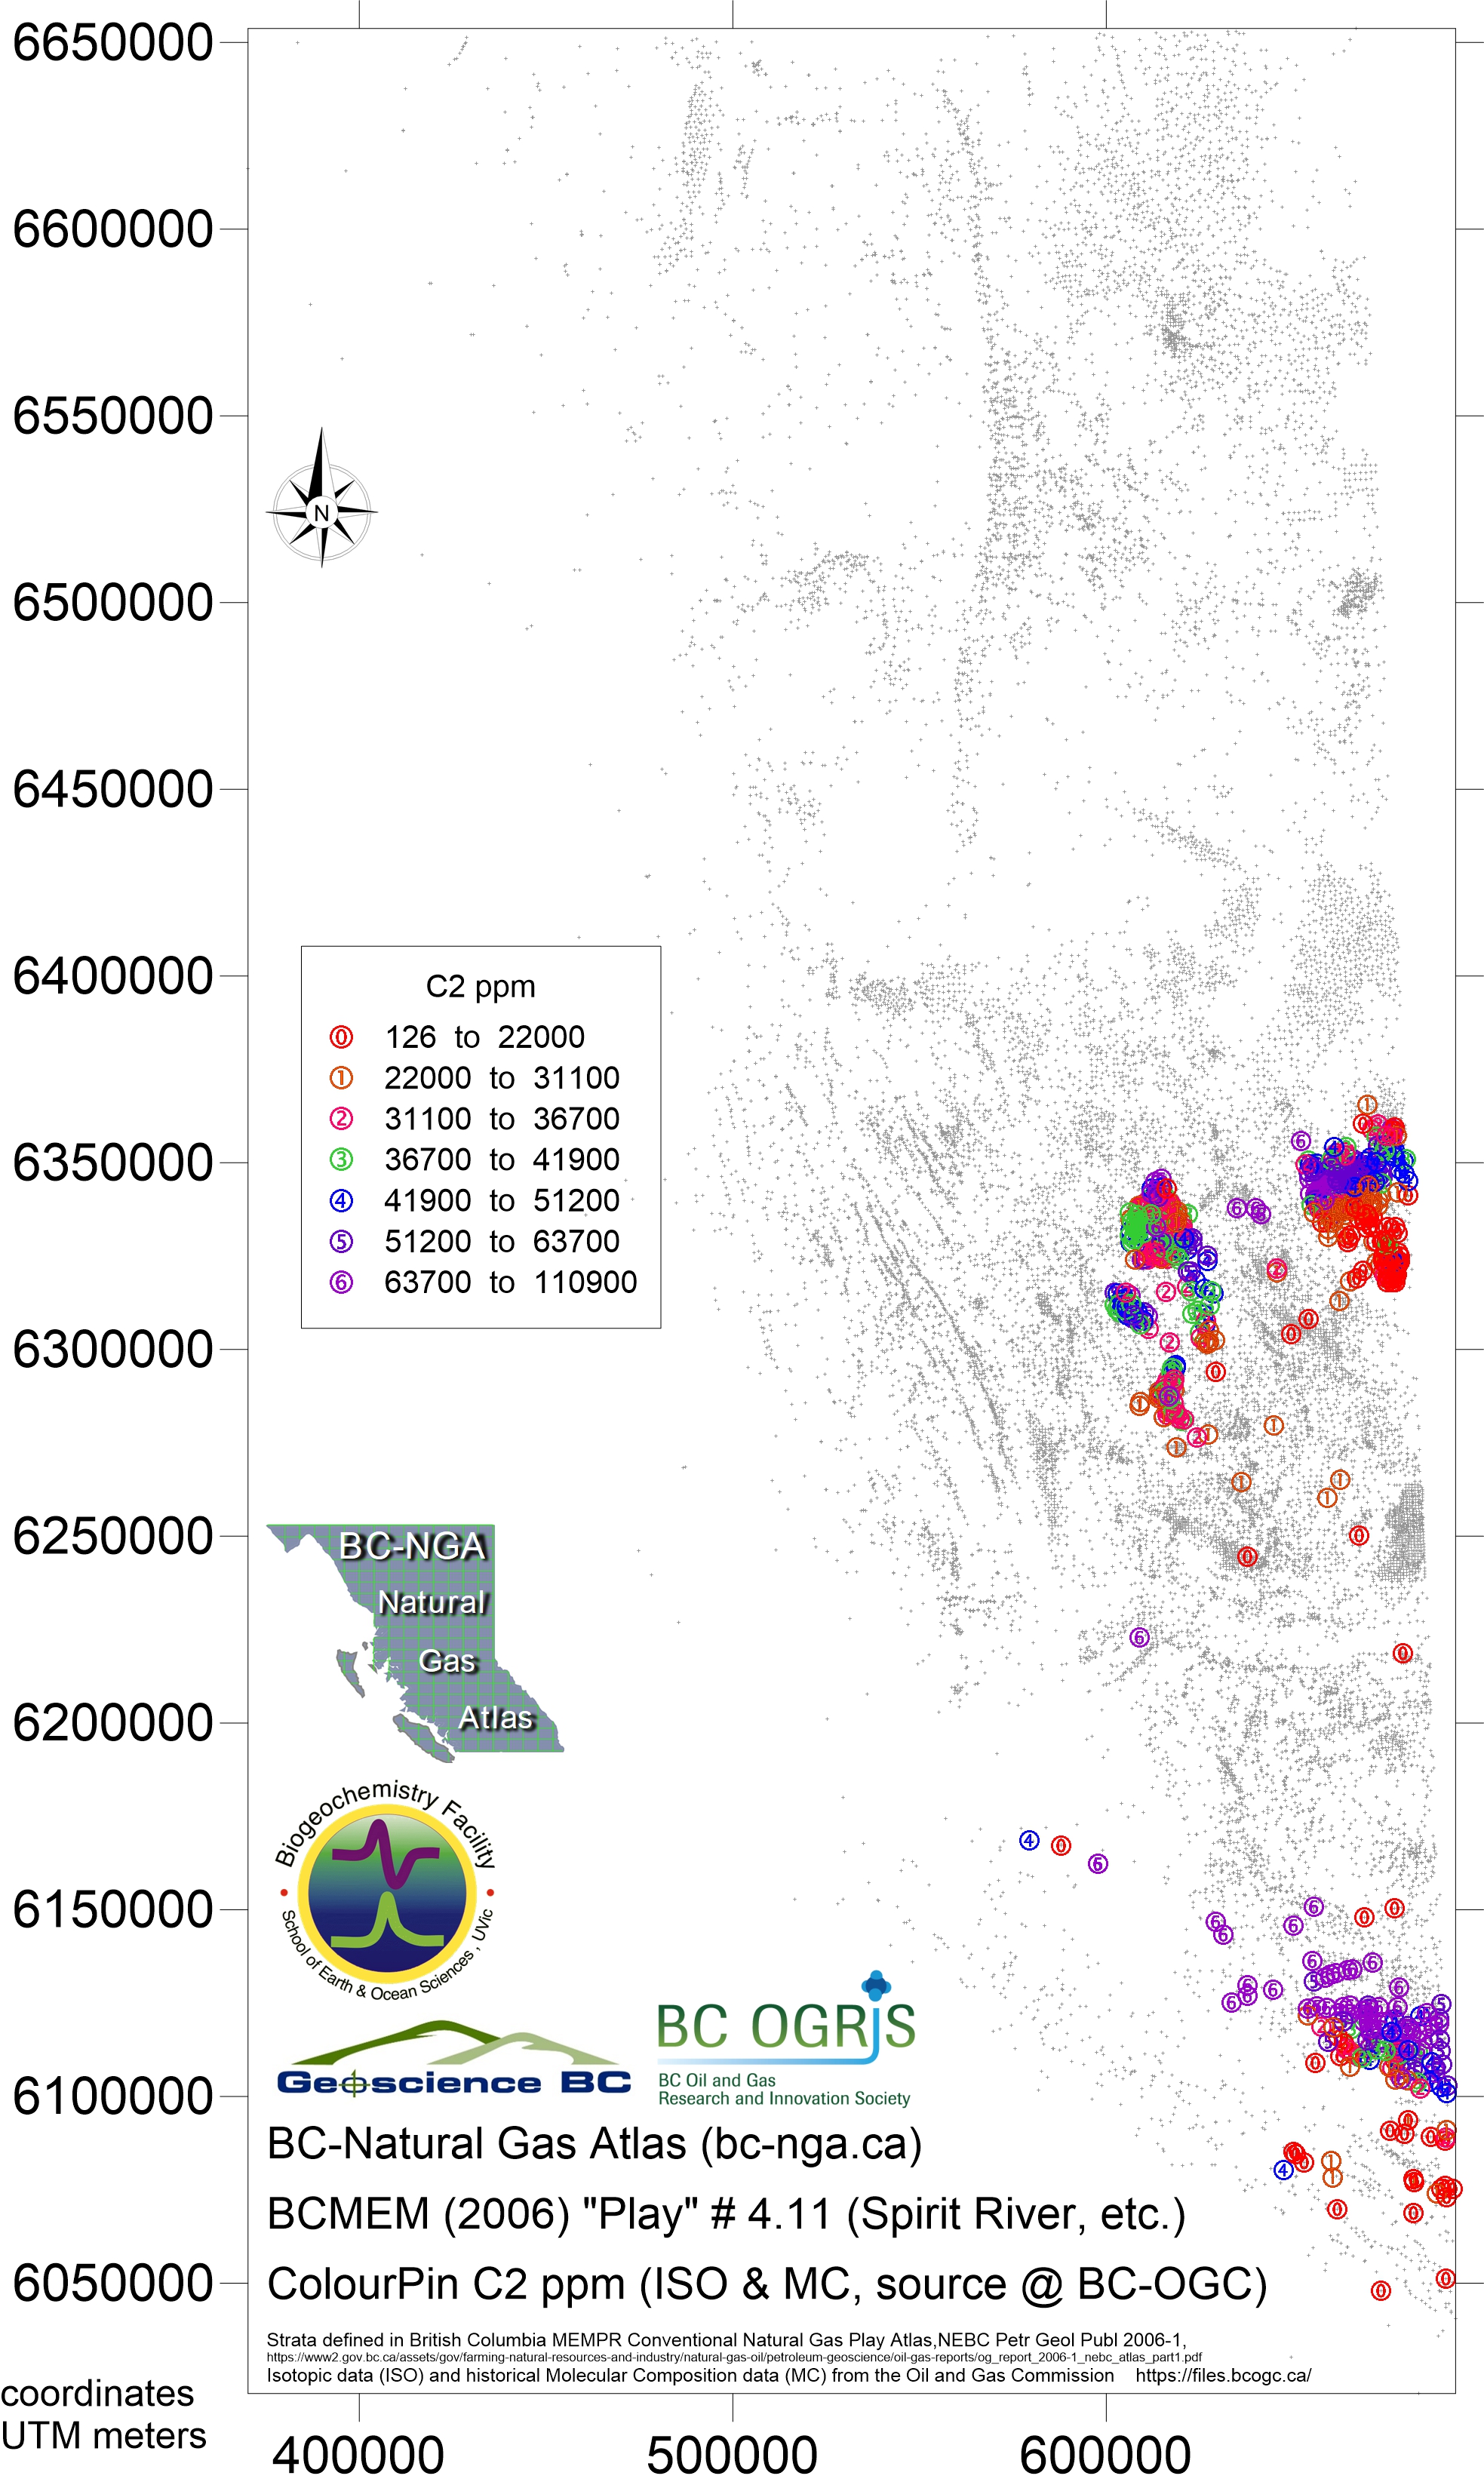
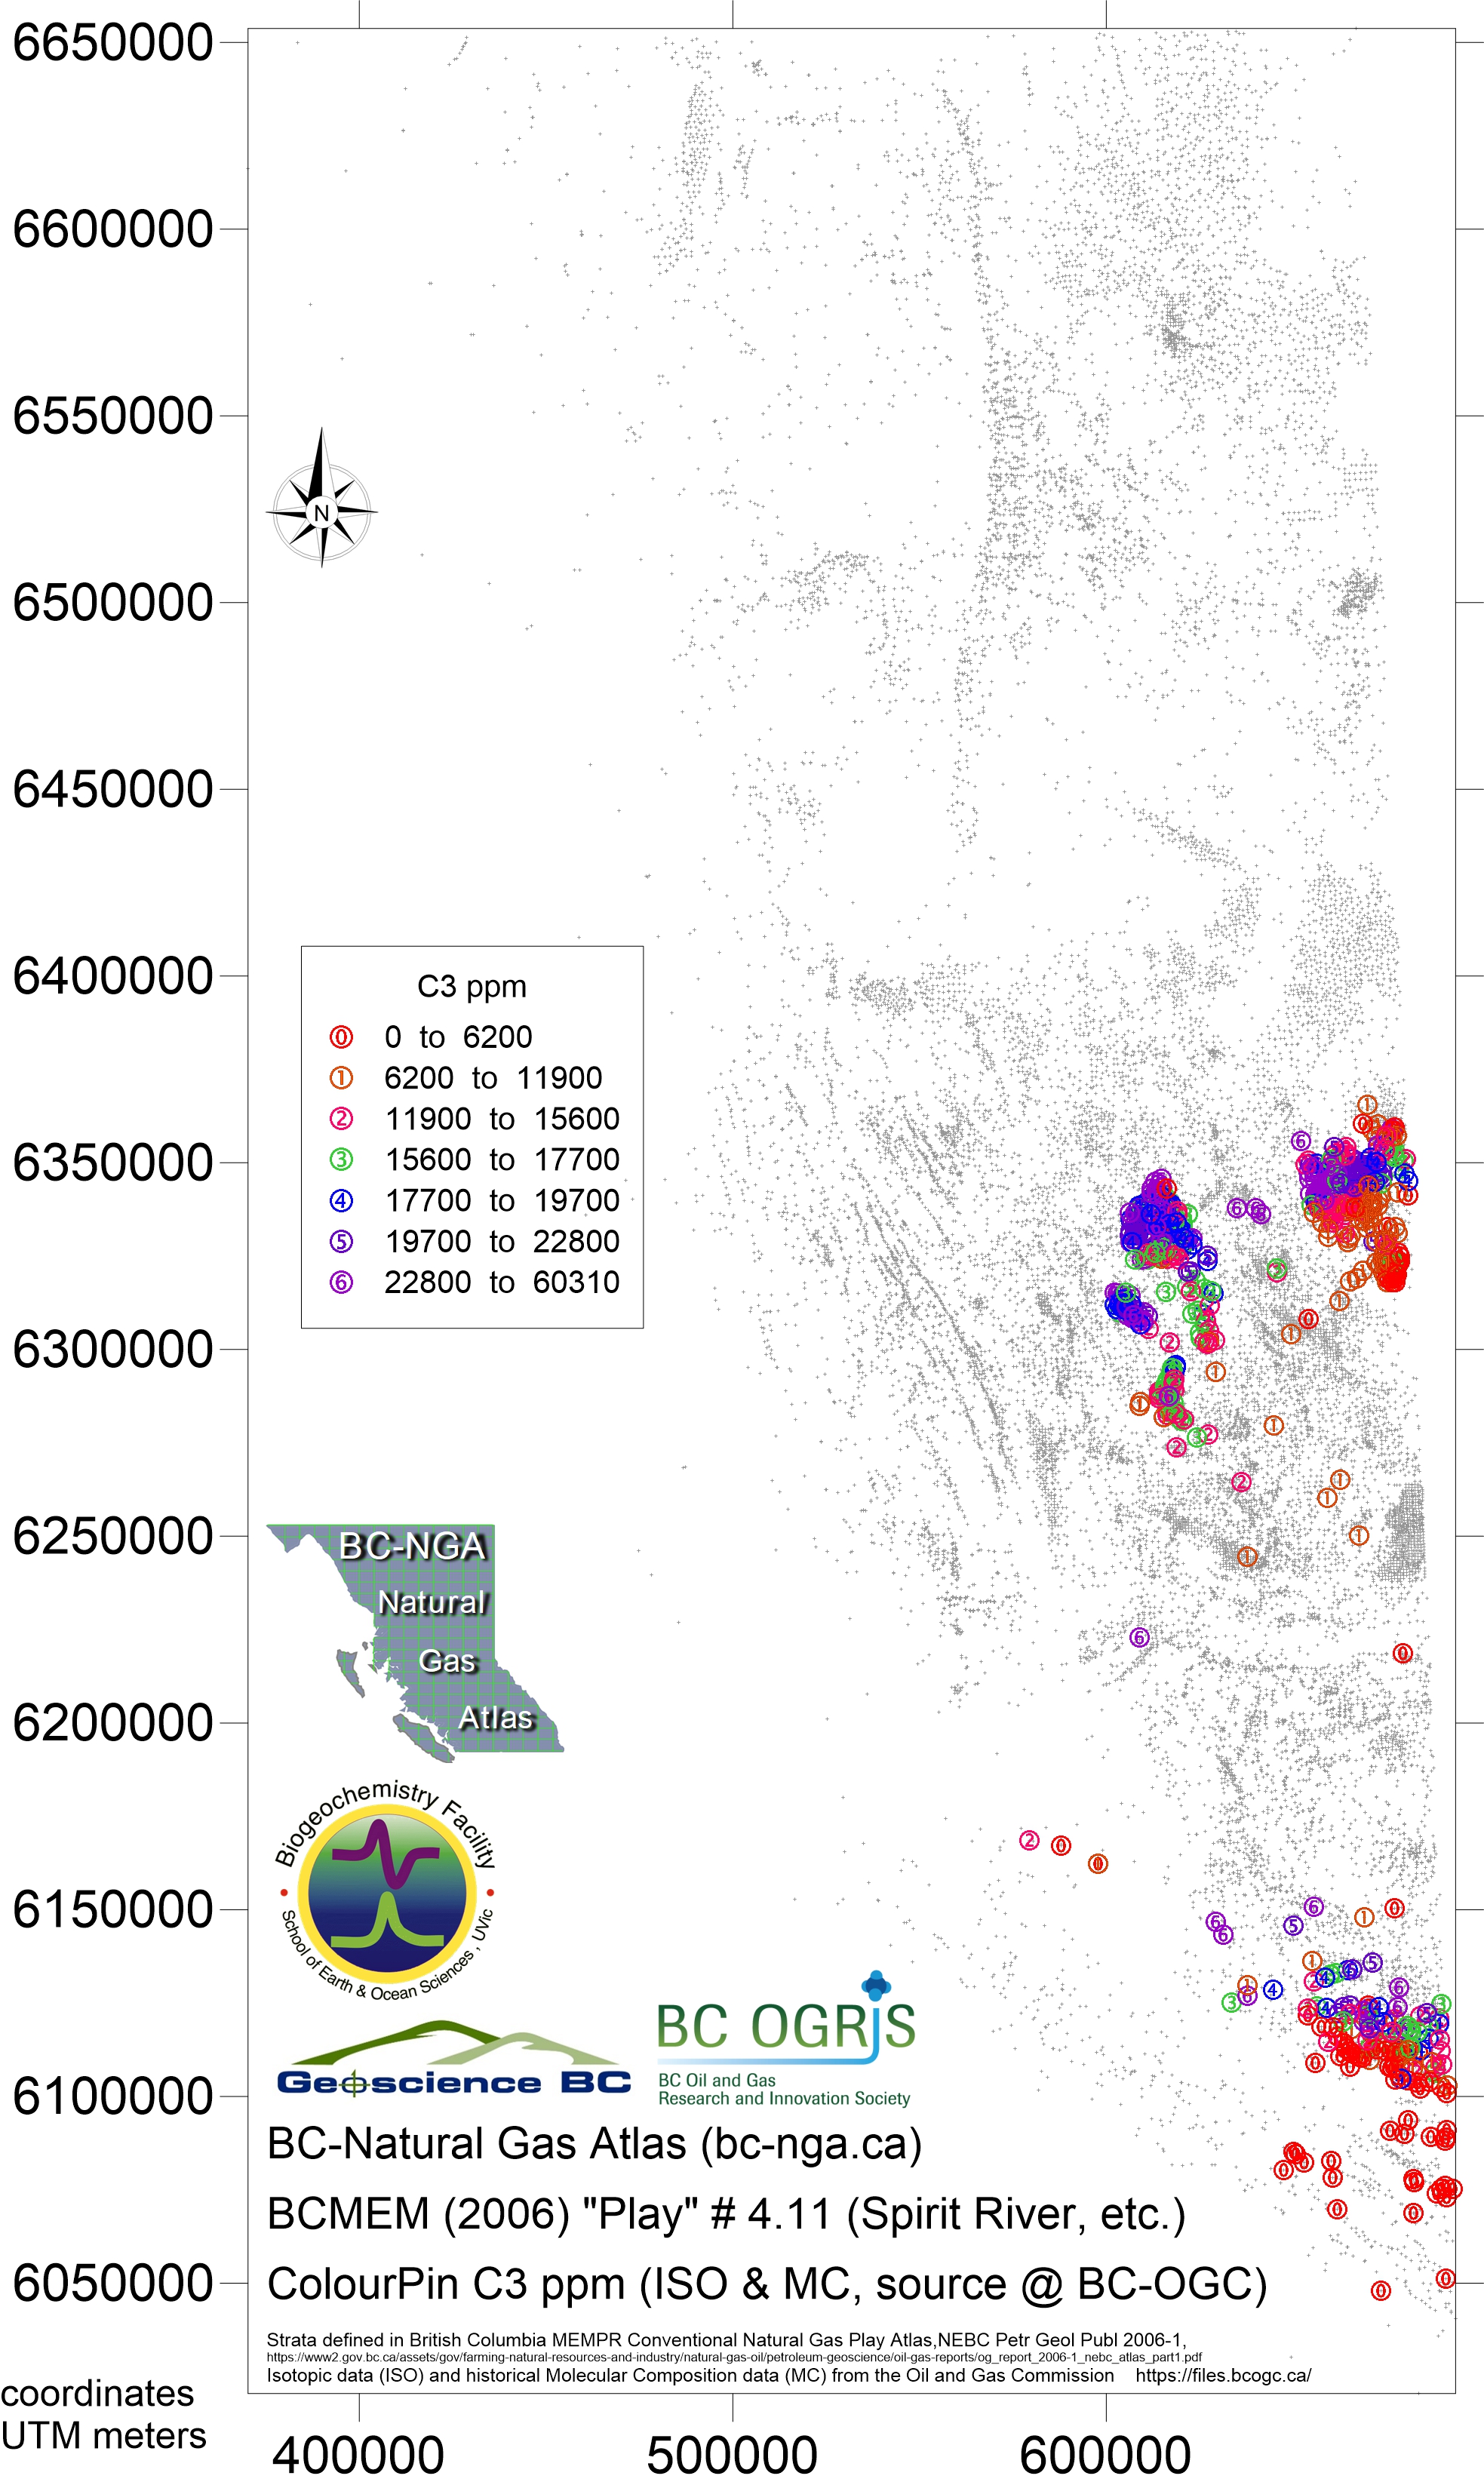
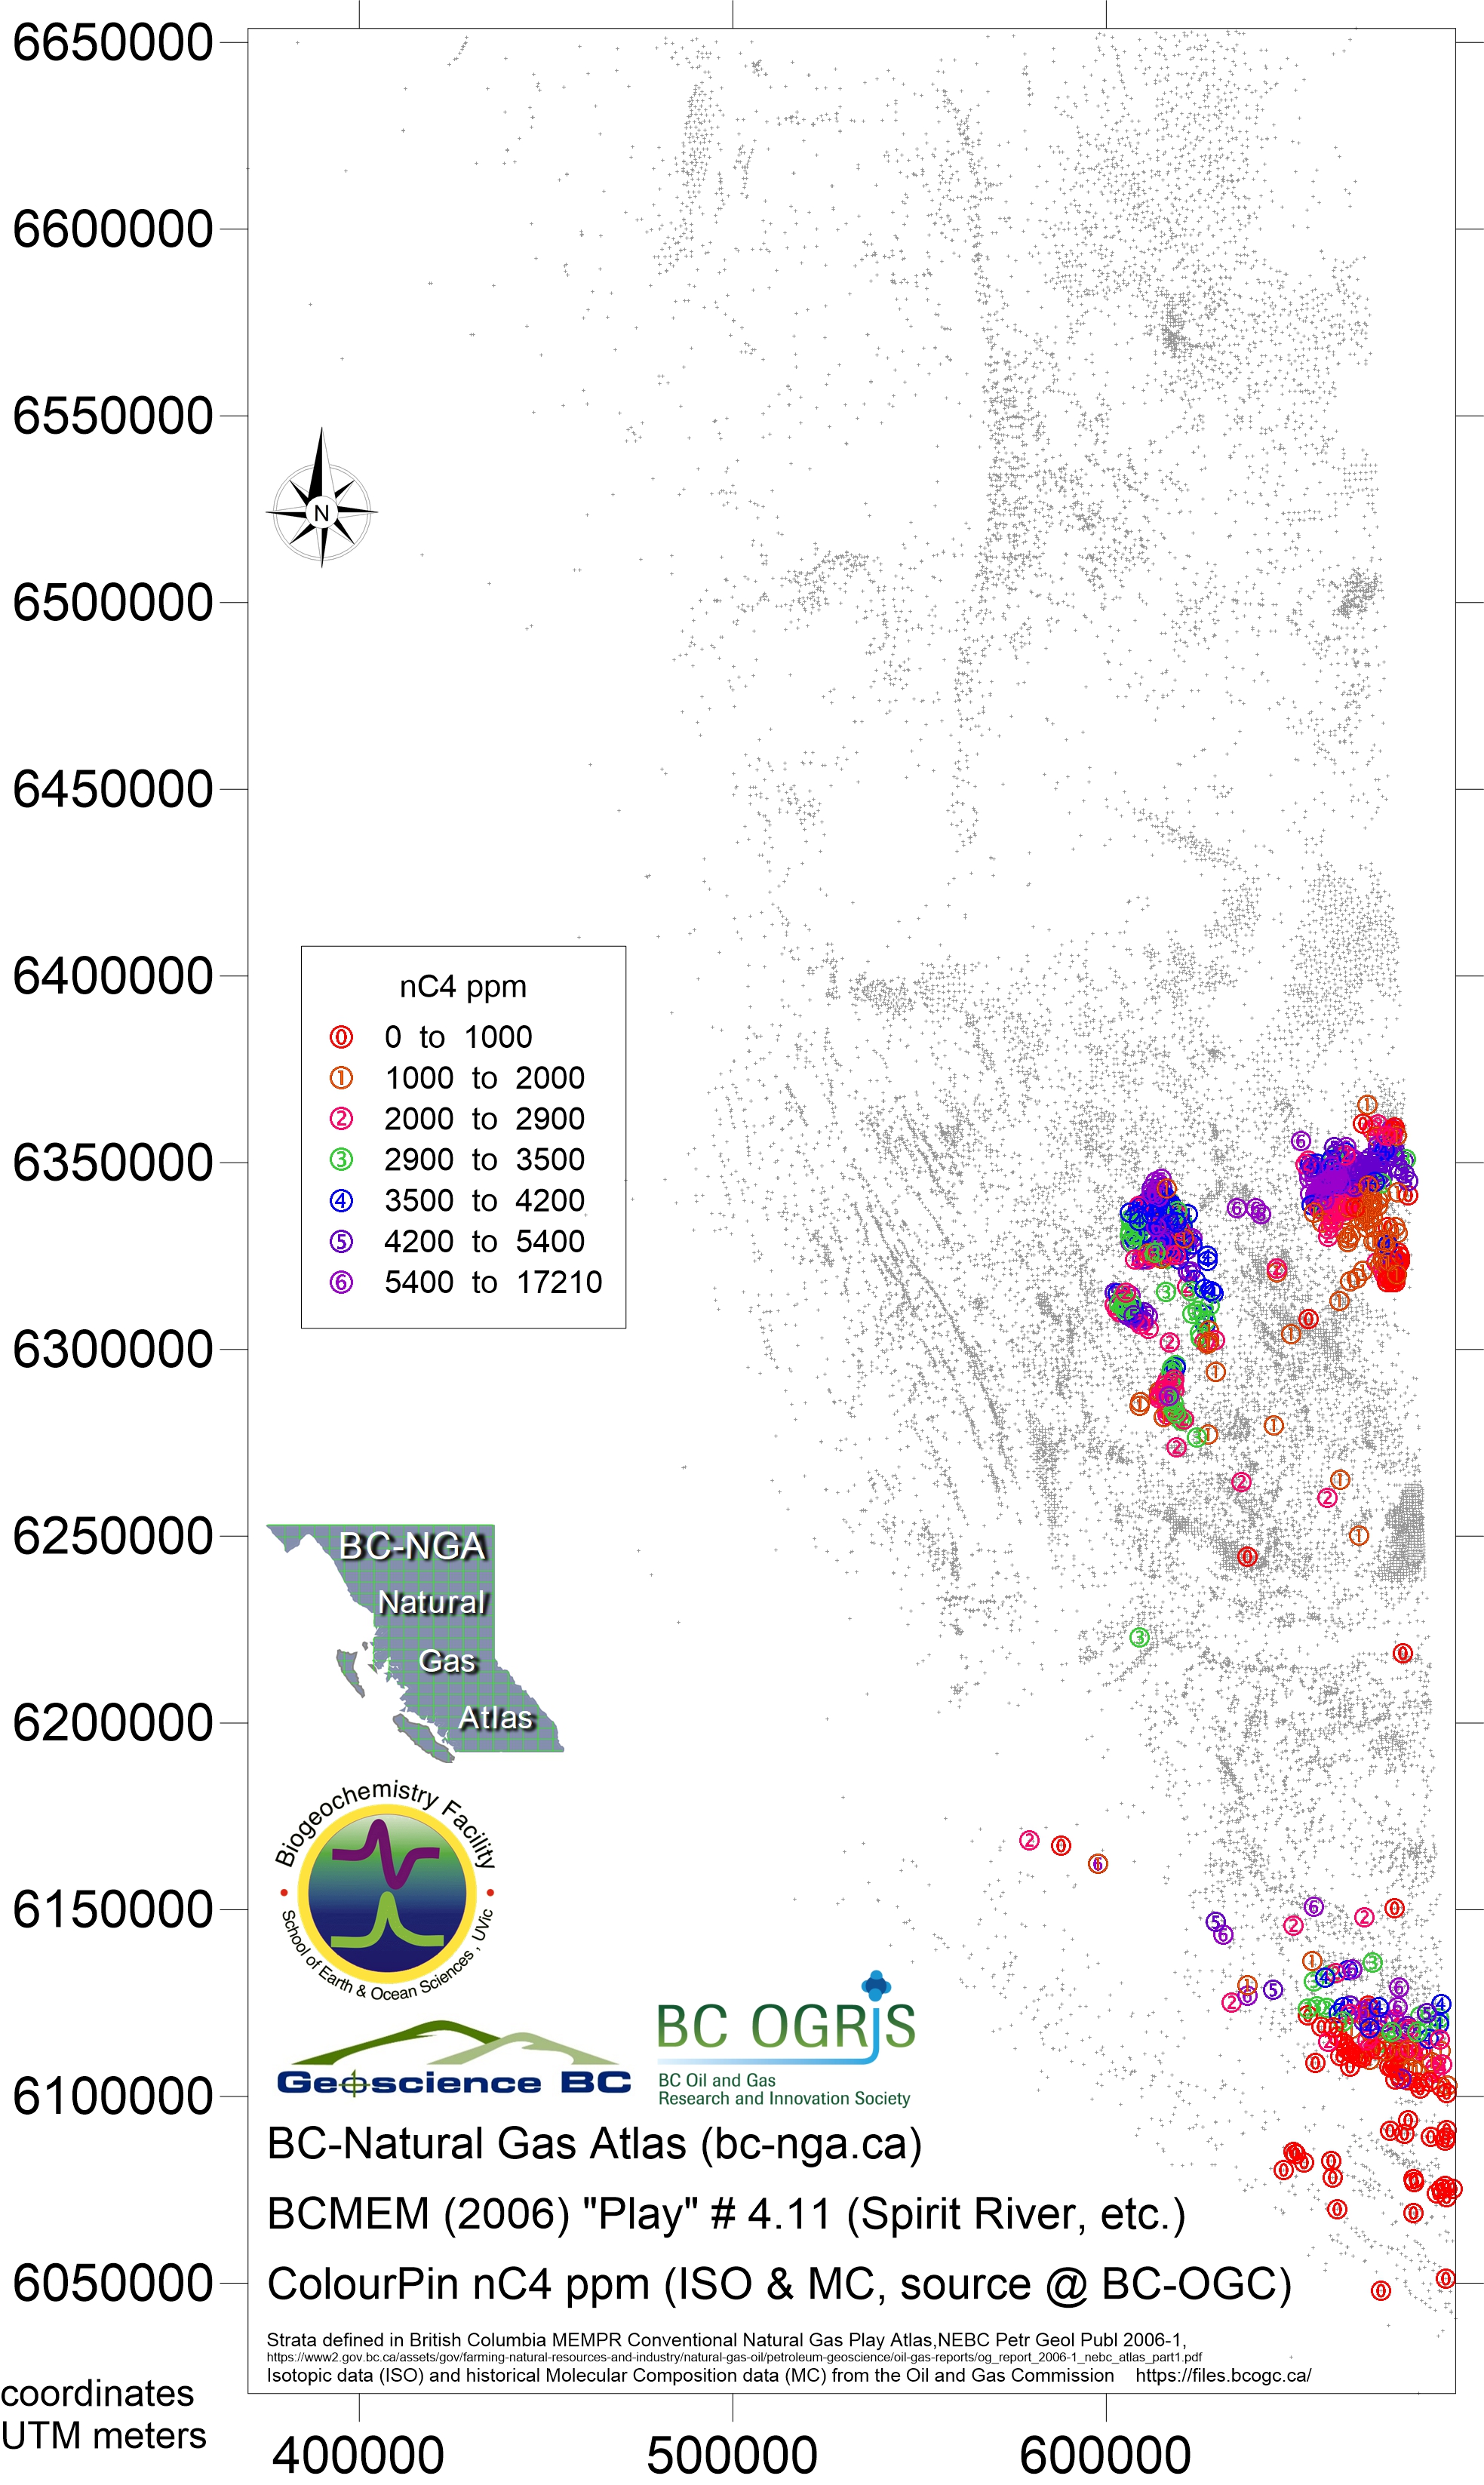
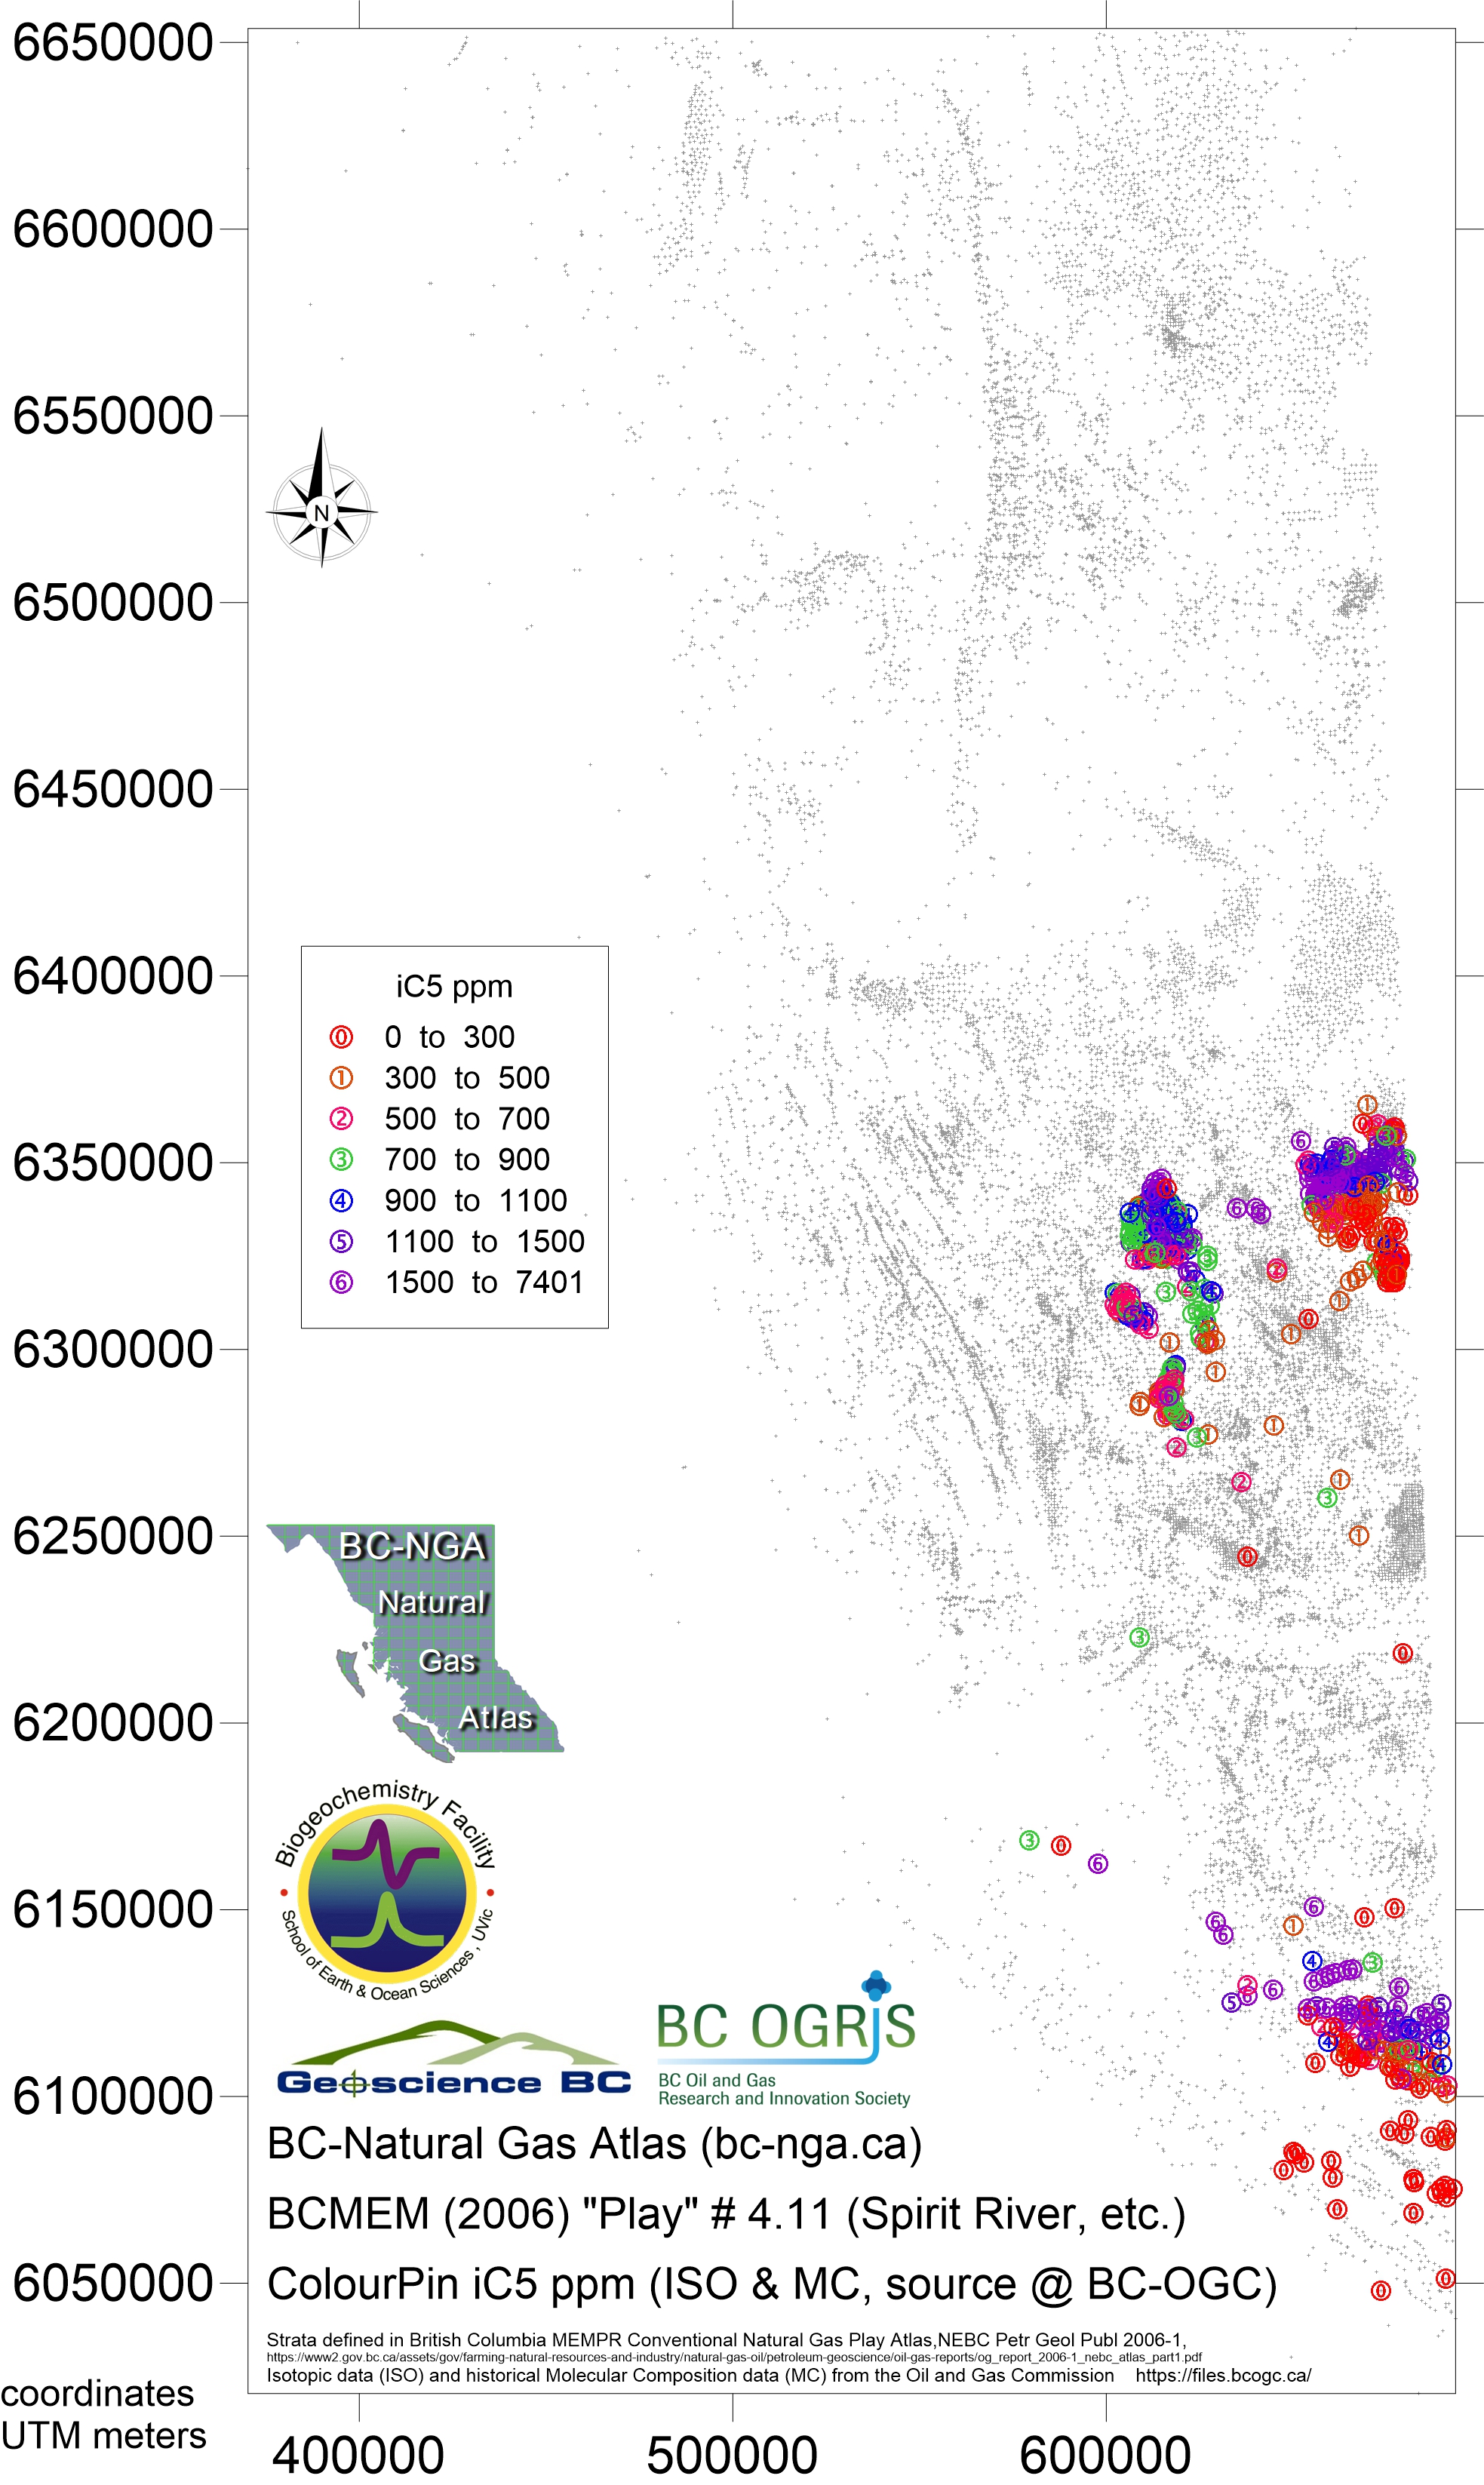
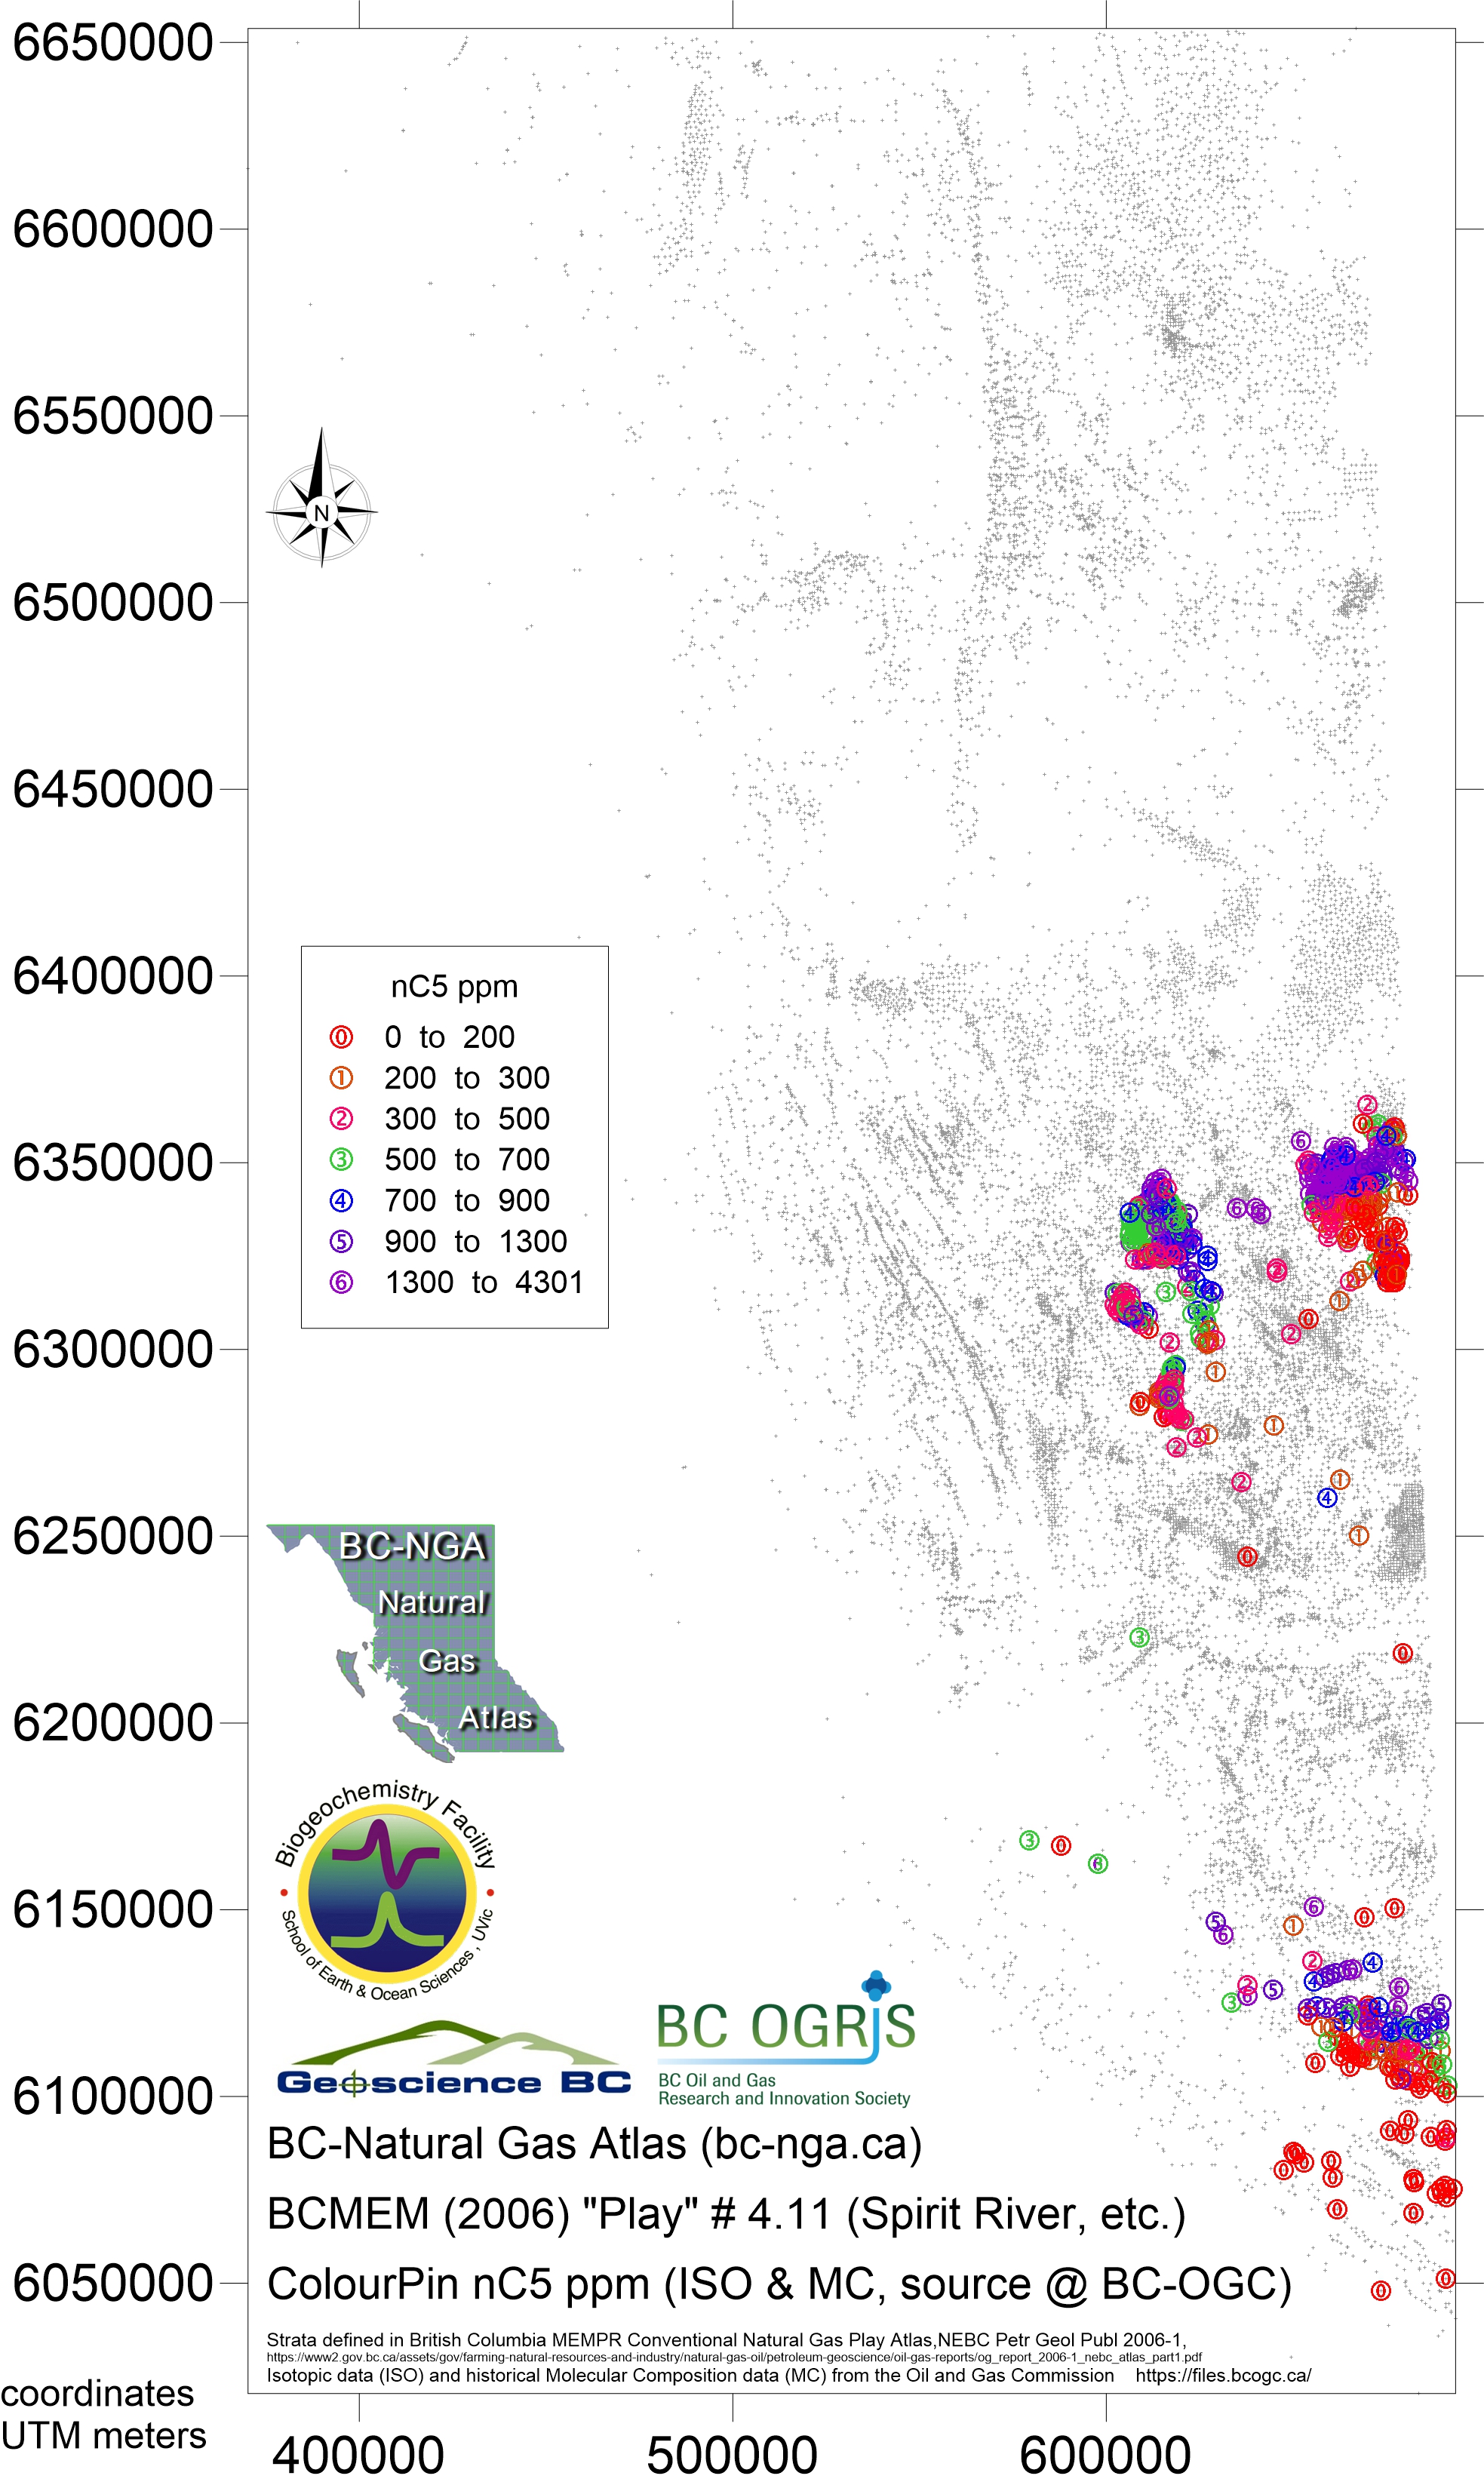
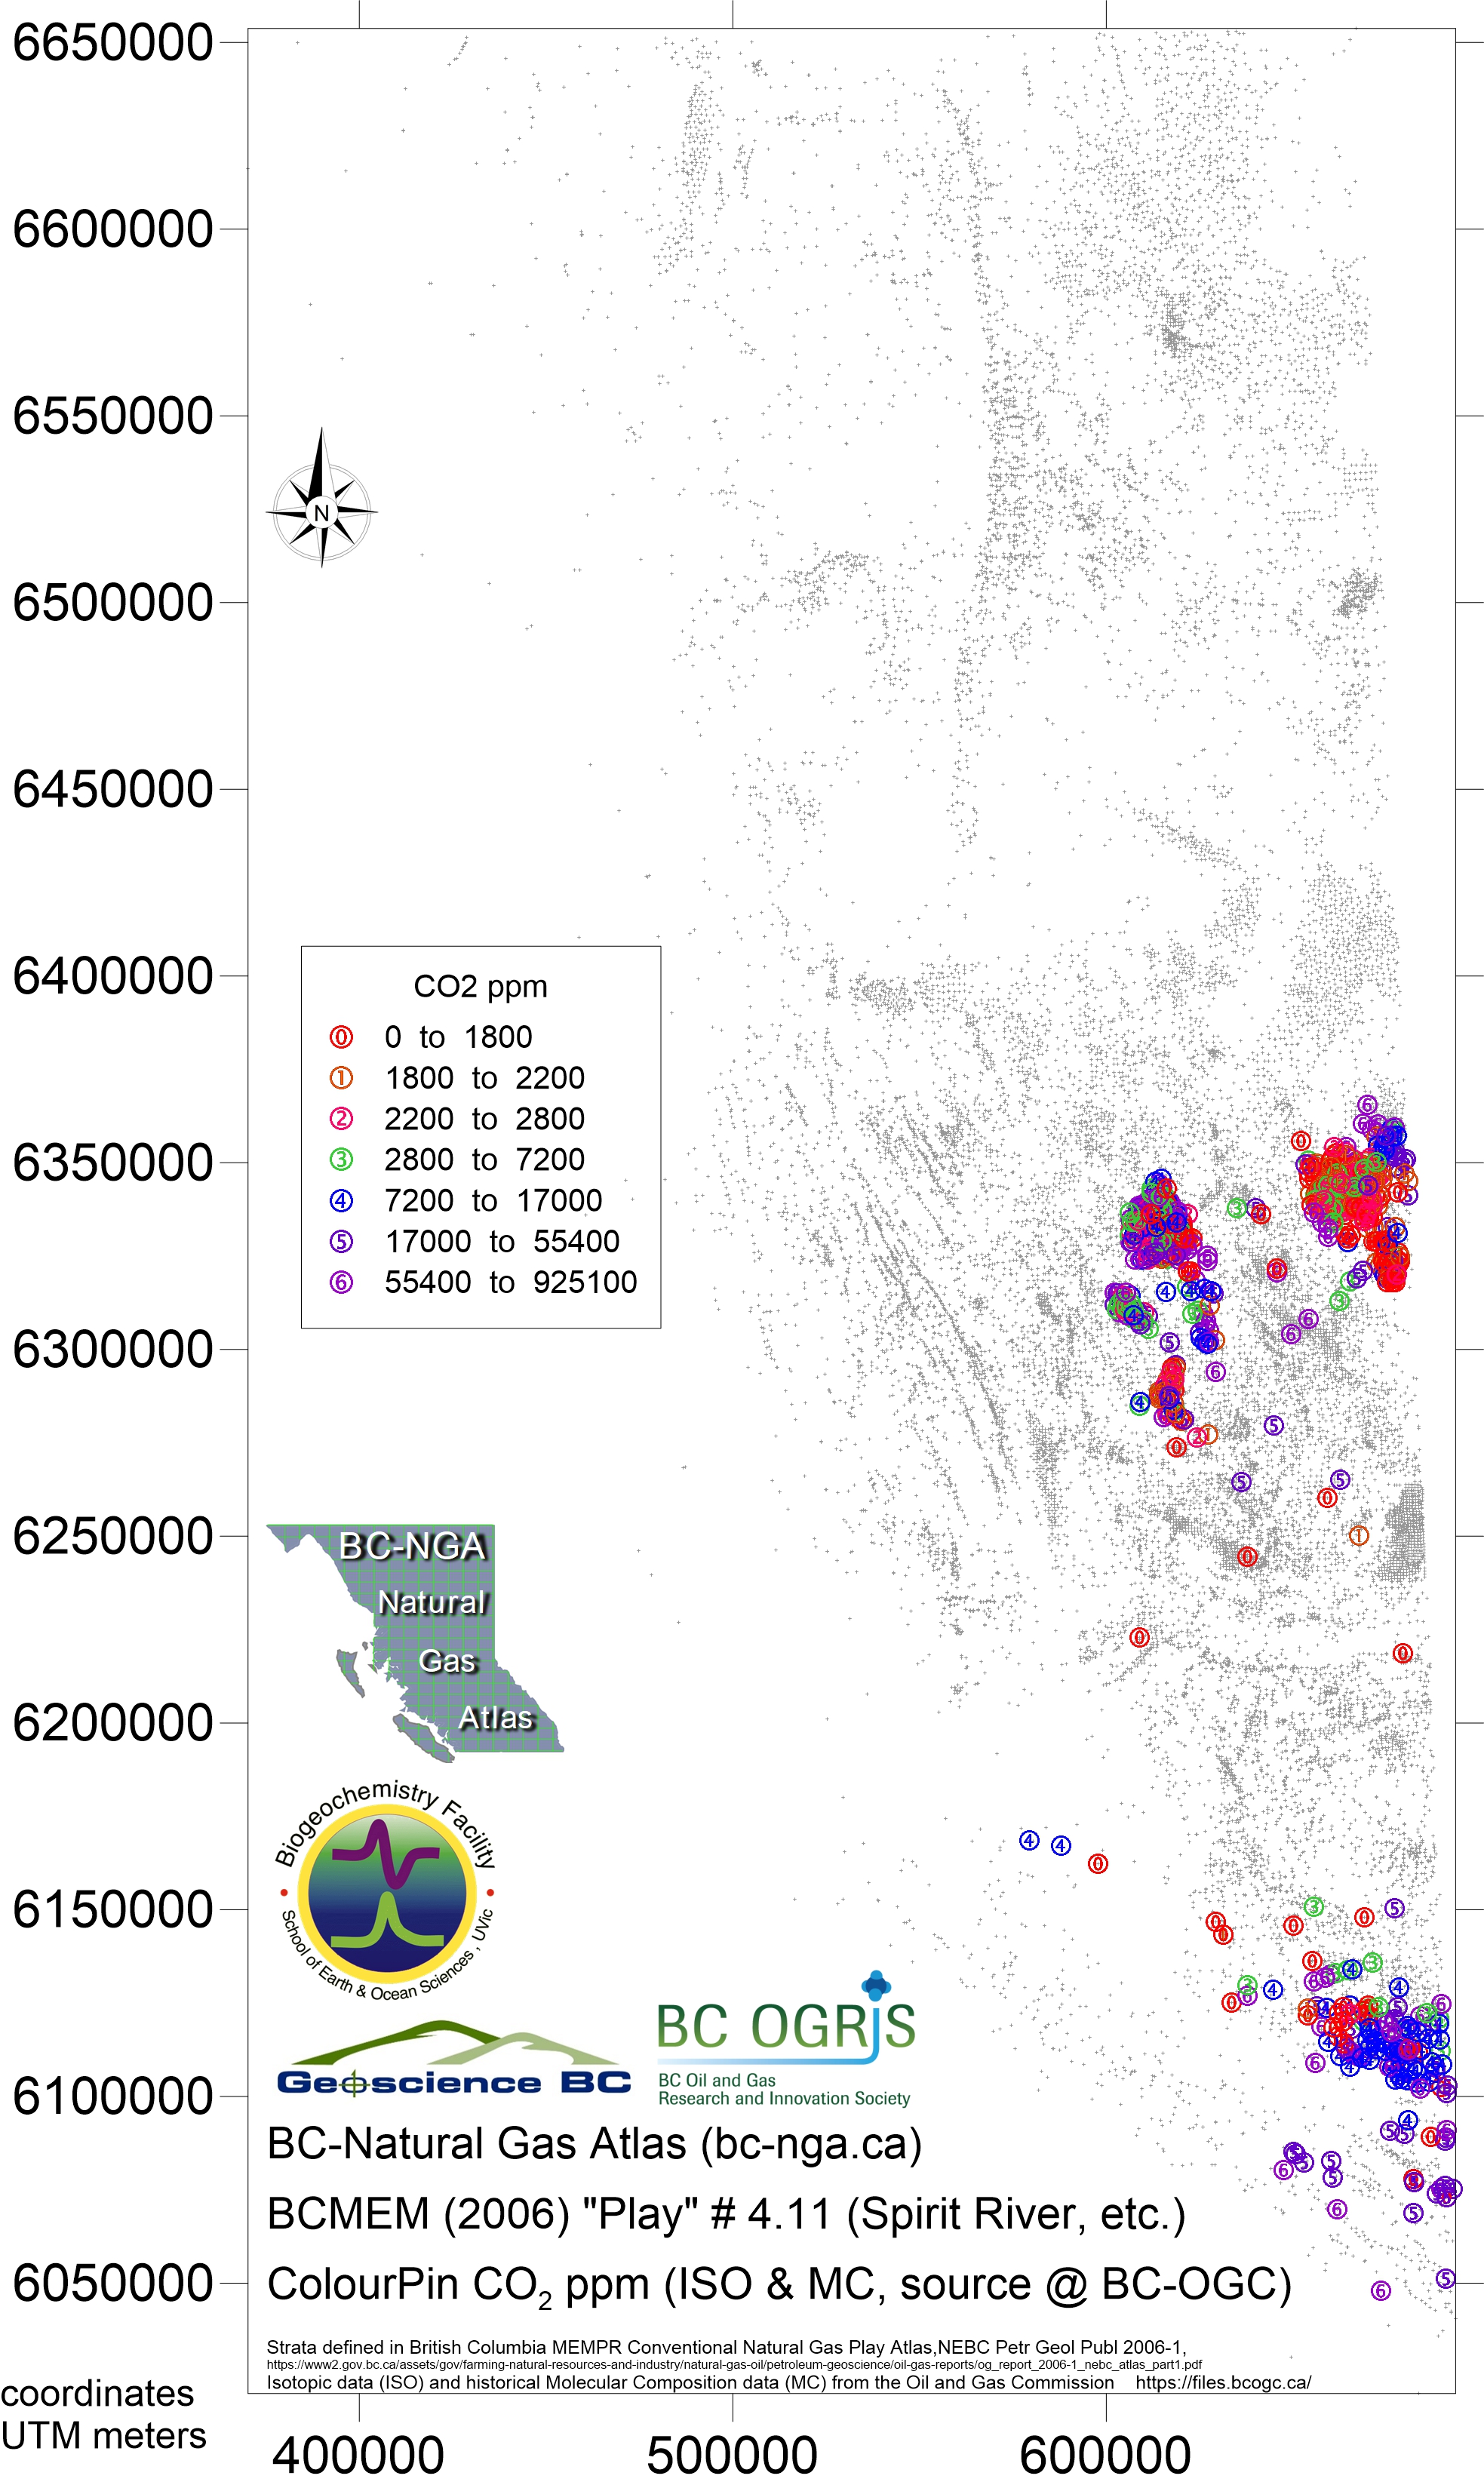
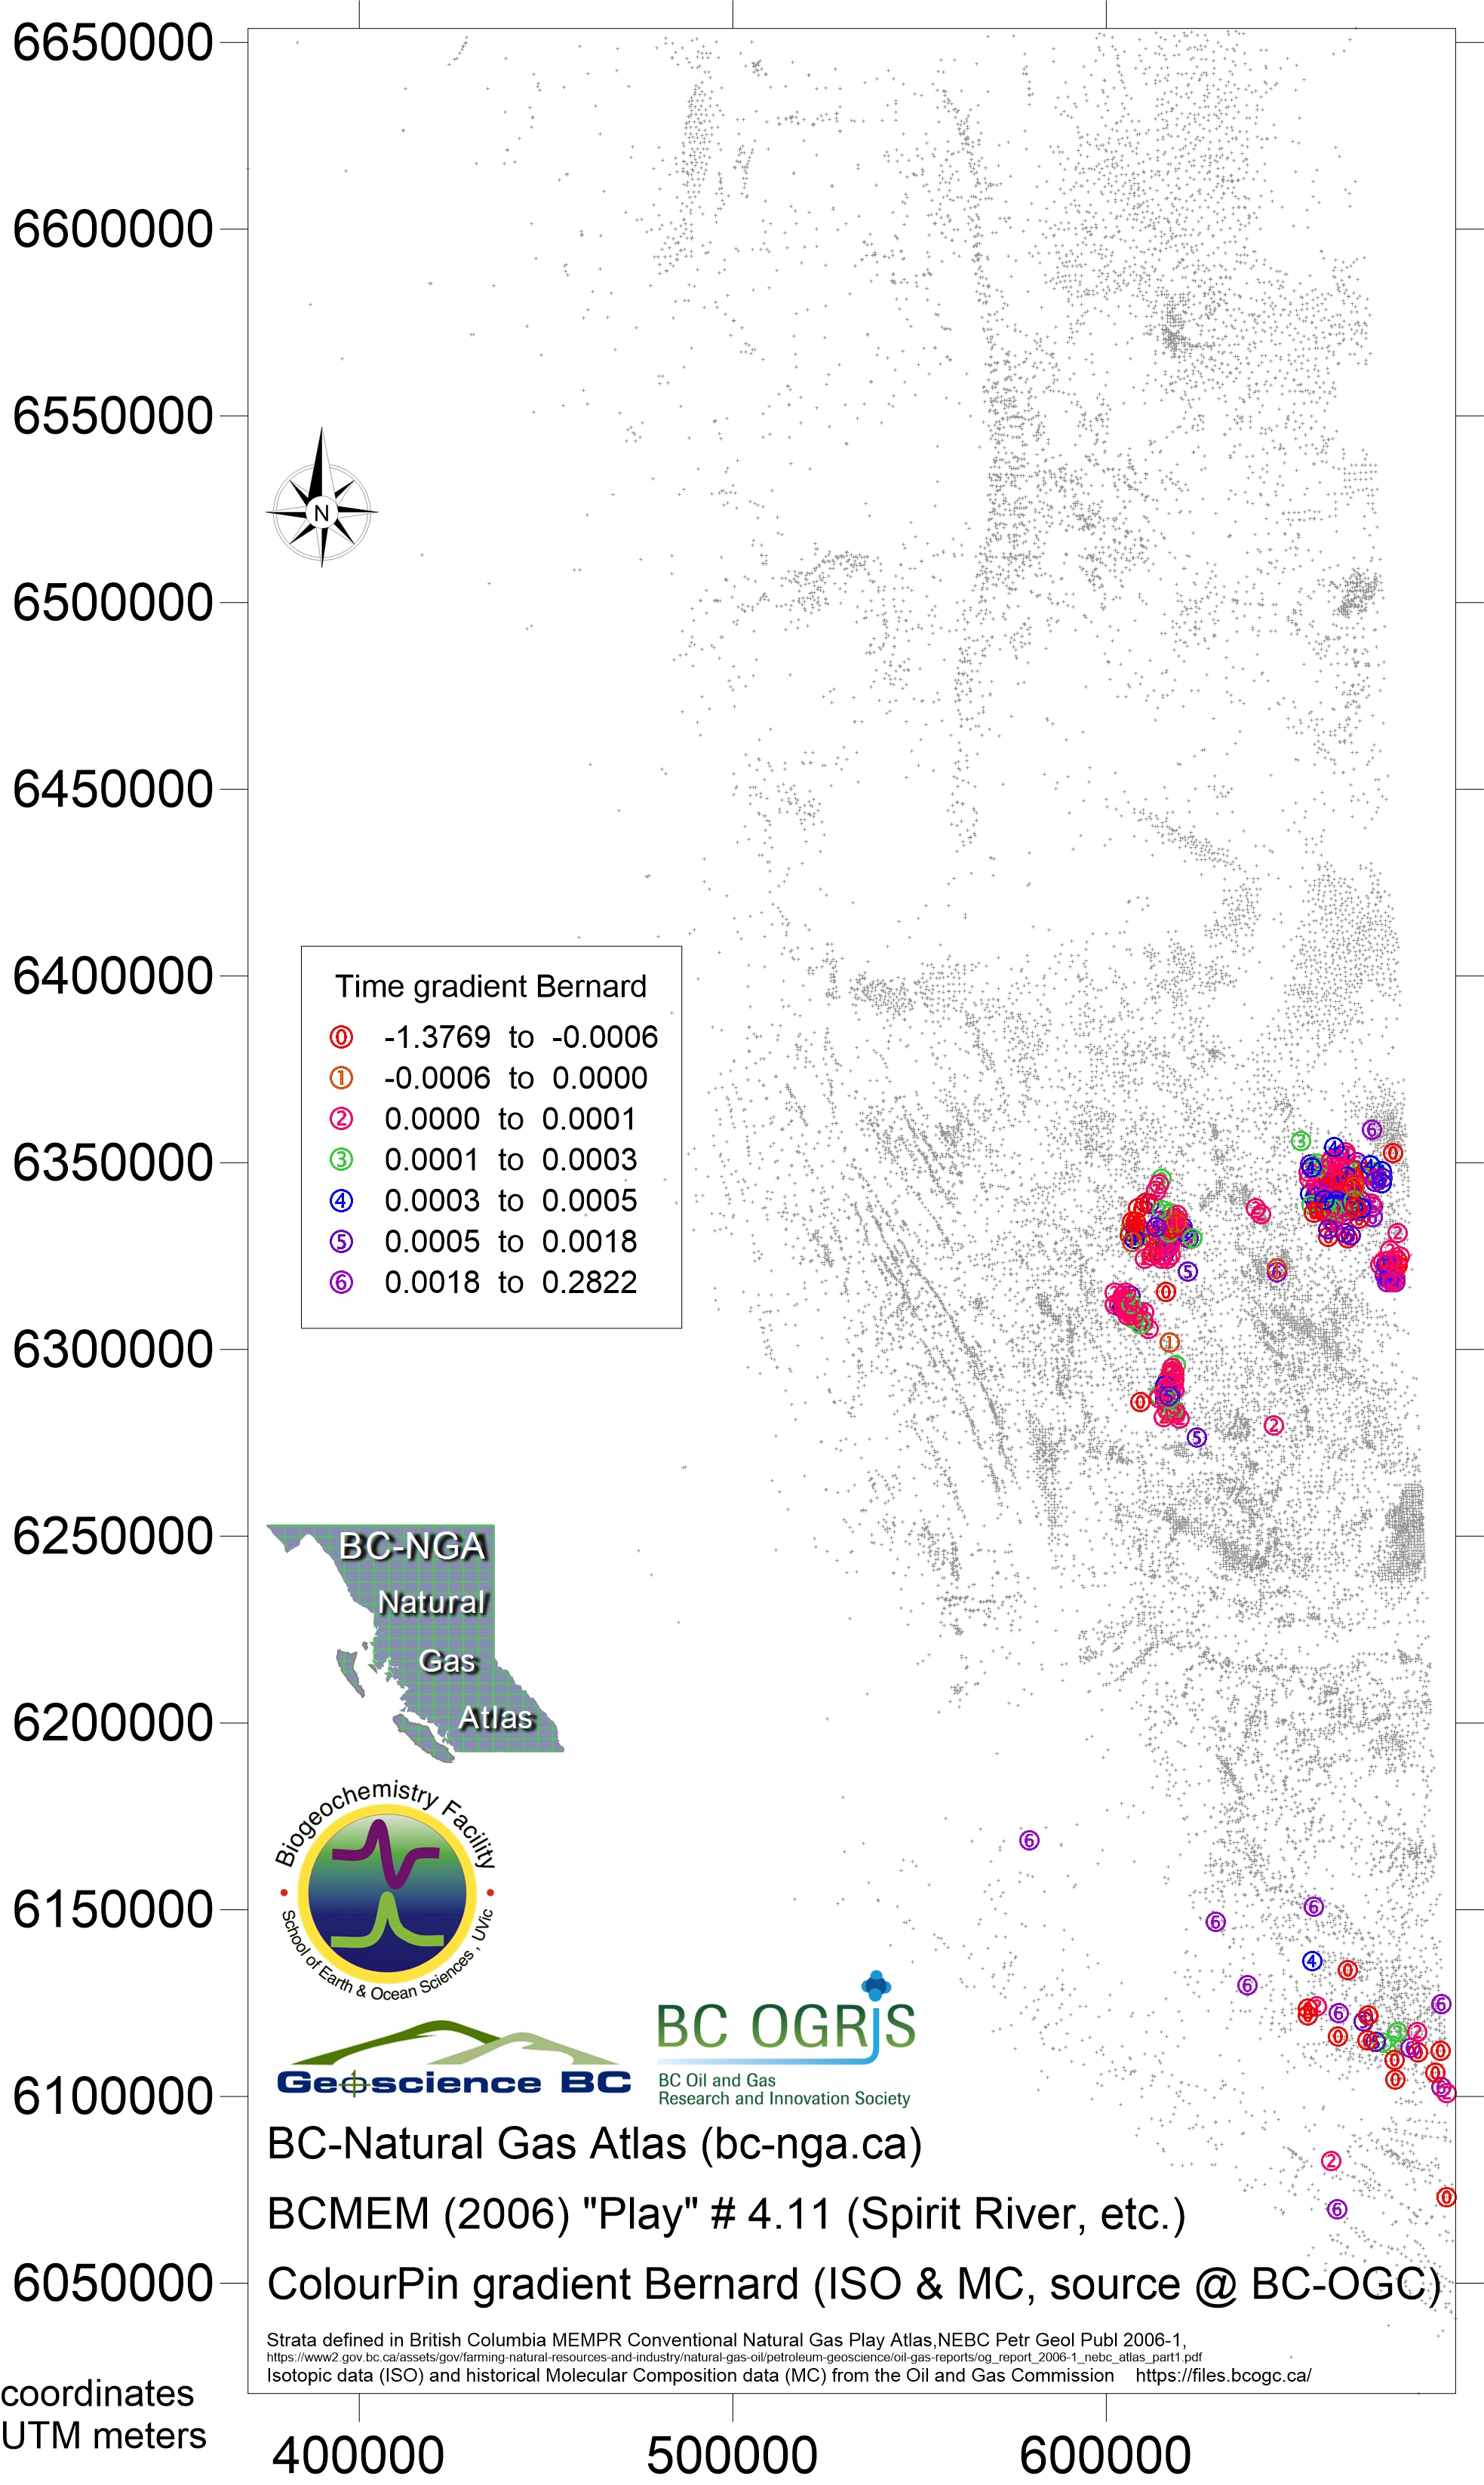
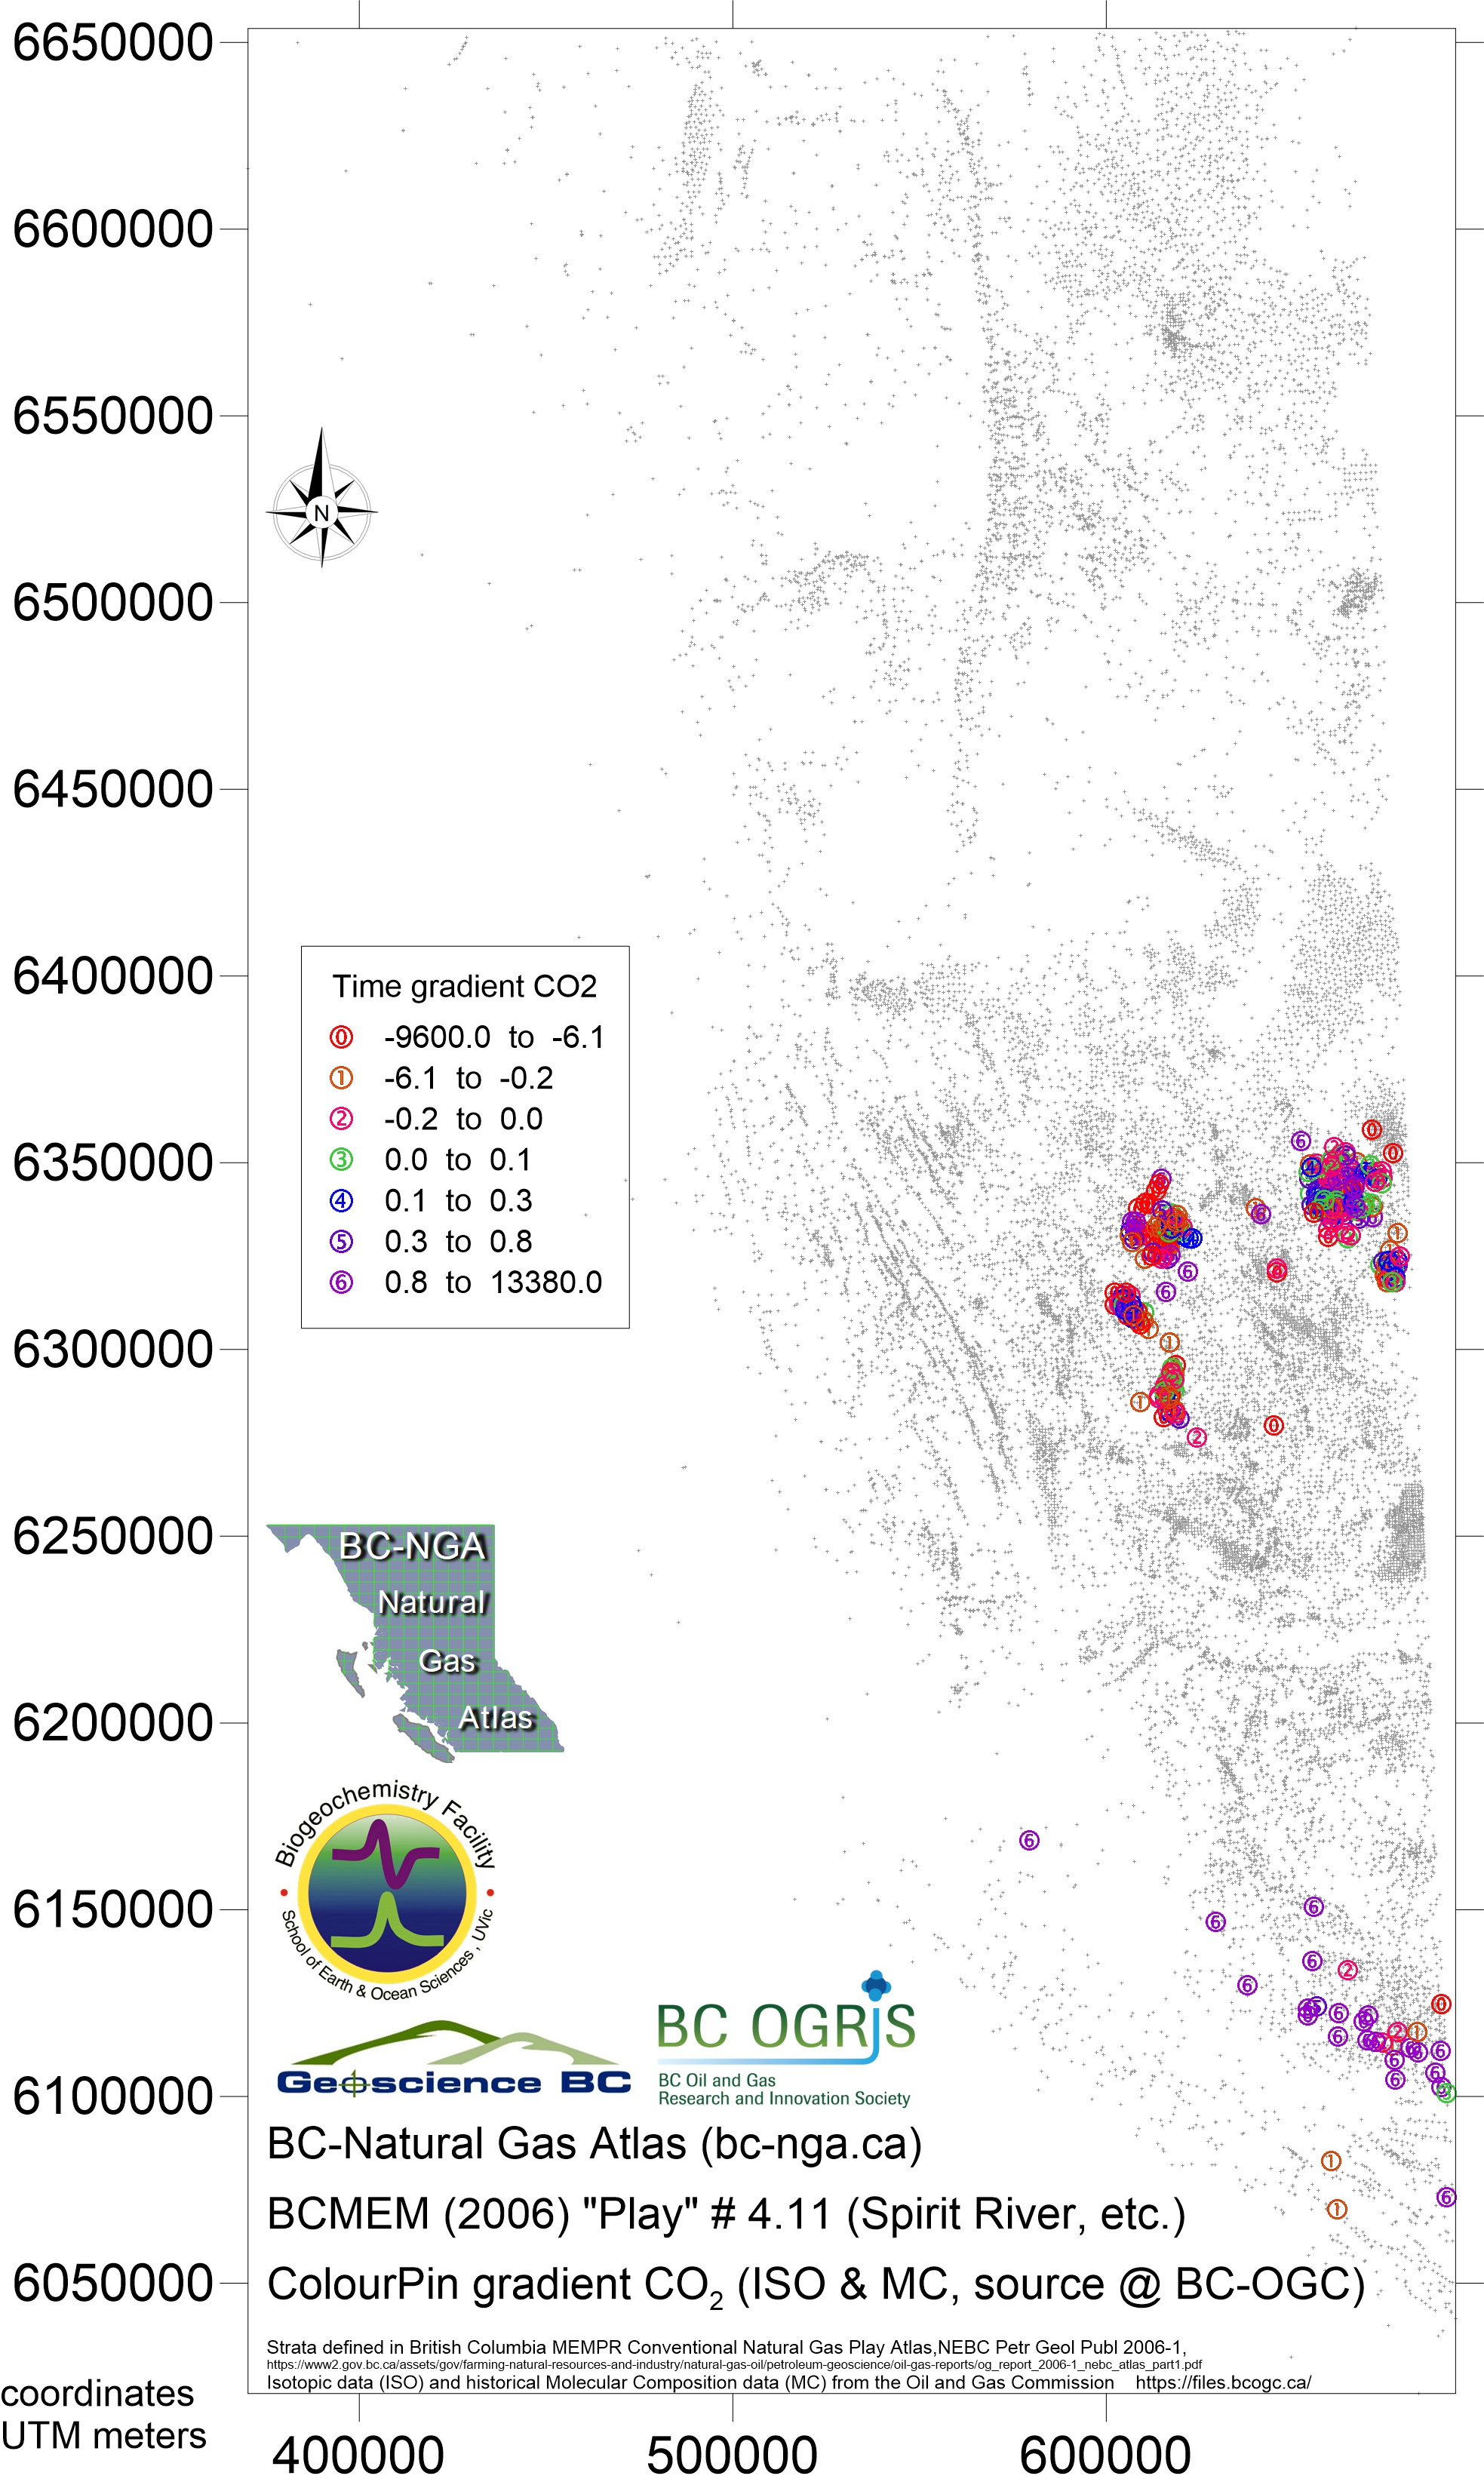
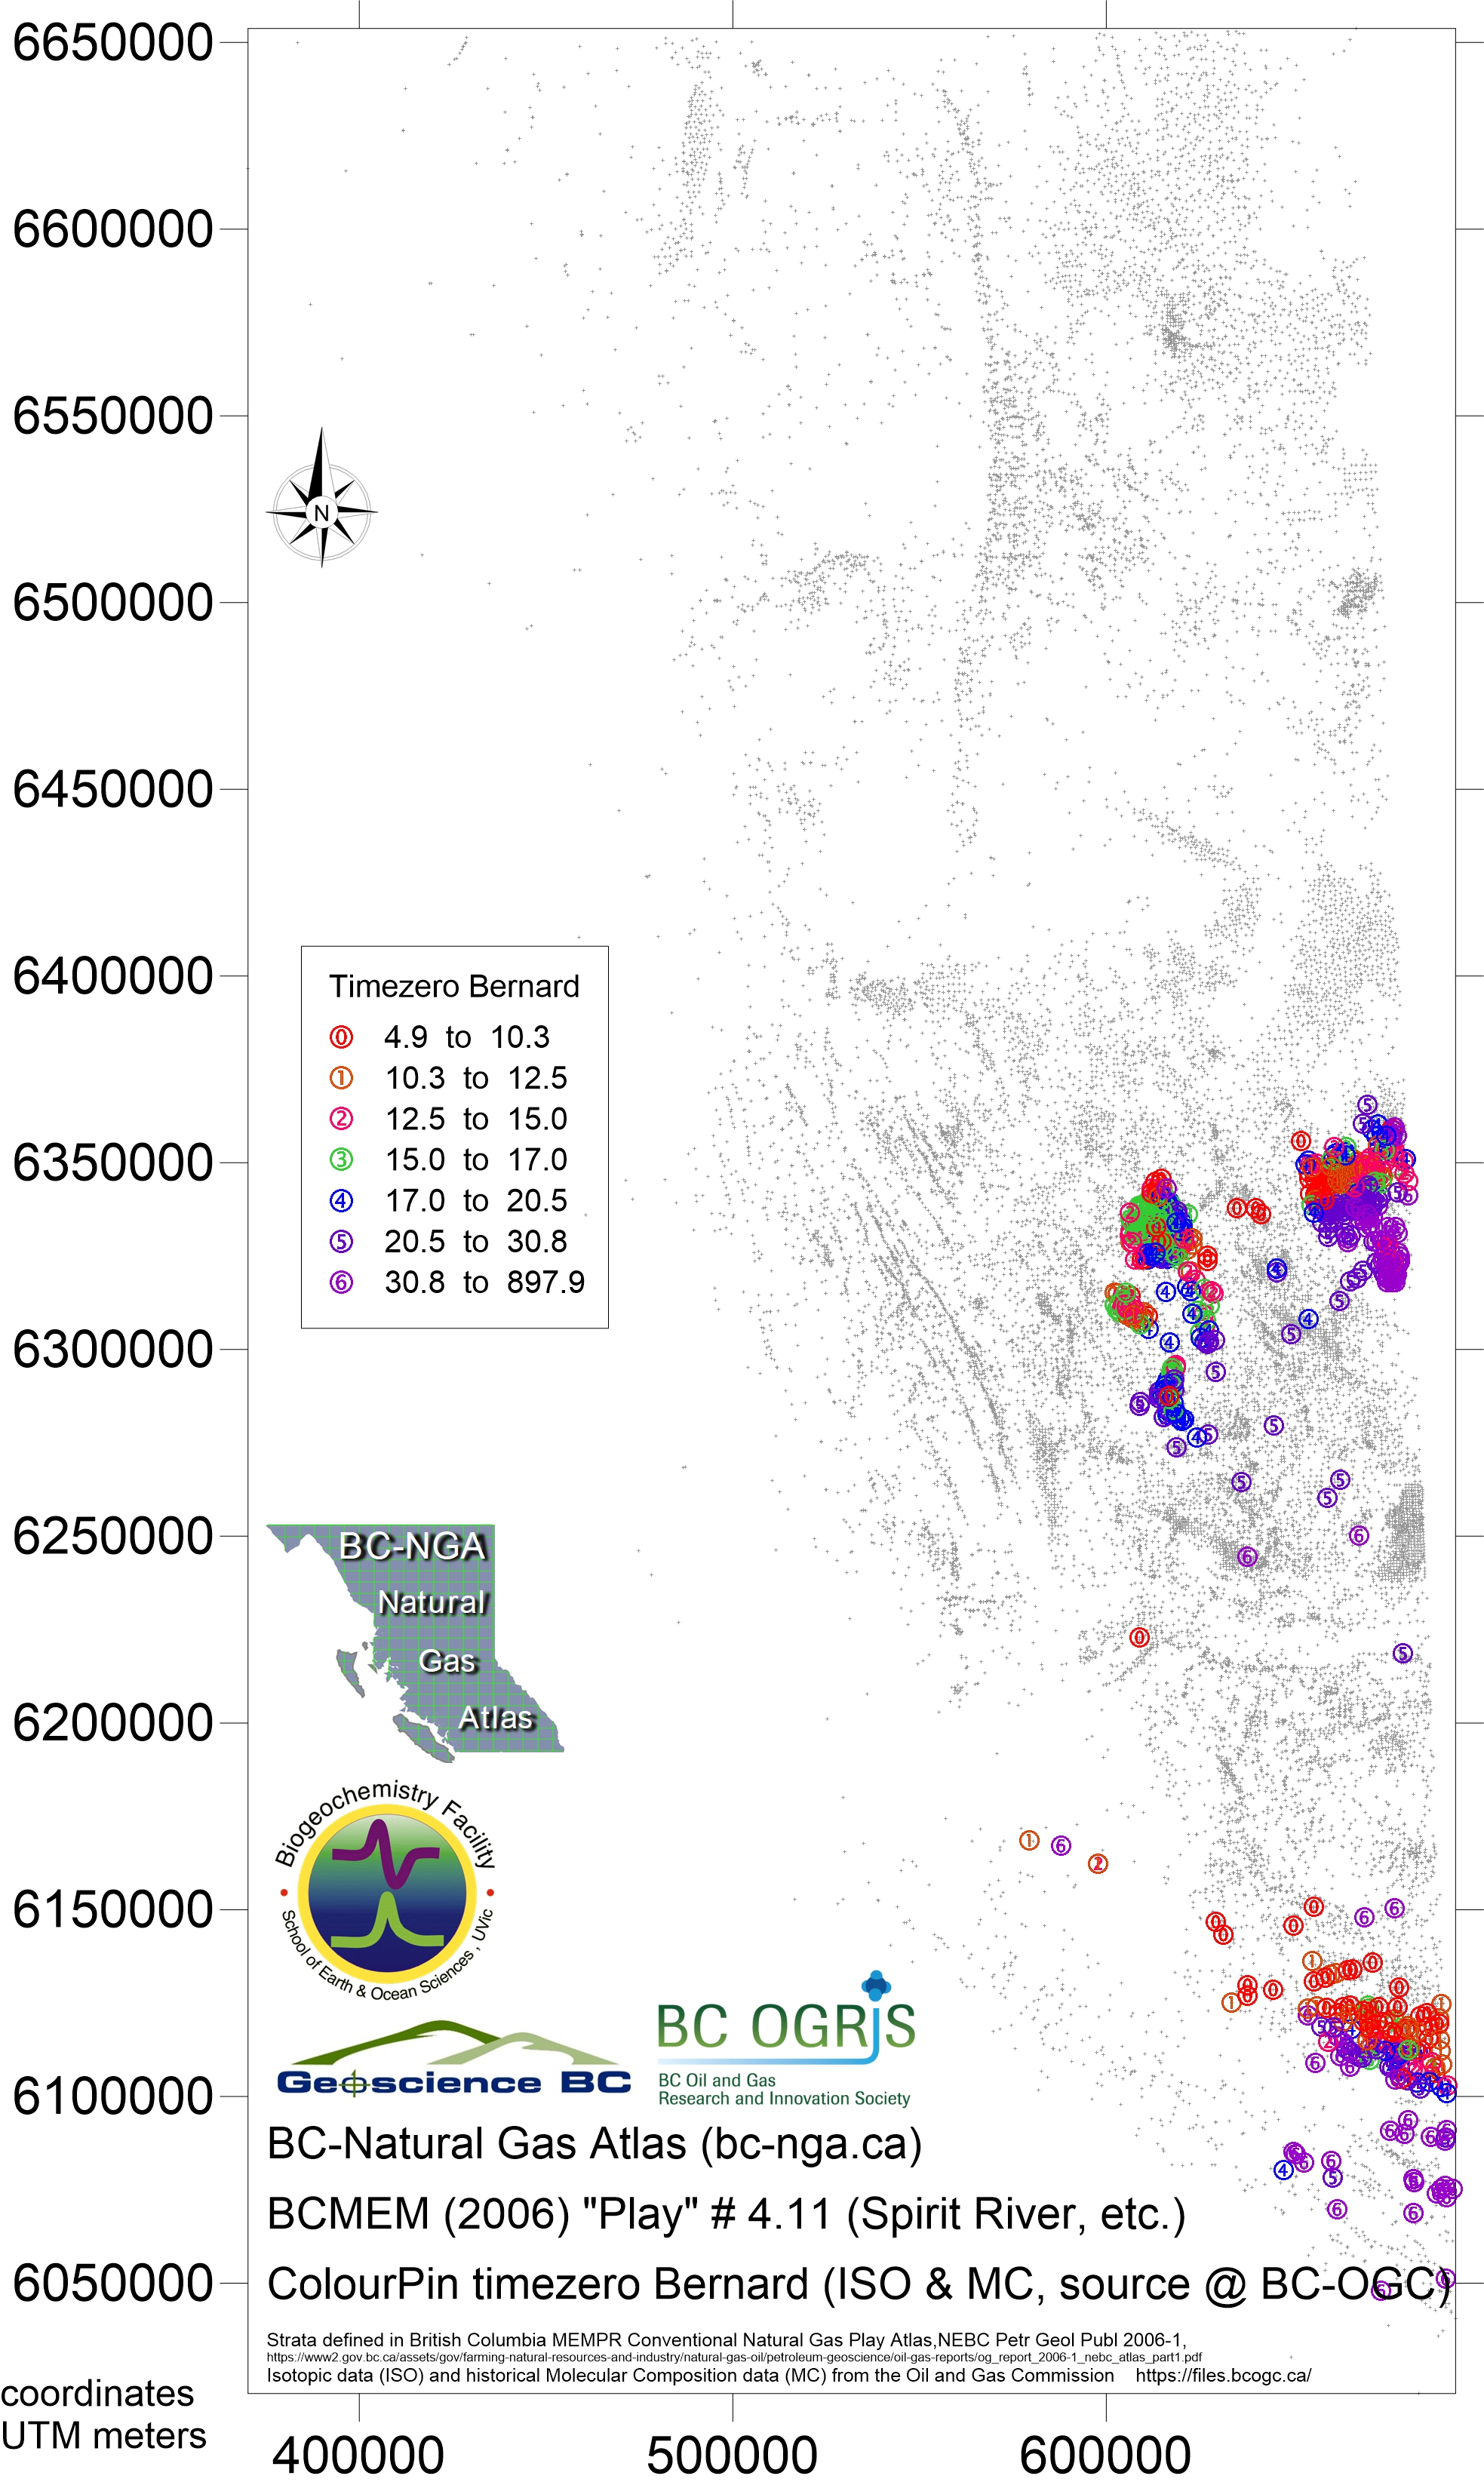
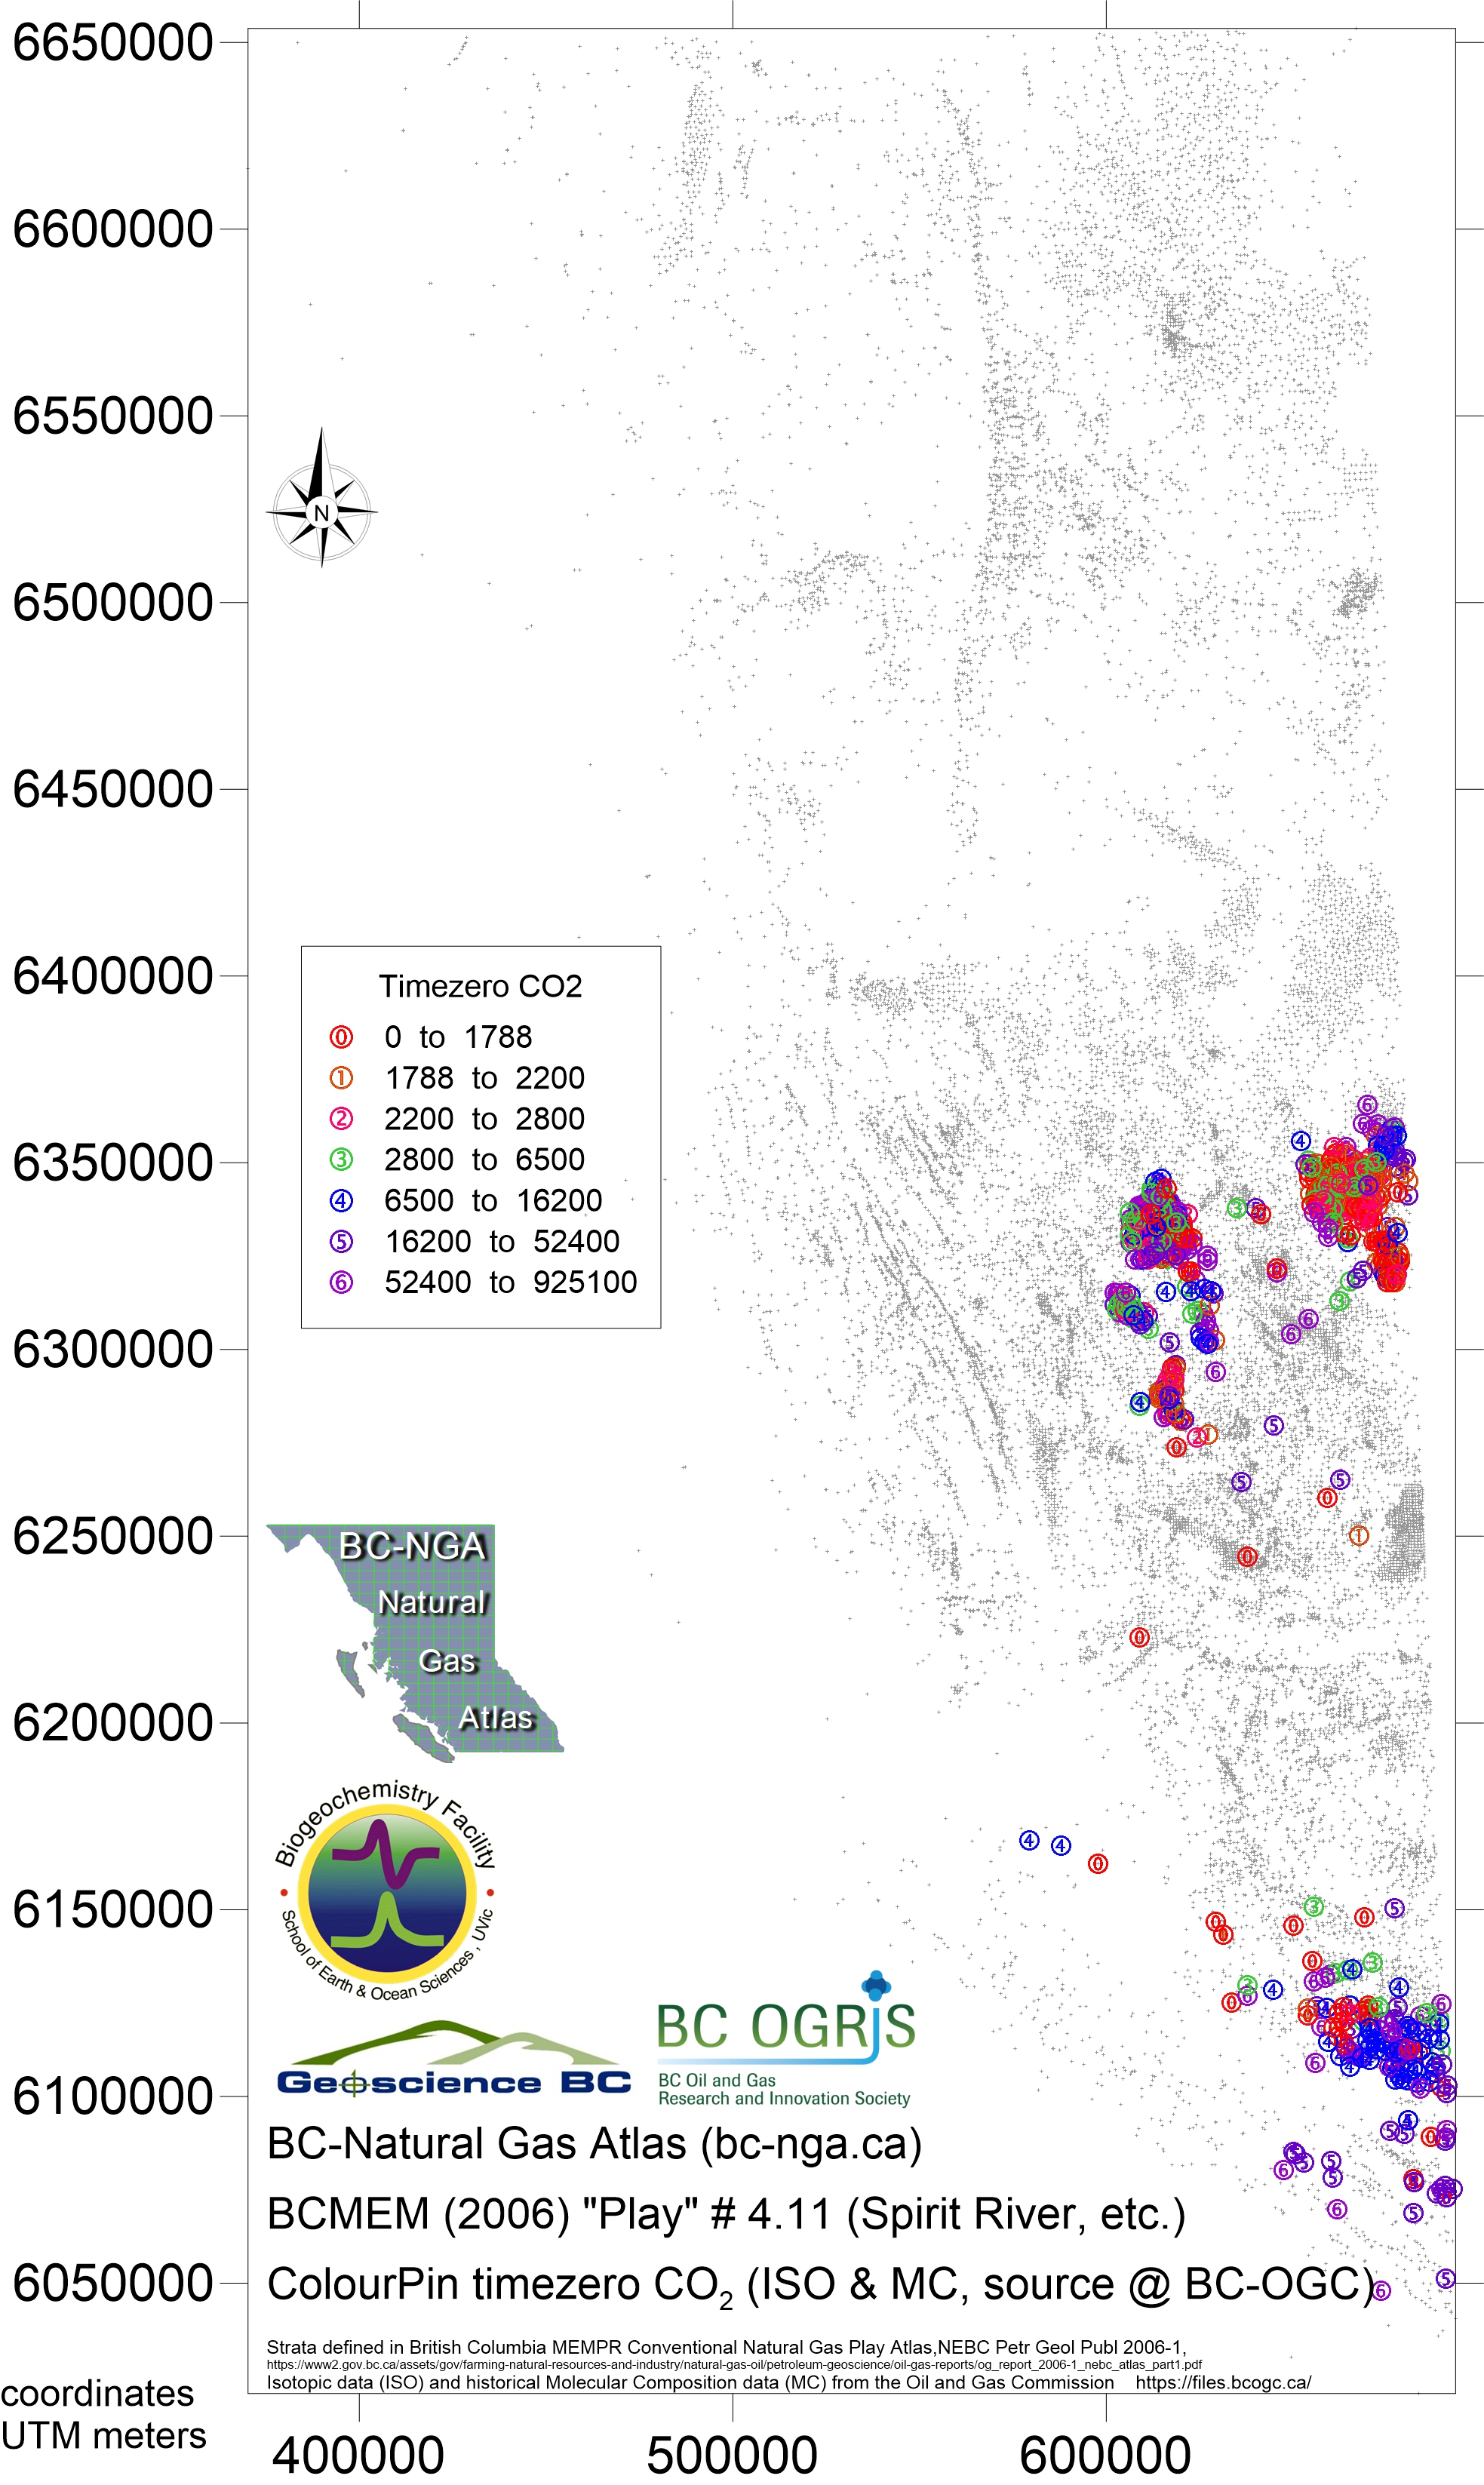
Play 4.11 Spirit River and Peace River Formations and equivalents
(including Notikewin and Fahler Members)
- Map036 Nov 2018 play 4.11 Spirit/Peace/Fahler eqv Bernard ratio
- Map037 Nov 2018 play 4.11 Spirit/Peace/Fahler eqv dryness ratio
- Map038 Nov 2018 play 4.11 Spirit/Peace/Fahler eqv iC4nC4 ratio
- Map039 Nov 2018 play 4.11 Spirit/Peace/Fahler eqv H2S ppm
- Map040 Nov 2018 play 4.11 Spirit/Peace/Fahler eqv CH4 ppm
- Map041 Nov 2018 play 4.11 Spirit/Peace/Fahler eqv C2H6 ppm
- Map042 Nov 2018 play 4.11 Spirit/Peace/Fahler eqv C3H8 ppm
- Map043 Nov 2018 play 4.11 Spirit/Peace/Fahler eqv iC4H10 ppm
- Map044 Nov 2018 play 4.11 Spirit/Peace/Fahler eqv nC4H10 ppm
- Map045 Nov 2018 play 4.11 Spirit/Peace/Fahler eqv iC5H12 ppm
- Map046 Nov 2018 play 4.11 Spirit/Peace/Fahler eqv nC5H12 ppm
- Map047 Nov 2018 play 4.11 Spirit/Peace/Fahler eqv CO2 ppm
- Map048 Nov 2018 play 4.11 Spirit/Peace/Fahler eqv time series gradient Bernard ratio
- Map049 Nov 2018 play 4.11 Spirit/Peace/Fahler eqv time series gradient CO2
- Map050 Nov 2018 play 4.11 Spirit/Peace/Fahler eqv time series start point Bernard ratio
- Map051 Nov 2018 play 4.11 Spirit/Peace/Fahler eqv time series start point CO2
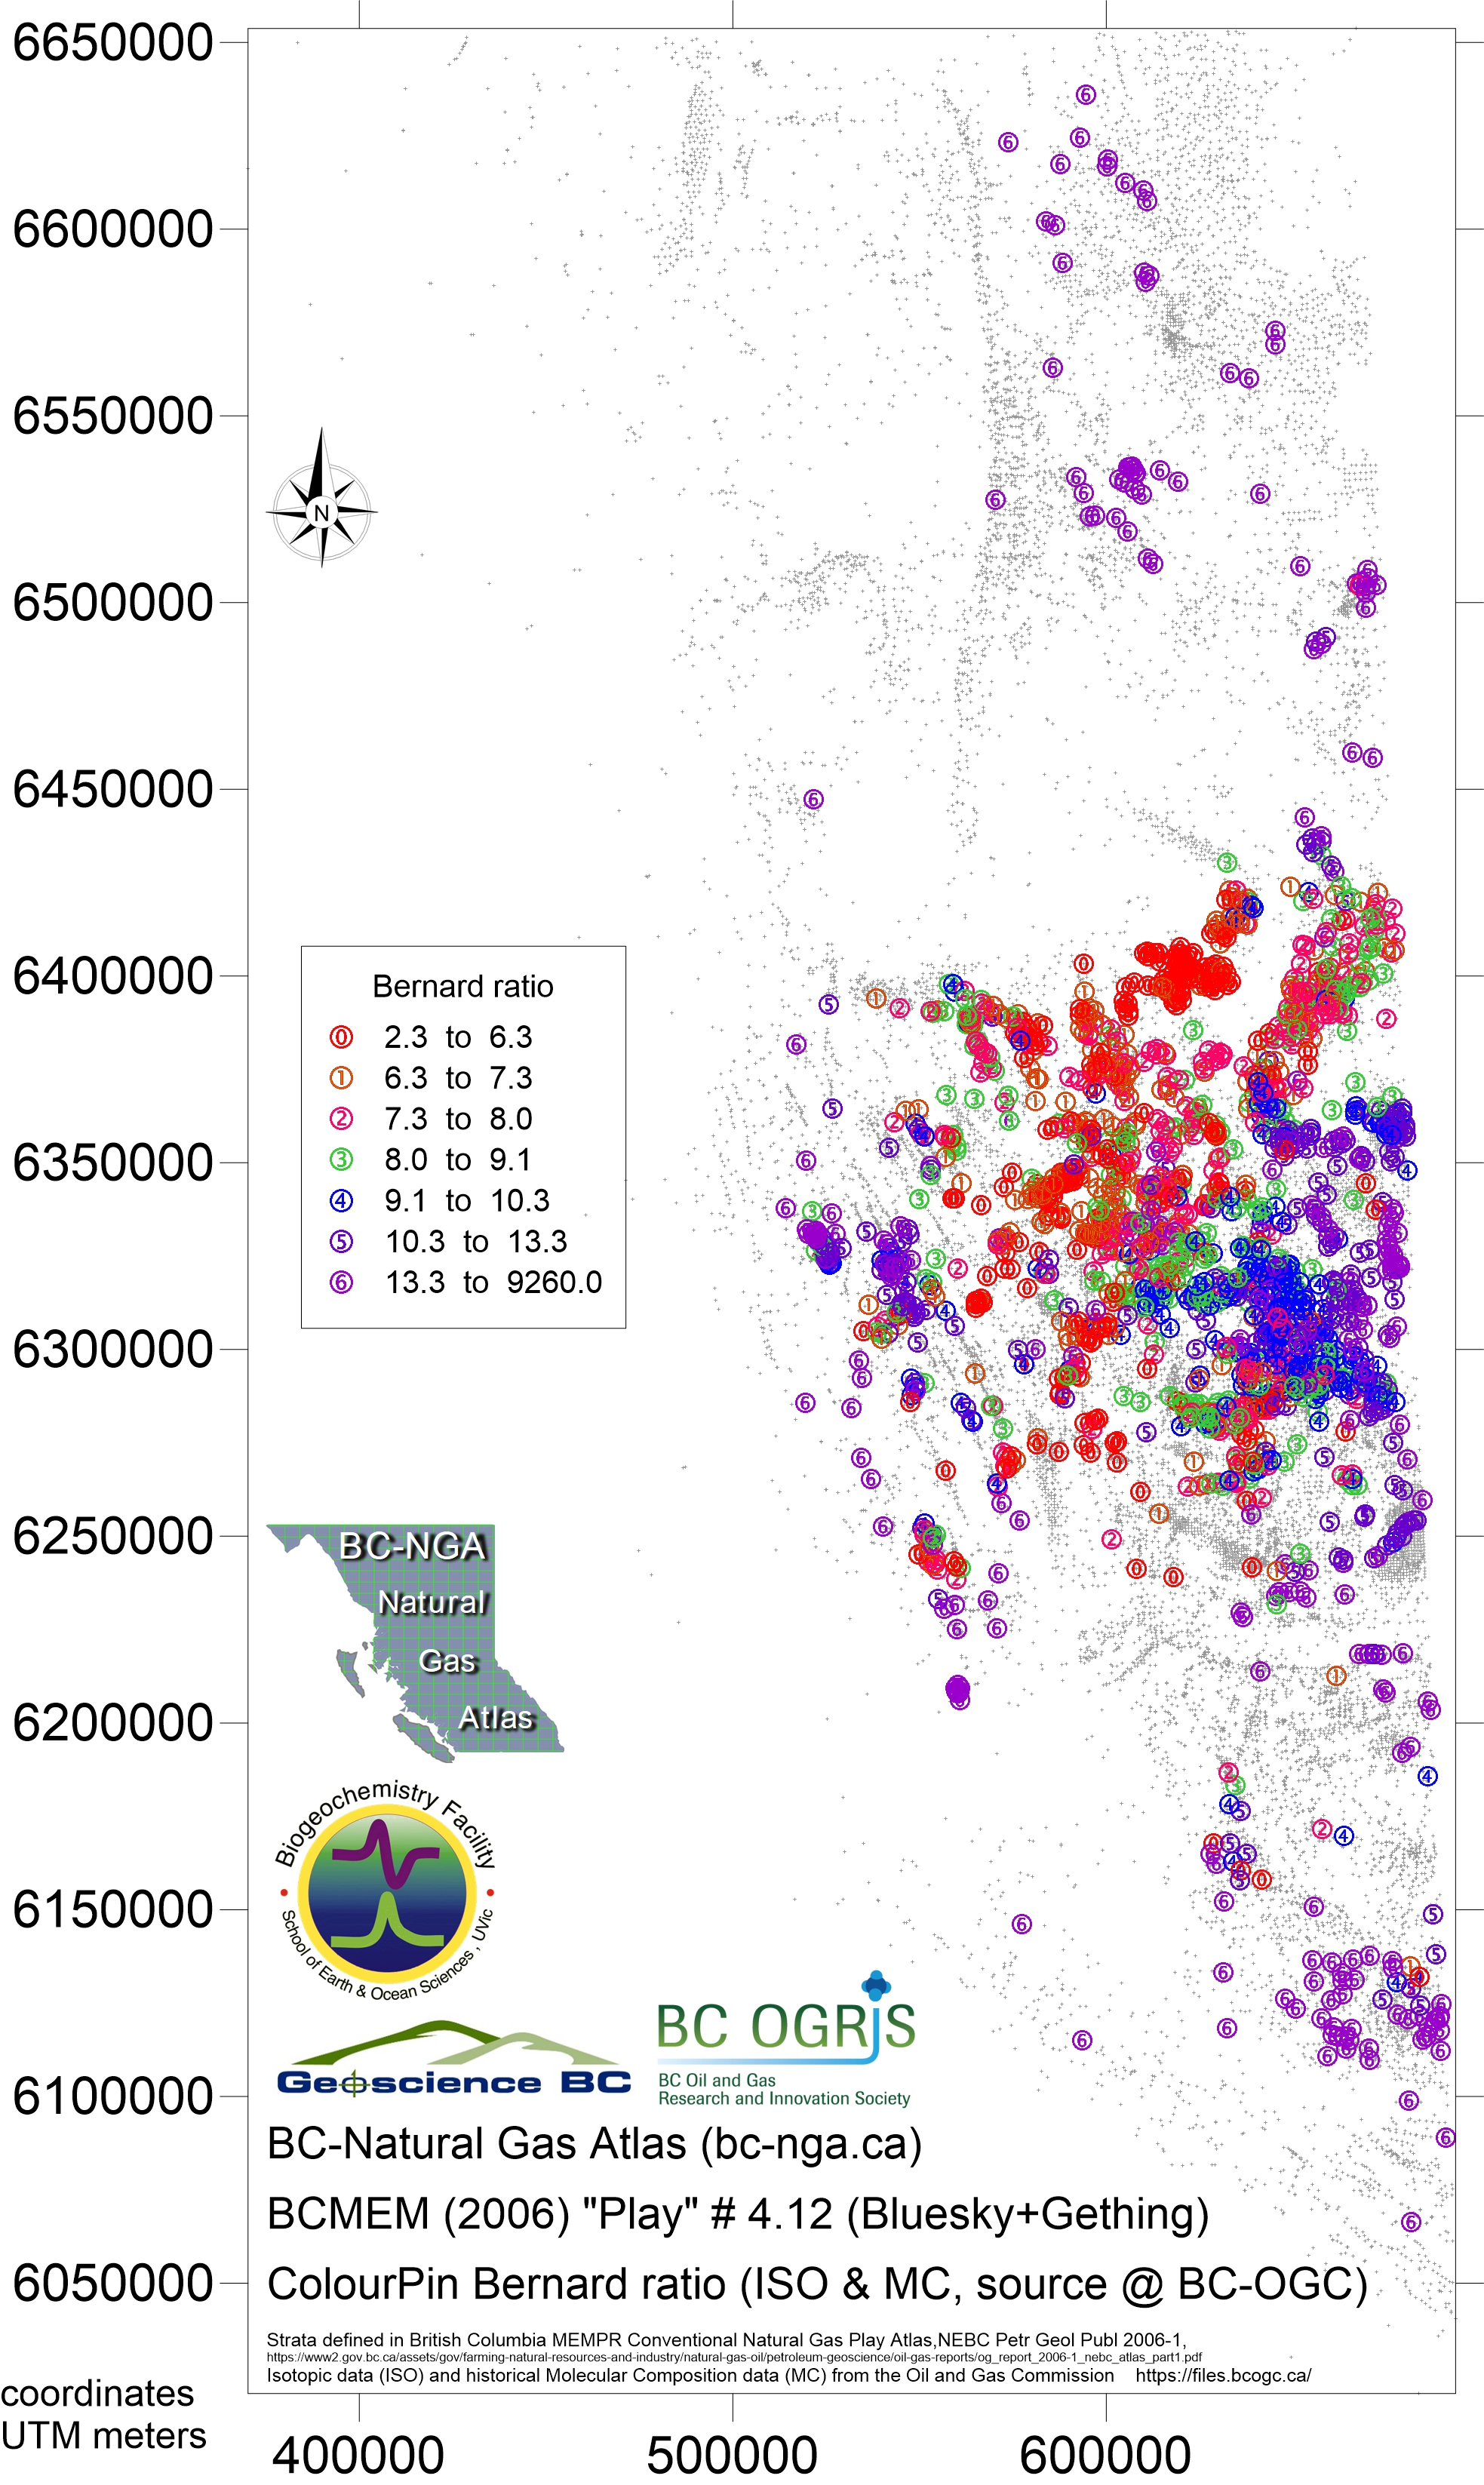
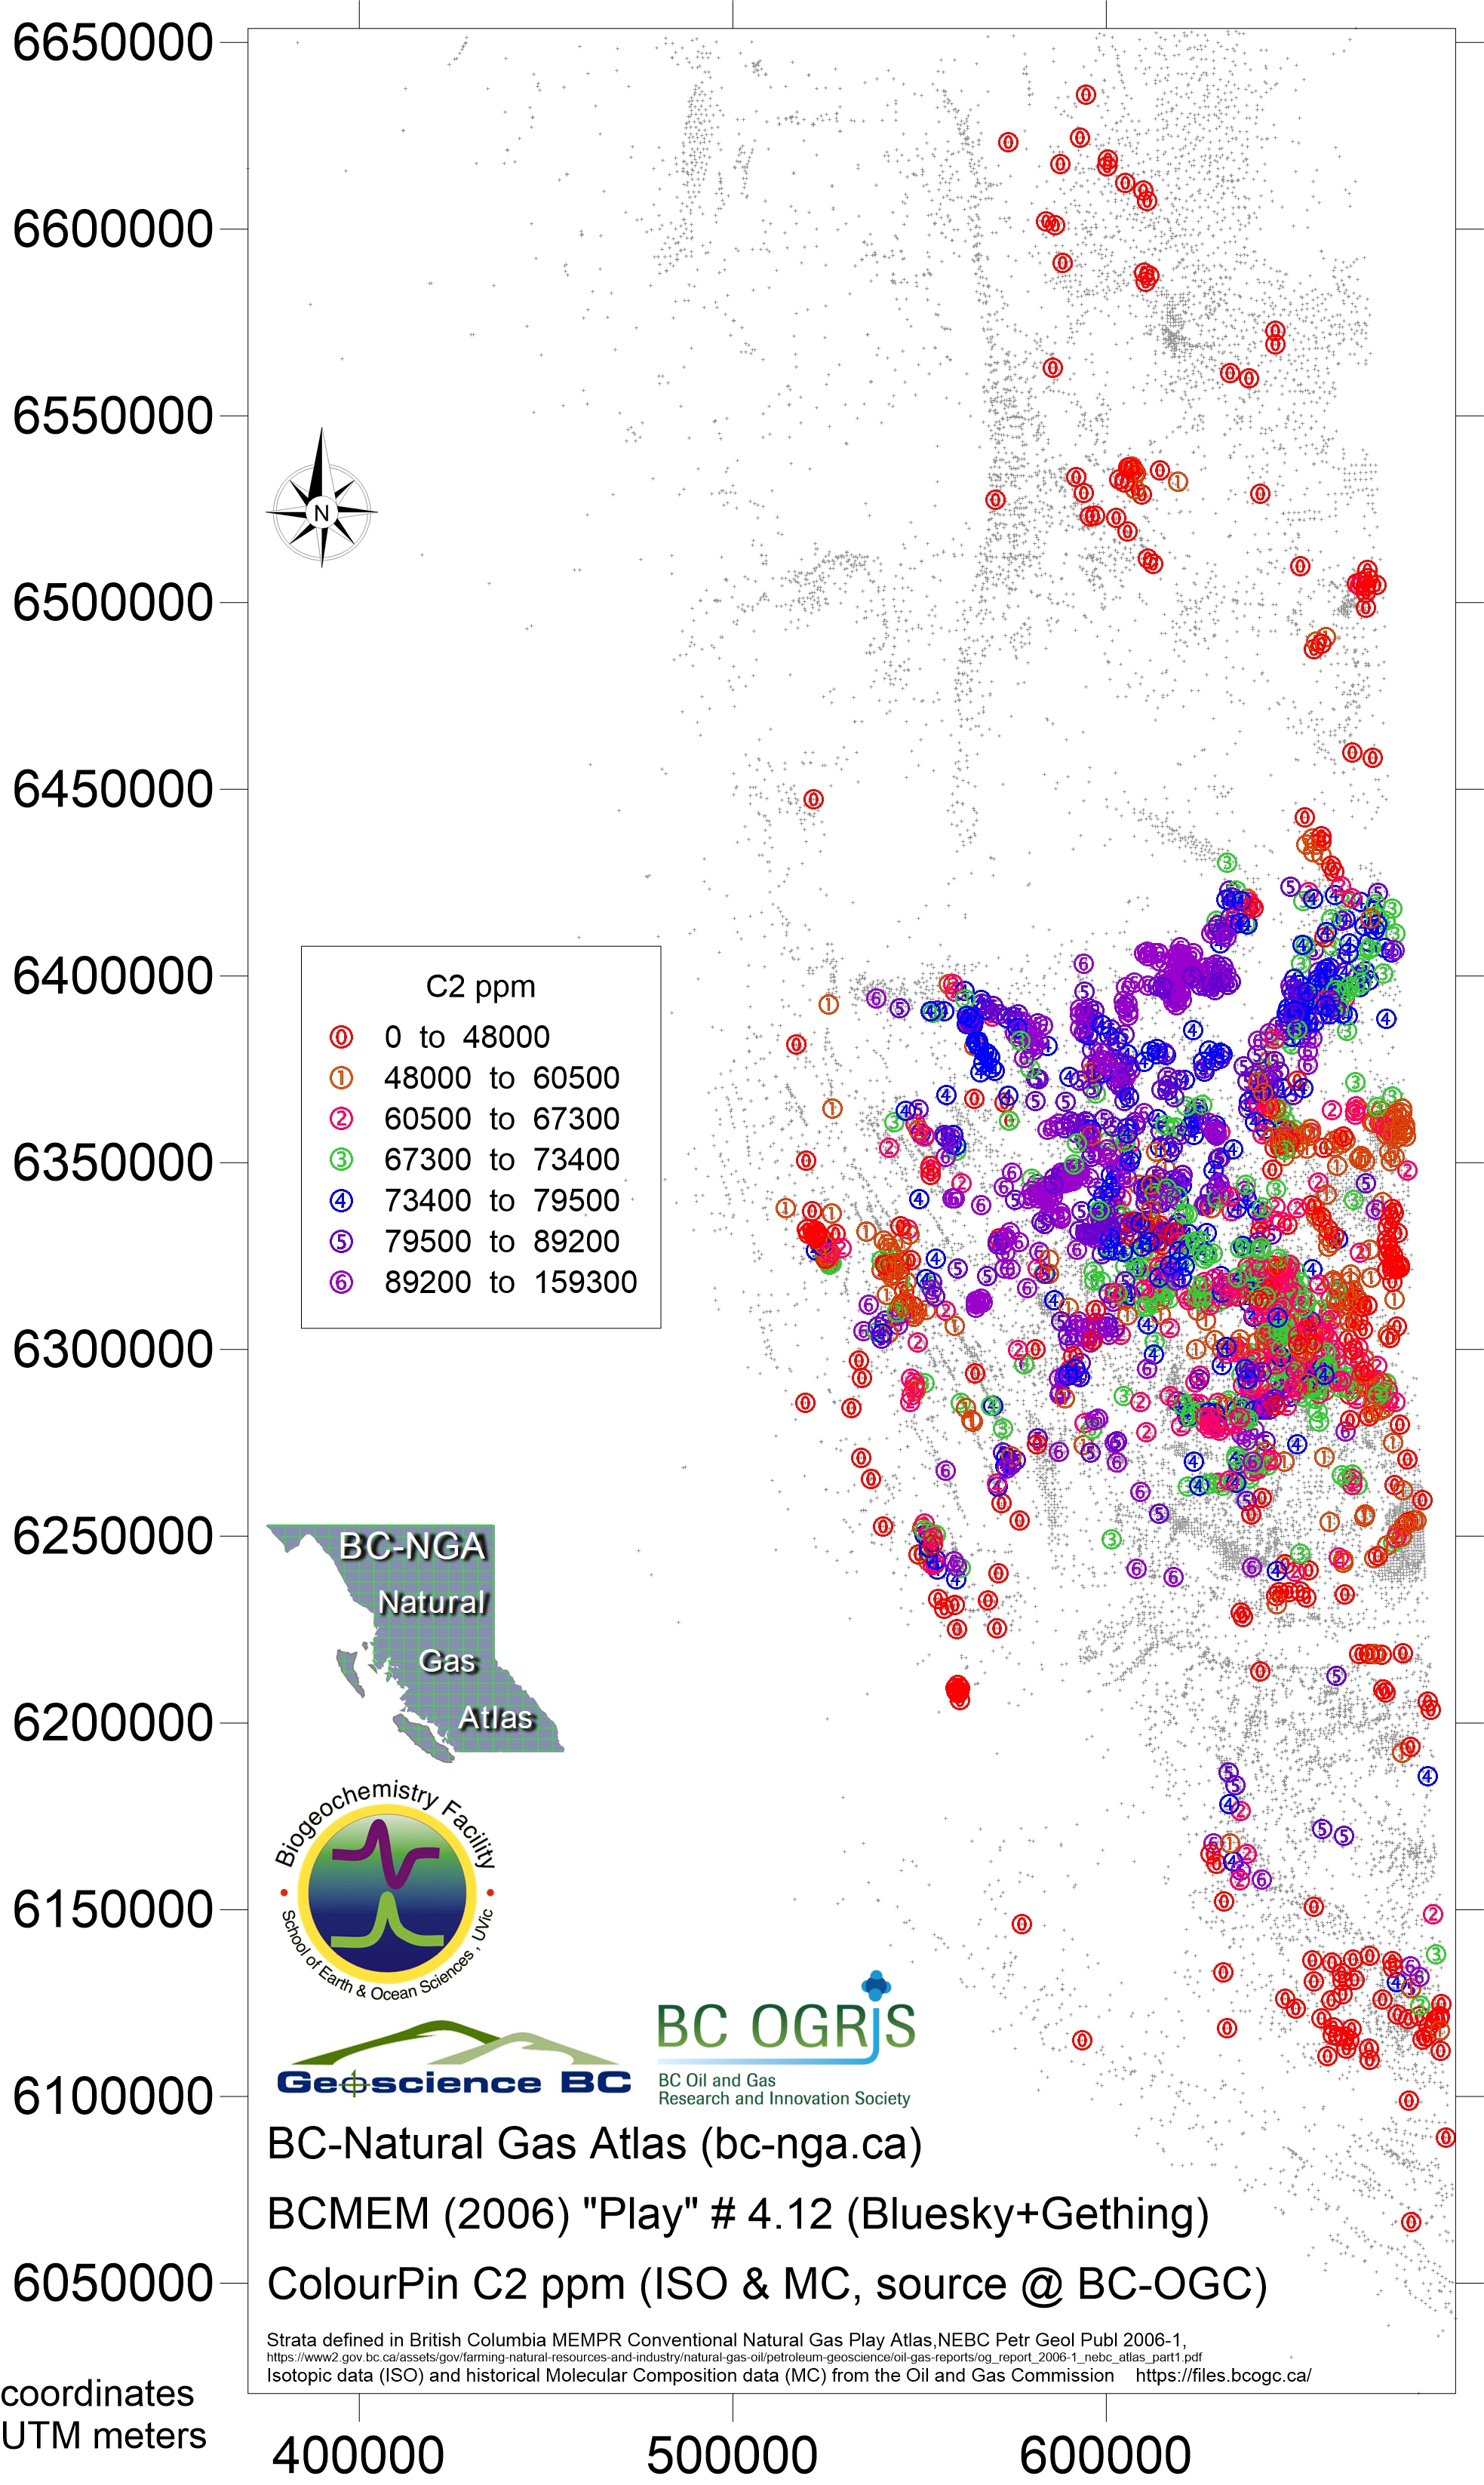
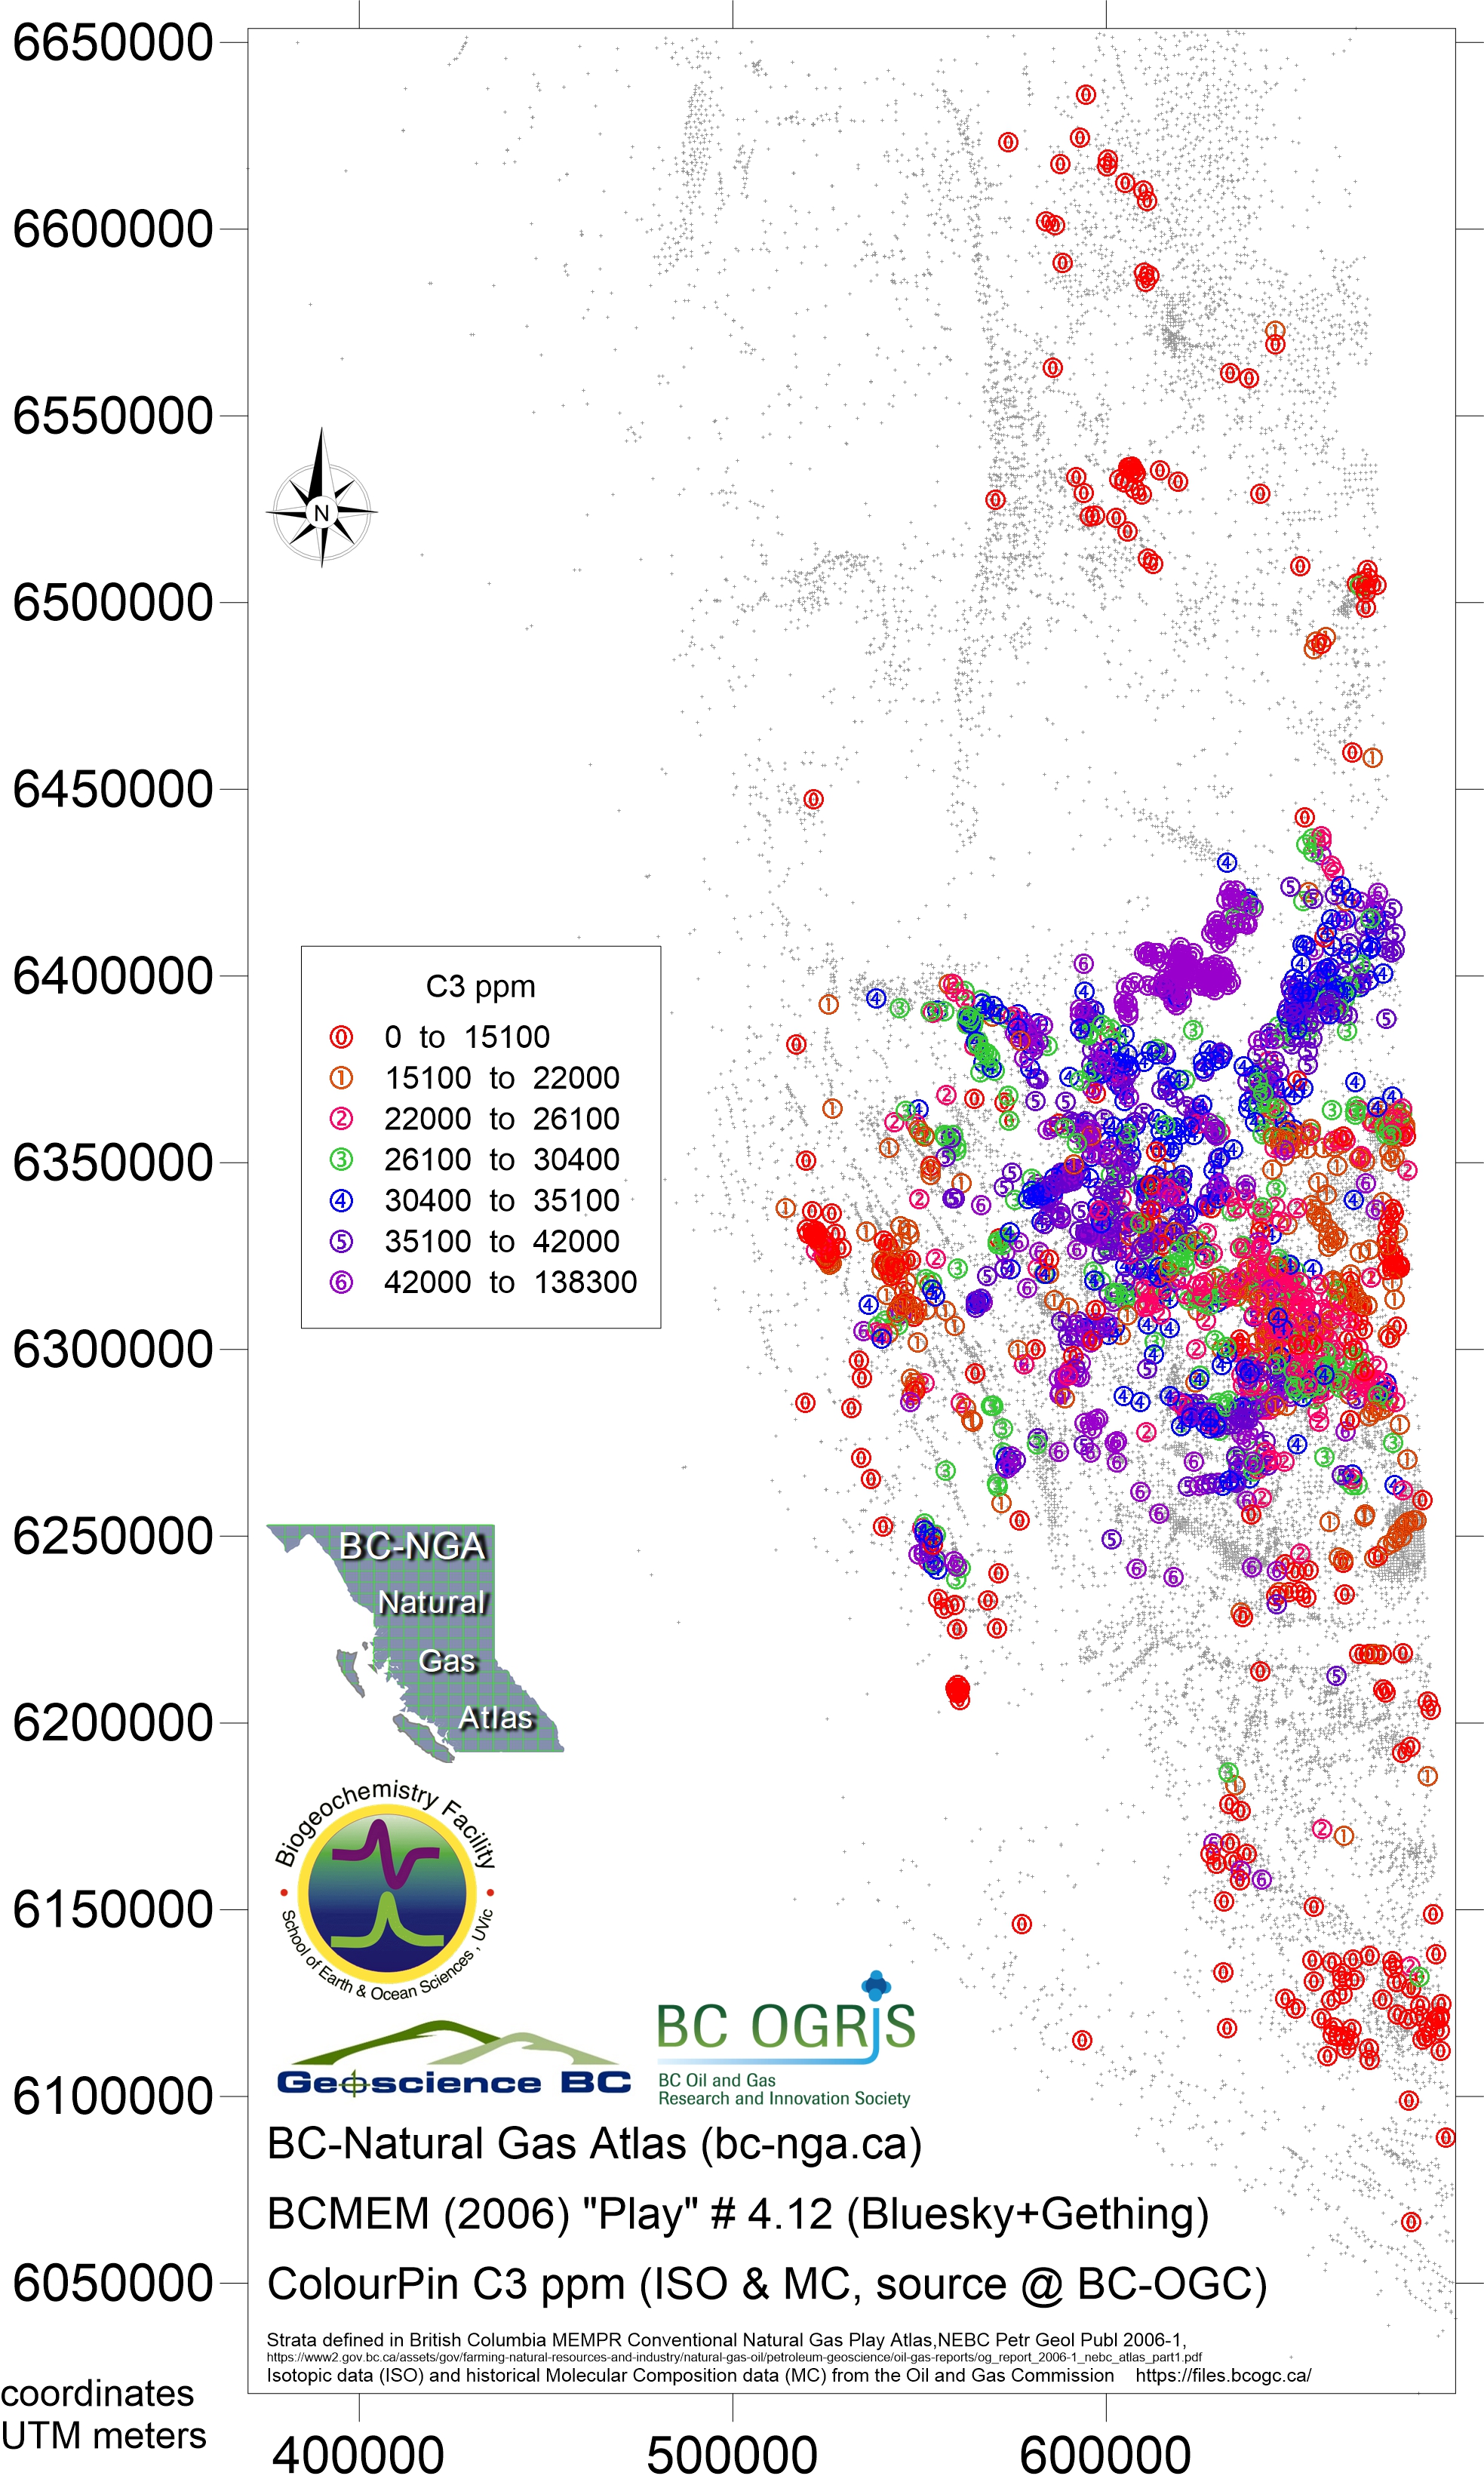
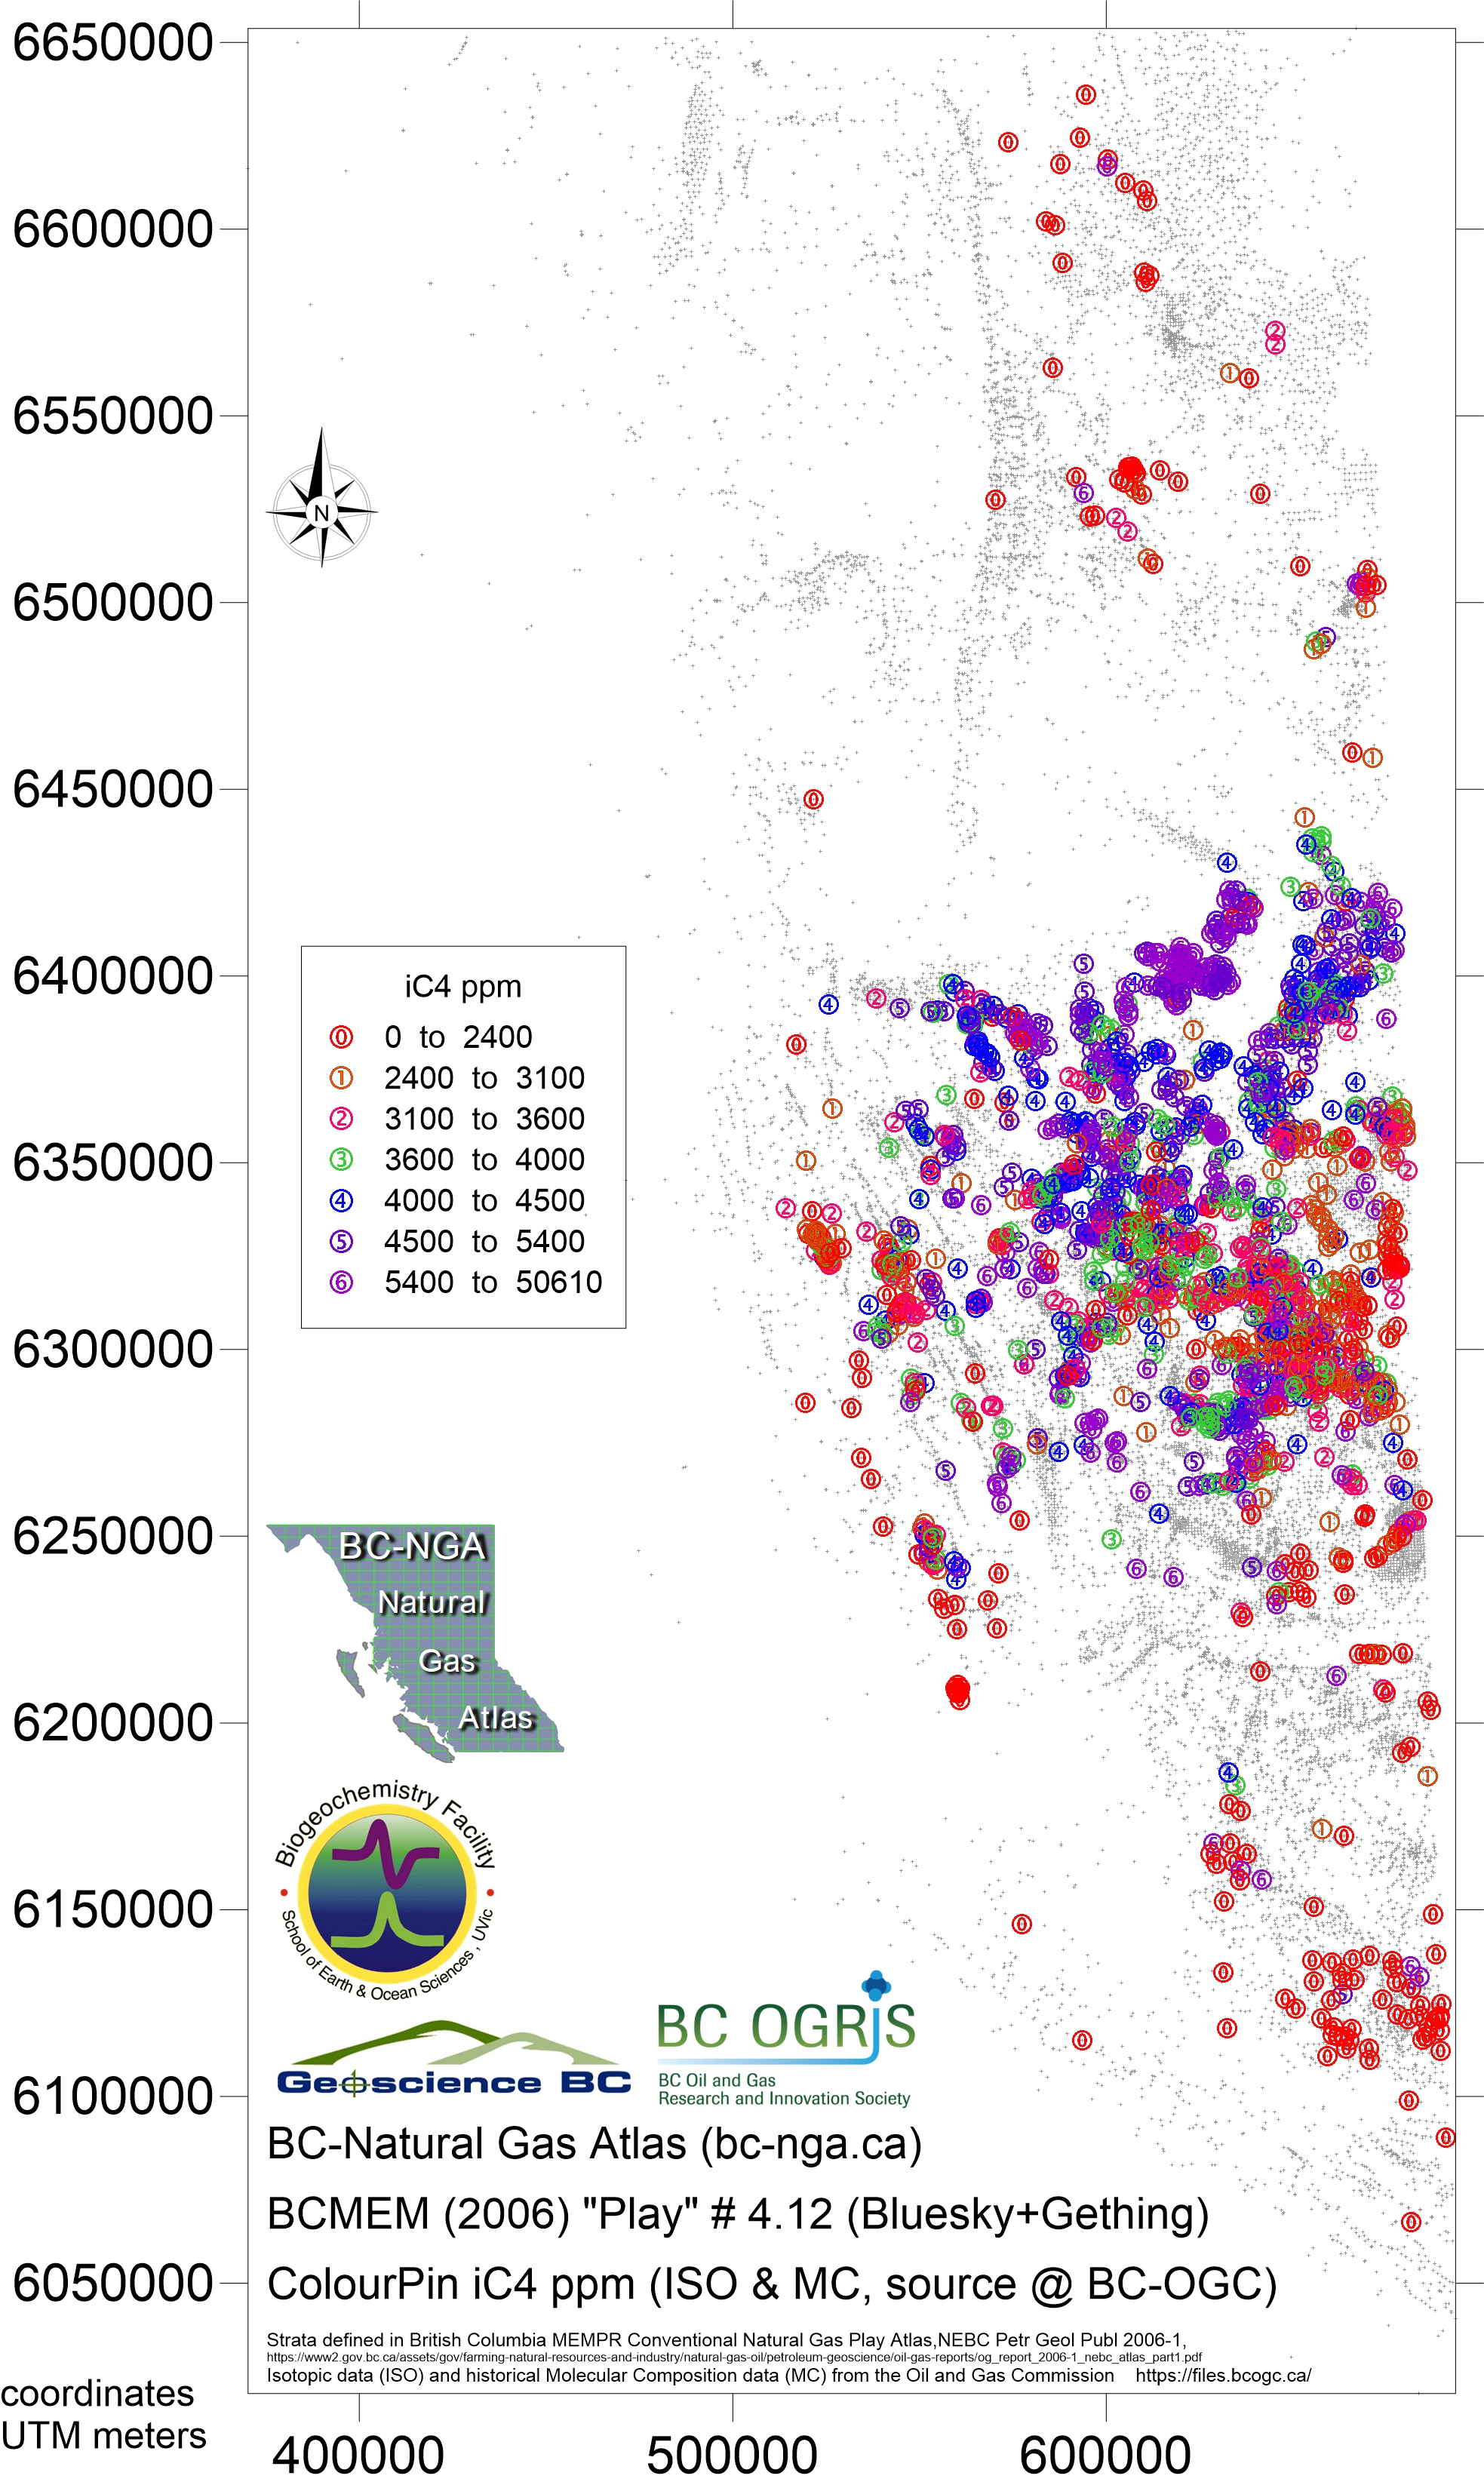
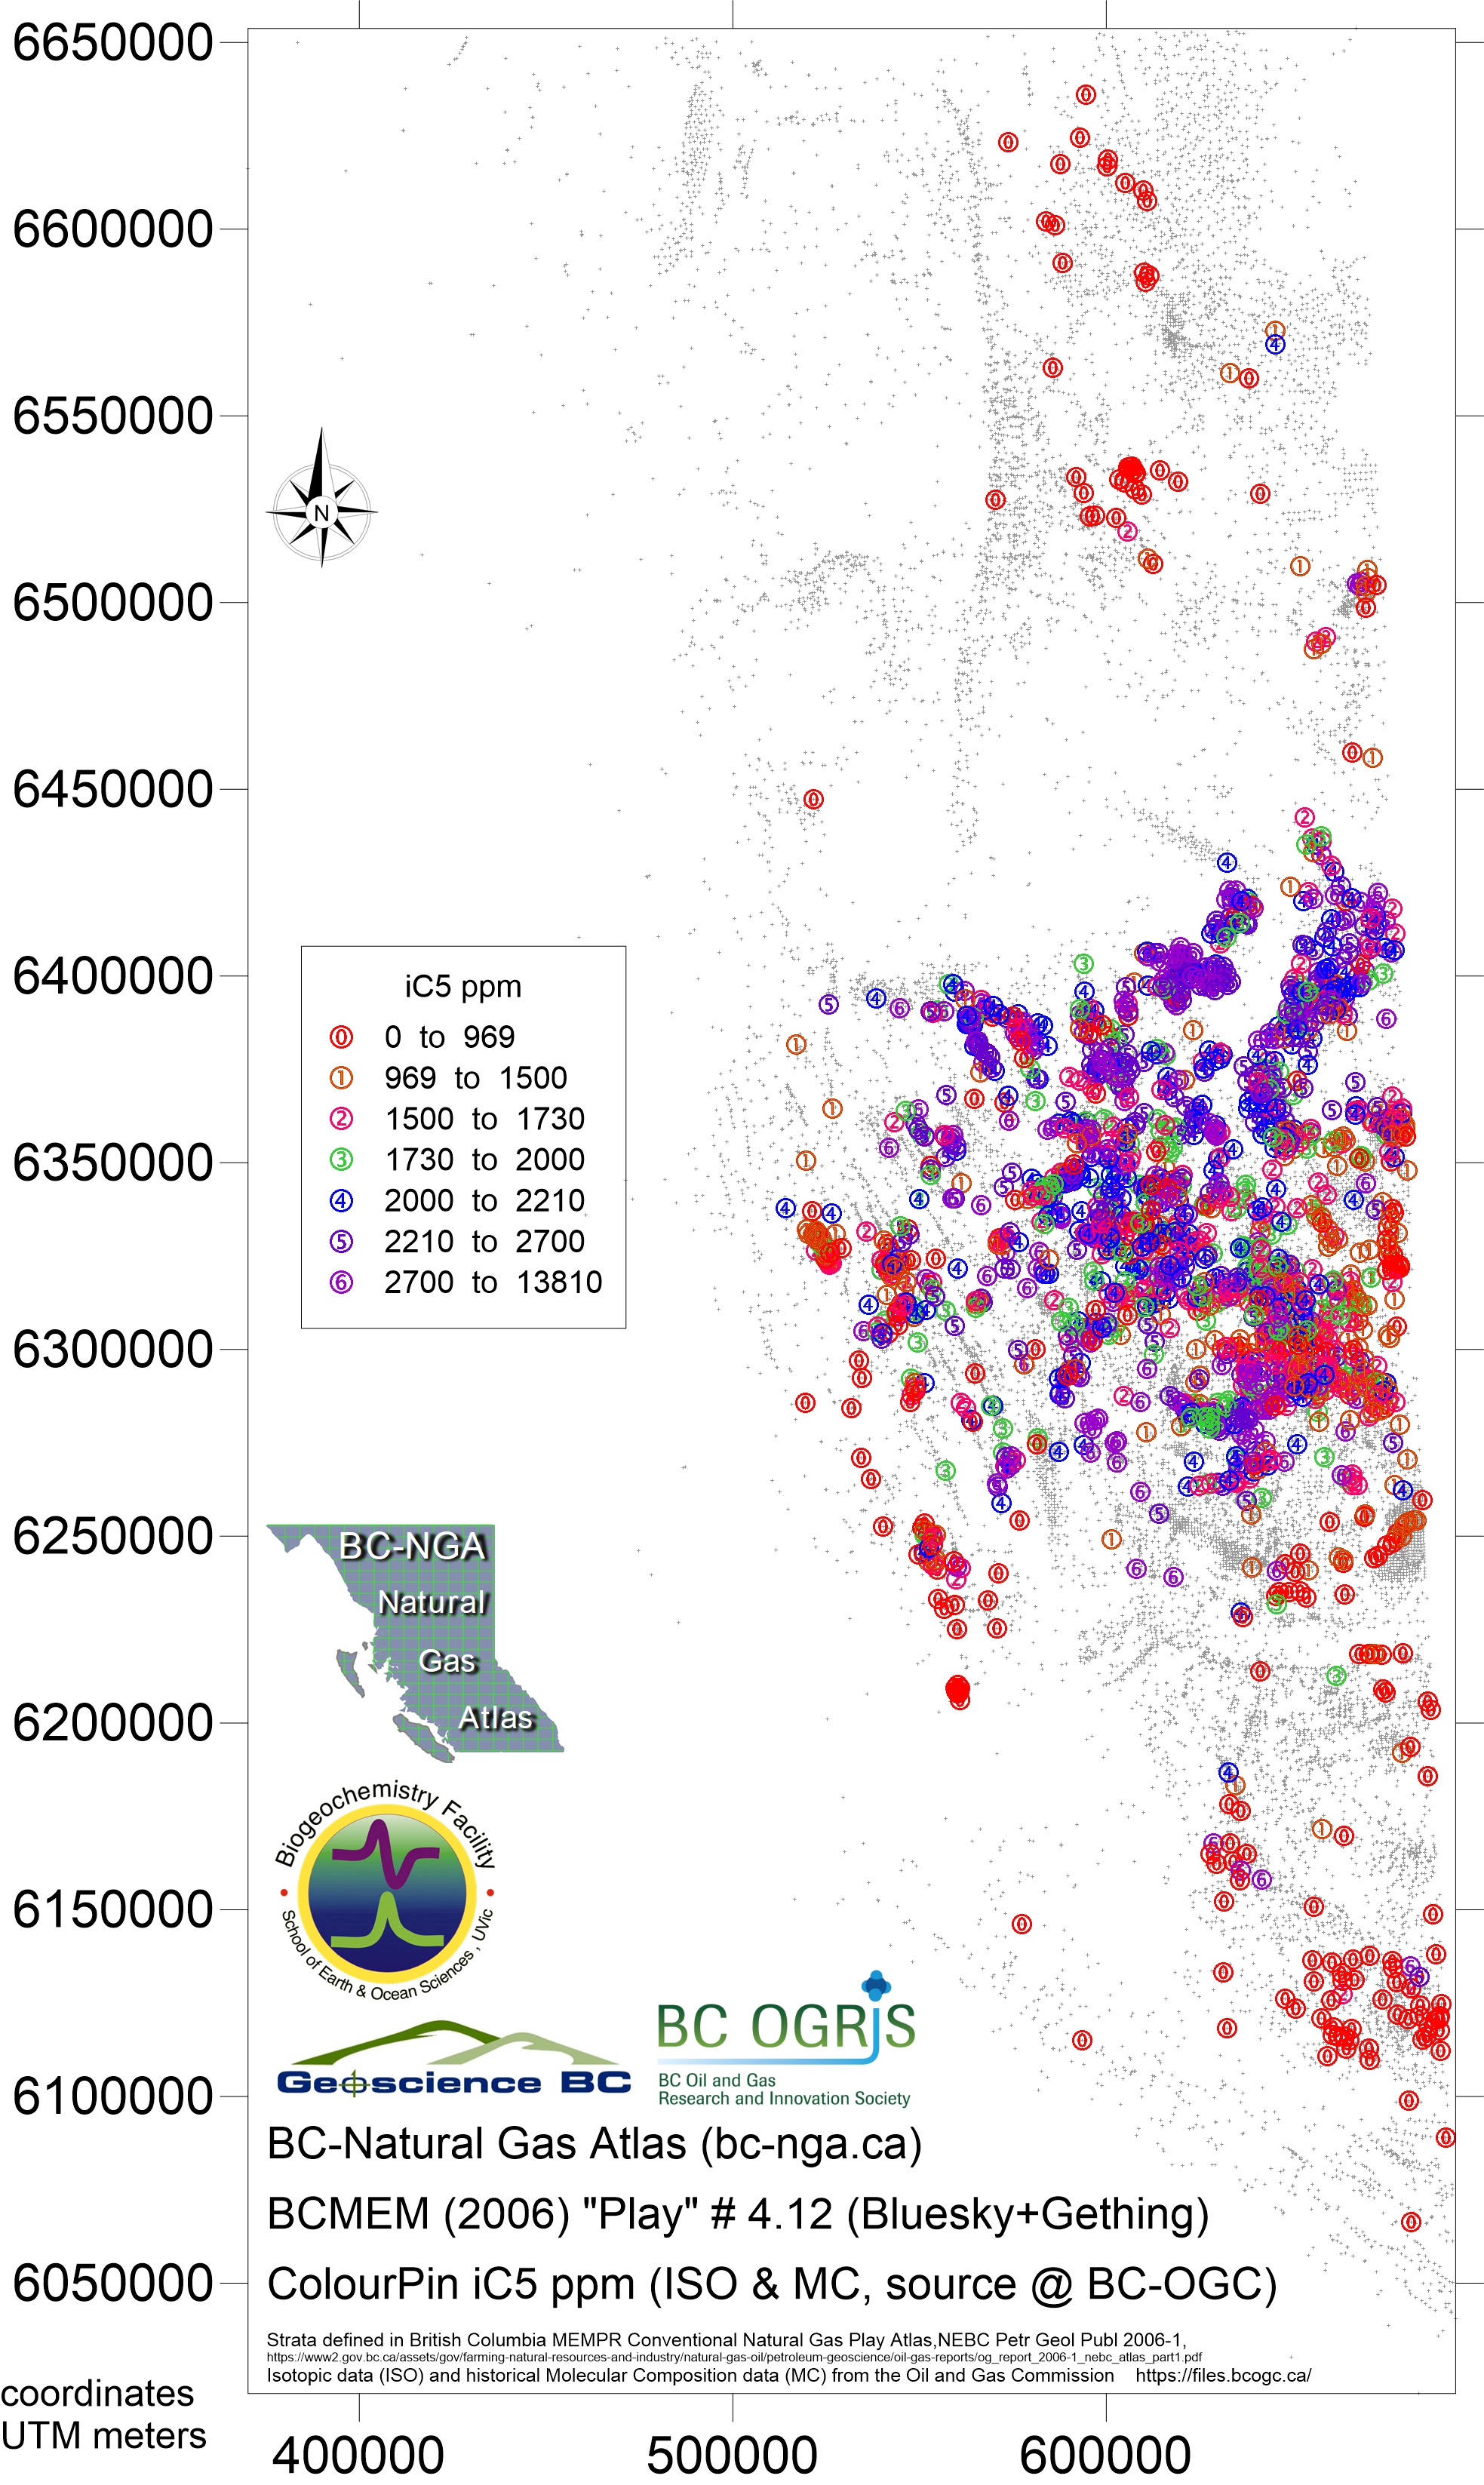
Play 4.12 Bluesky and Gething Formations and equivalents
- Map052 Nov 2018 play 4.12 Bluesky/Gething eqv Bernard ratio
- Map053 Nov 2018 play 4.12 Bluesky/Gething eqv dryness ratio
- Map054 Nov 2018 play 4.12 Bluesky/Gething eqv iC4nC4 ratio
- Map055 Nov 2018 play 4.12 Bluesky/Gething eqv ISO ratio
- Map056 Nov 2018 play 4.12 Bluesky/Gething eqv H2S ppm
- Map057 Nov 2018 play 4.12 Bluesky/Gething eqv CH4 ppm
- Map058 Nov 2018 play 4.12 Bluesky/Gething eqv C2H6 ppm
- Map059 Nov 2018 play 4.12 Bluesky/Gething eqv C3H8 ppm
- Map060 Nov 2018 play 4.12 Bluesky/Gething eqv iC4H10 ppm
- Map061 Nov 2018 play 4.12 Bluesky/Gething eqv nC4H10 ppm
- Map062 Nov 2018 play 4.12 Bluesky/Gething eqv iC5H12 ppm
- Map063 Nov 2018 play 4.12 Bluesky/Gething eqv nC5H12 ppm
- Map064 Nov 2018 play 4.12 Bluesky/Gething eqv C6H14 plus ppm
- Map064 Nov 2018 play 4.12 Bluesky/Gething eqv CO2 ppm
- Map065 Nov 2018 play 4.12 Bluesky/Gething eqv δ13CH4
- Map066 Nov 2018 play 4.12 Bluesky/Gething eqv δ13C2H6
- Map067 Nov 2018 play 4.12 Bluesky/Gething eqv δ13C3H8
- Map068 Nov 2018 play 4.12 Bluesky/Gething eqv δ13iC4H10
- Map069 Nov 2018 play 4.12 Bluesky/Gething eqv δ13nC4H10
- Map070 Nov 2018 play 4.12 Bluesky/Gething eqv δ13nC5H12
- Map071 Nov 2018 play 4.12 Bluesky/Gething eqv δ13CO2
- Map072 Nov 2018 play 4.12 Bluesky/Gething eqv time series gradient Bernard ratio
- Map073 Nov 2018 play 4.12 Bluesky/Gething eqv time series gradient CO2
- Map074 Nov 2018 play 4.12 Bluesky/Gething eqv time series gradient H2S
- Map075 Nov 2018 play 4.12 Bluesky/Gething eqv time series start point Bernard ratio
- Map076 Nov 2018 play 4.12 Bluesky/Gething eqv time series start point CO22
- Map077 Nov 2018 play 4.12 Bluesky/Gething eqv time series start point H2S
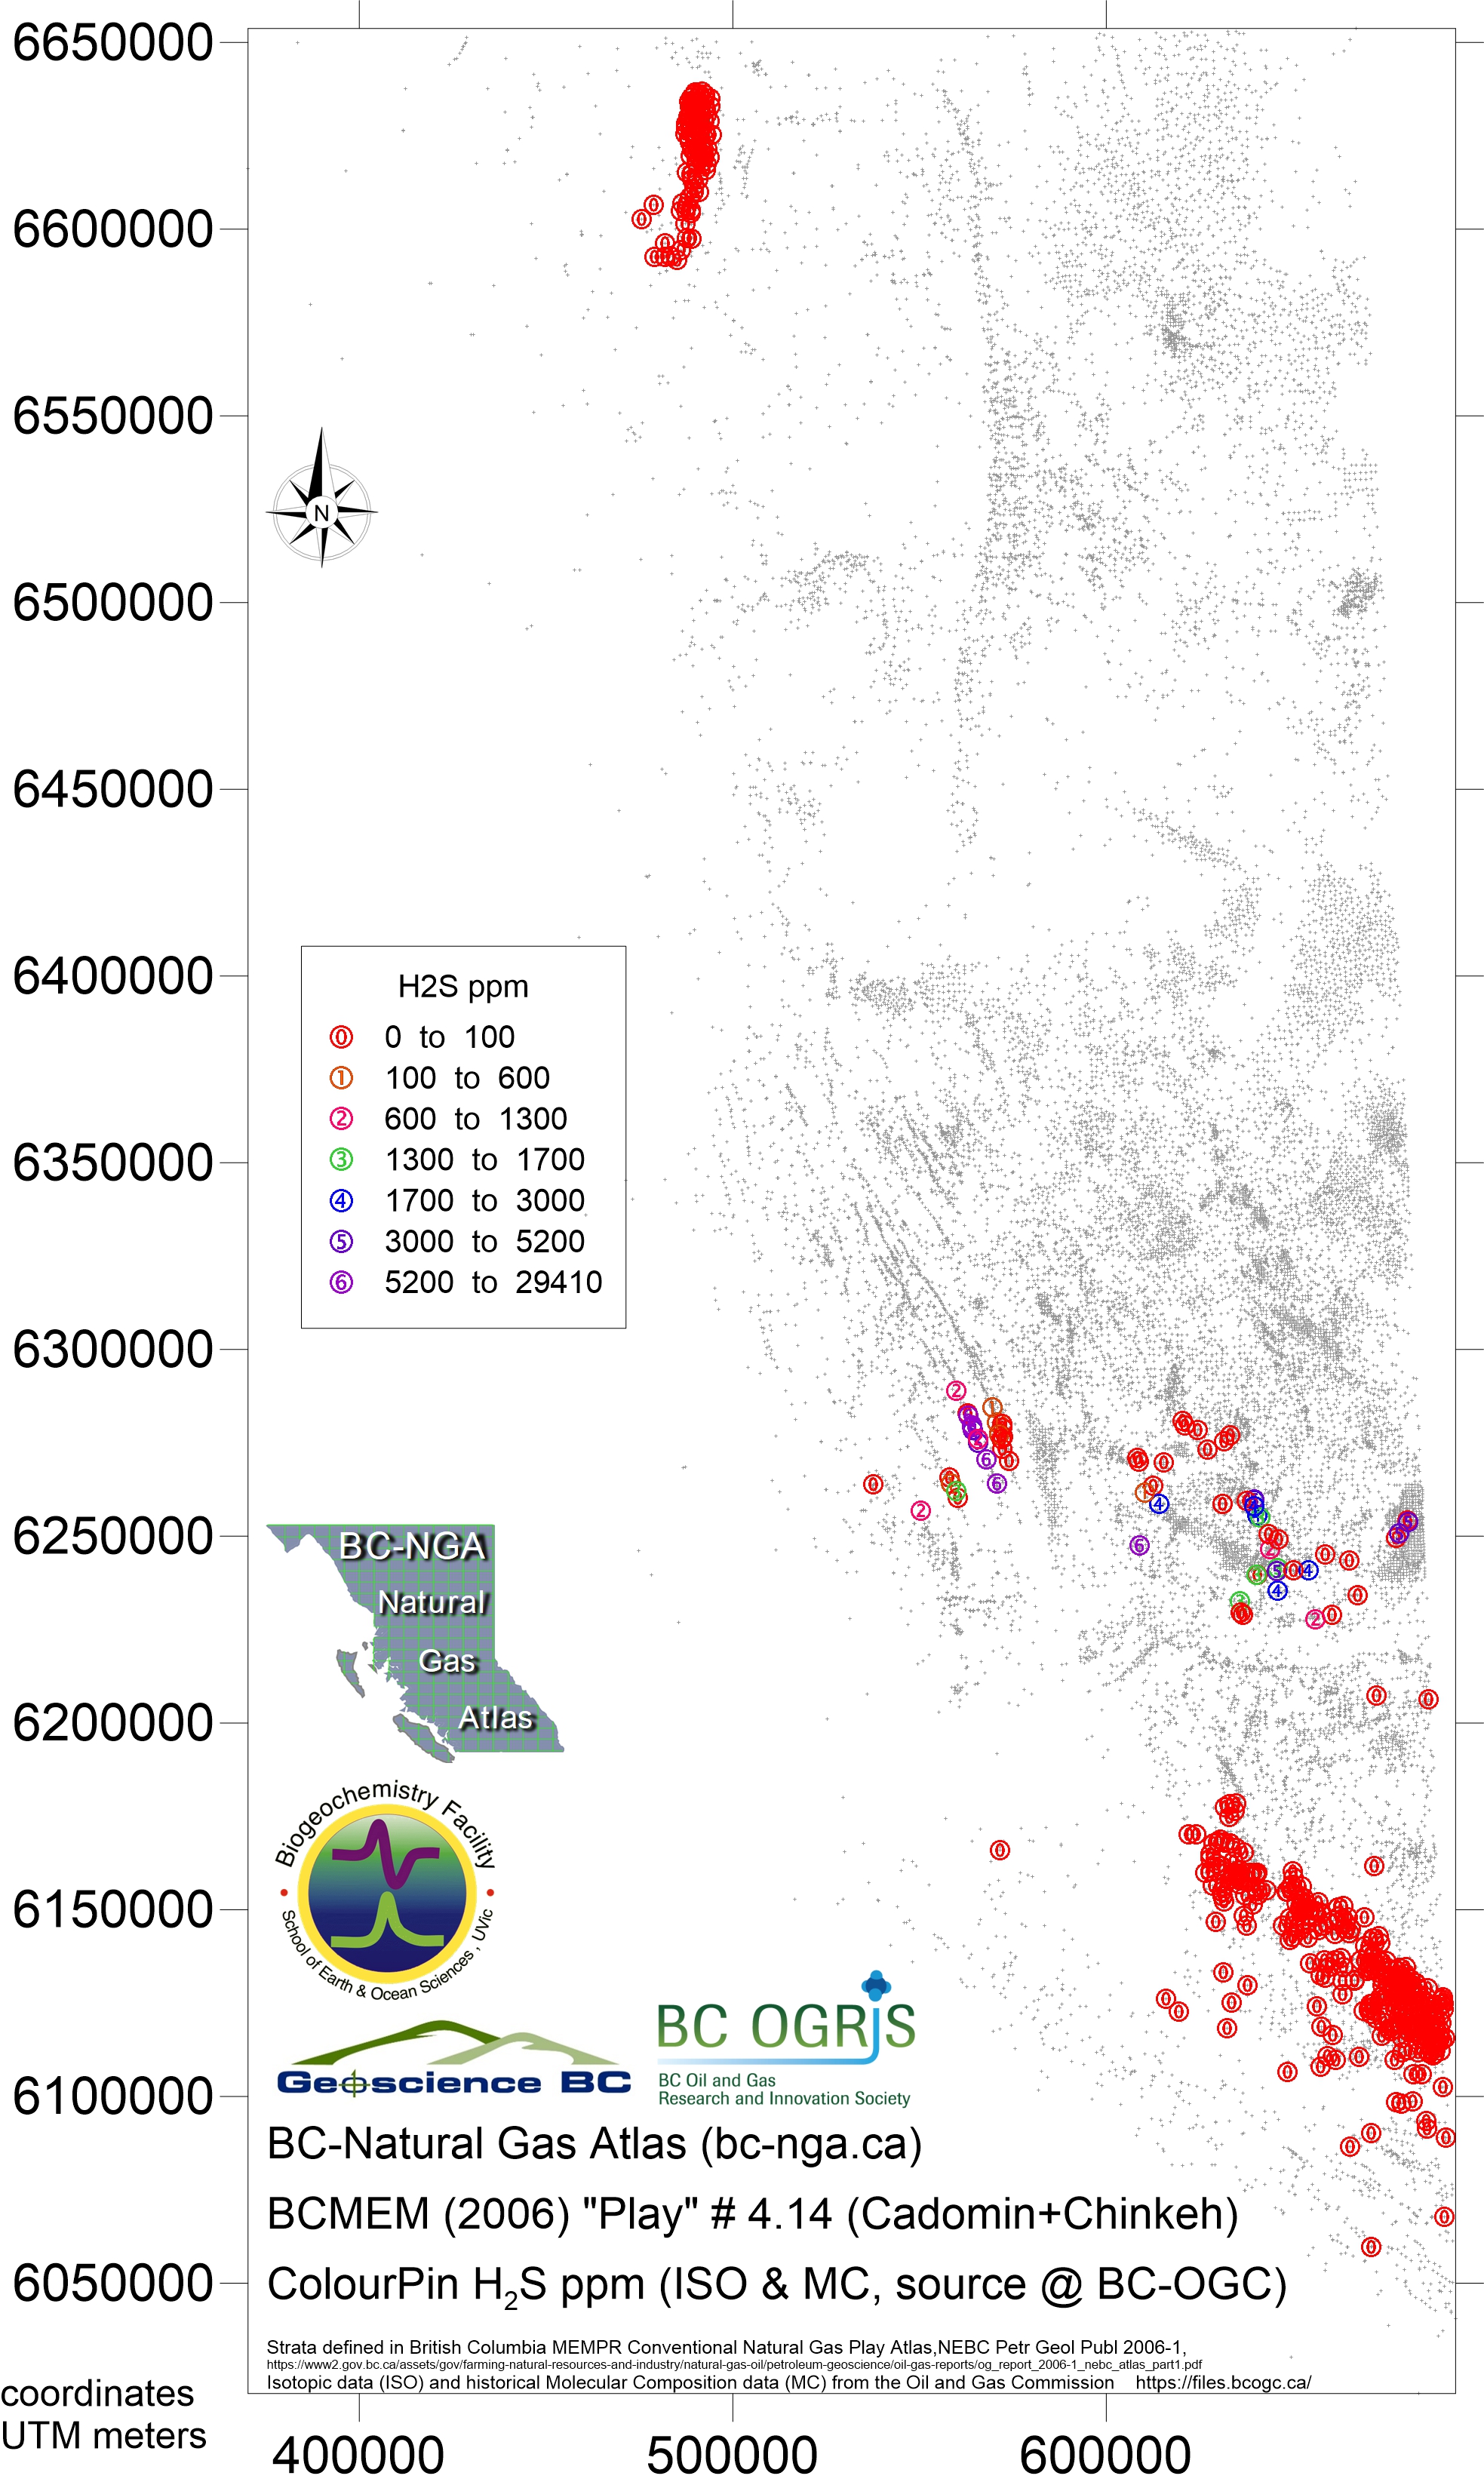
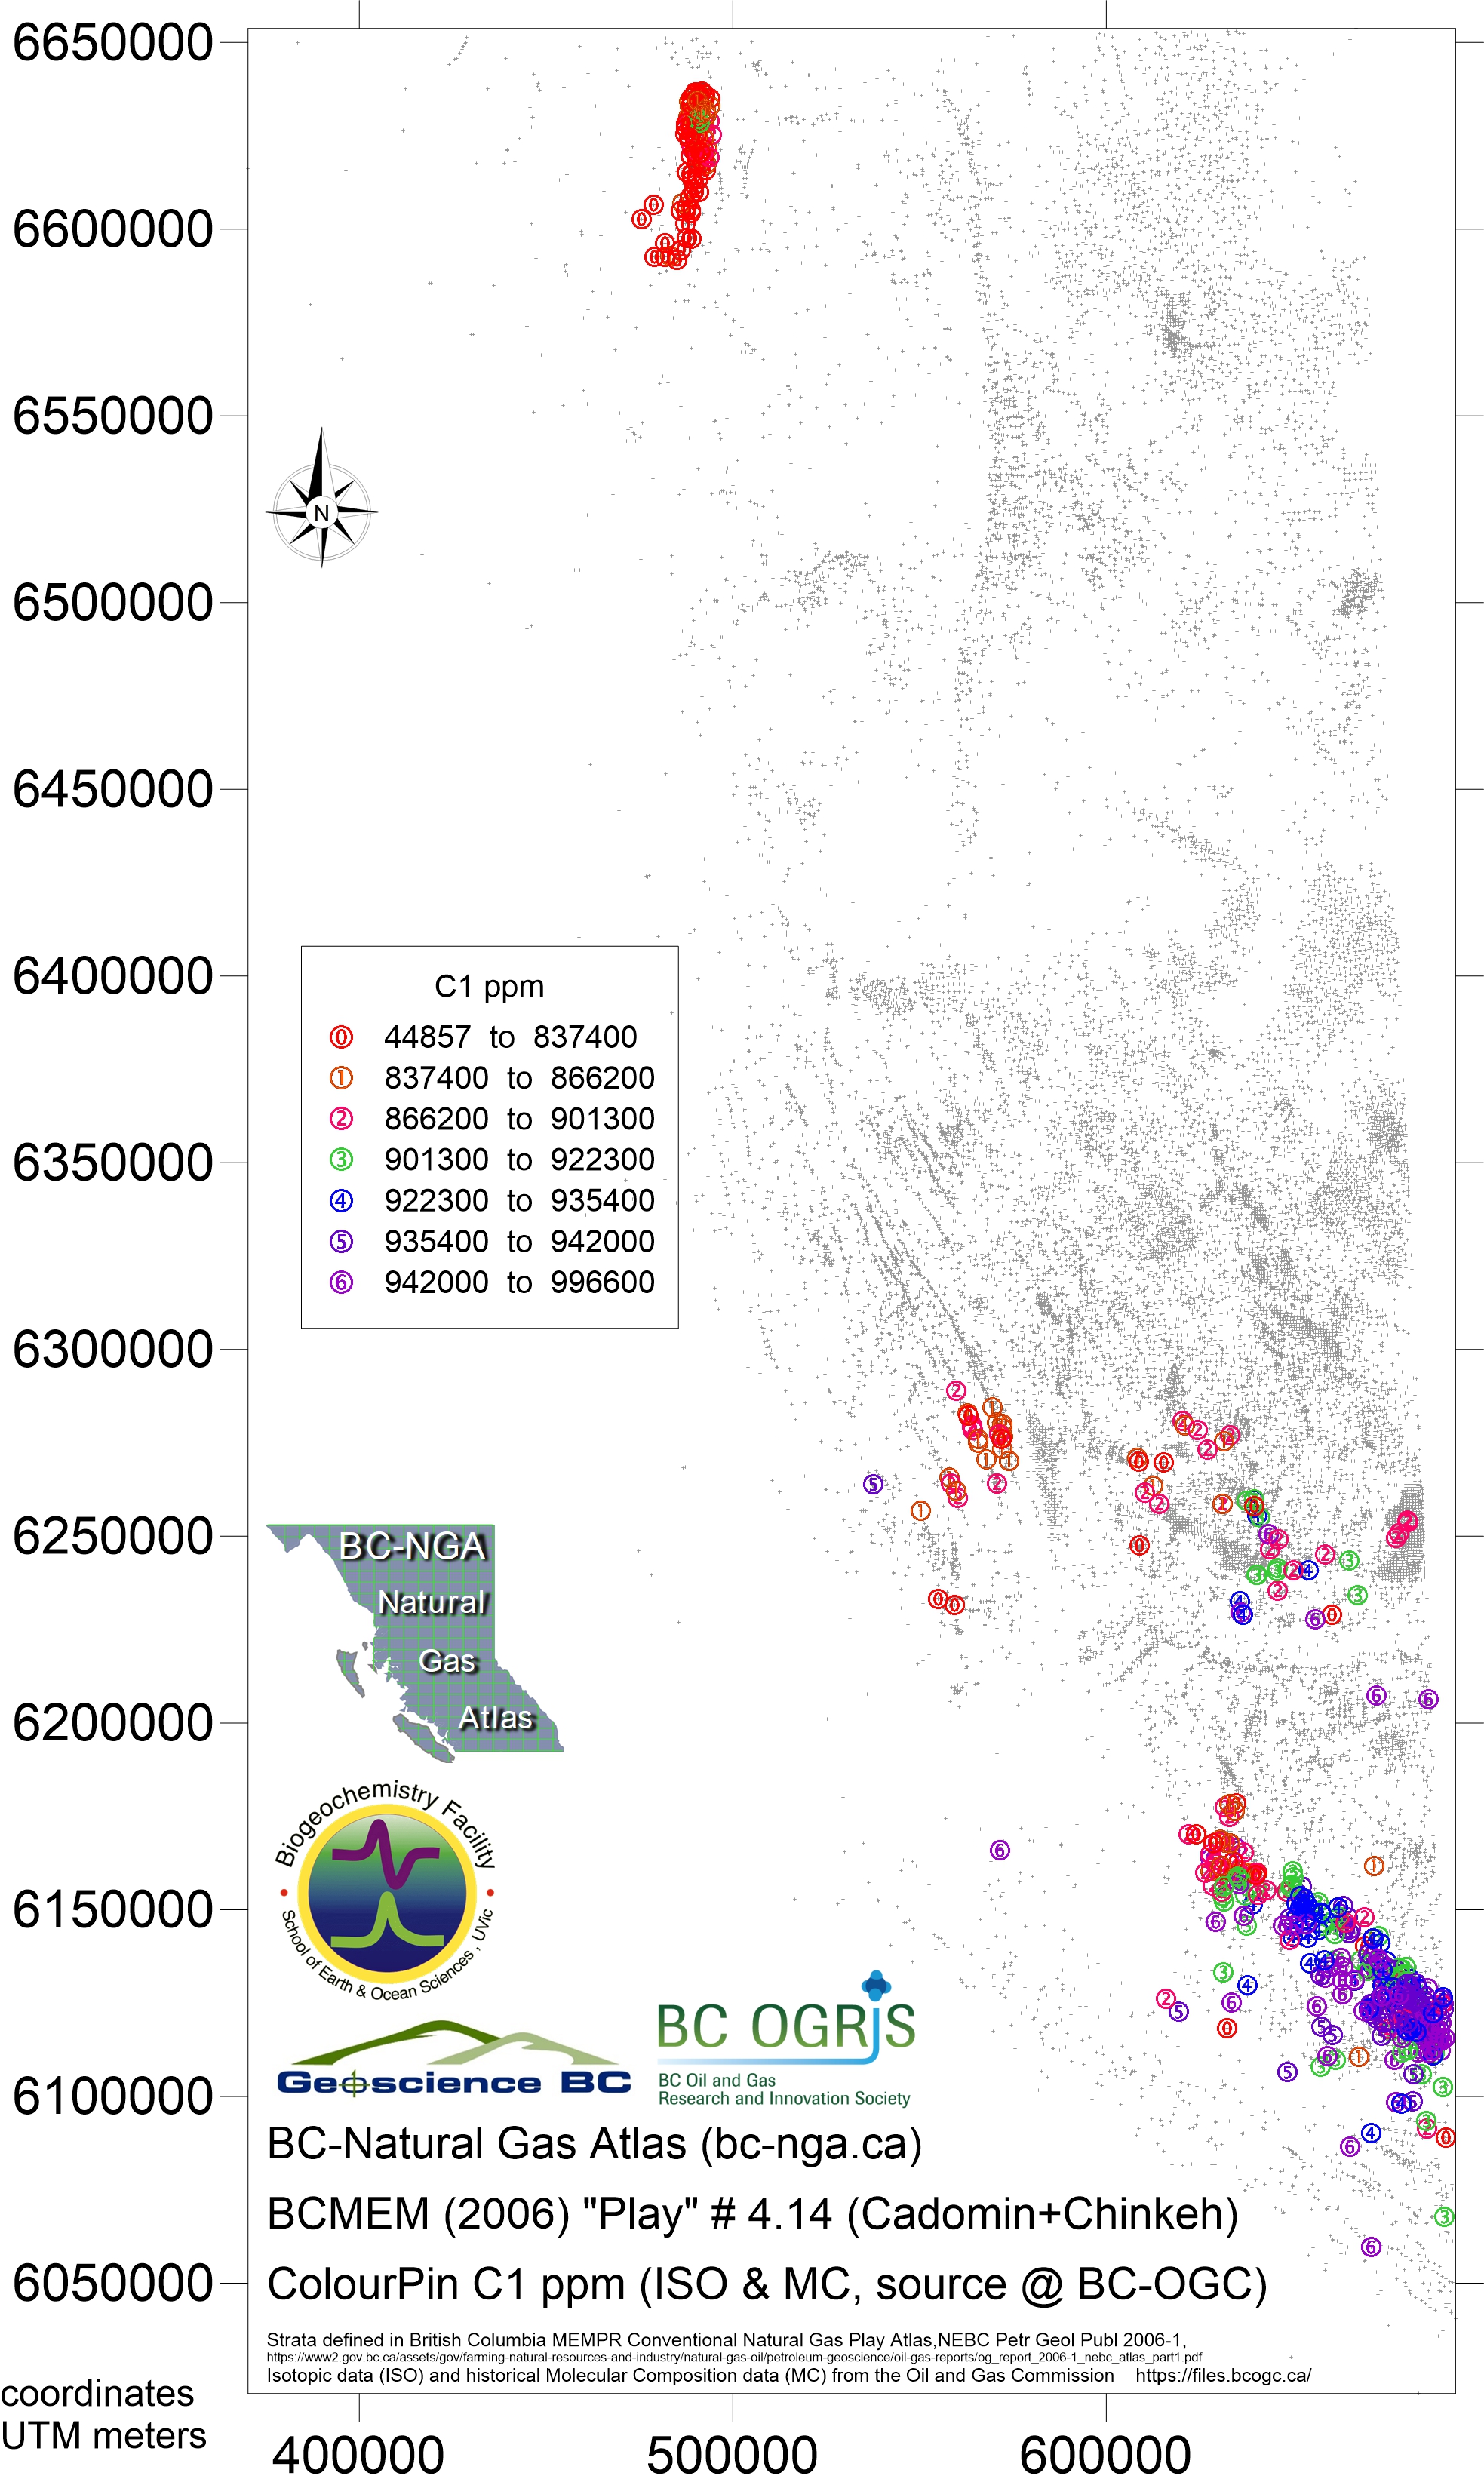
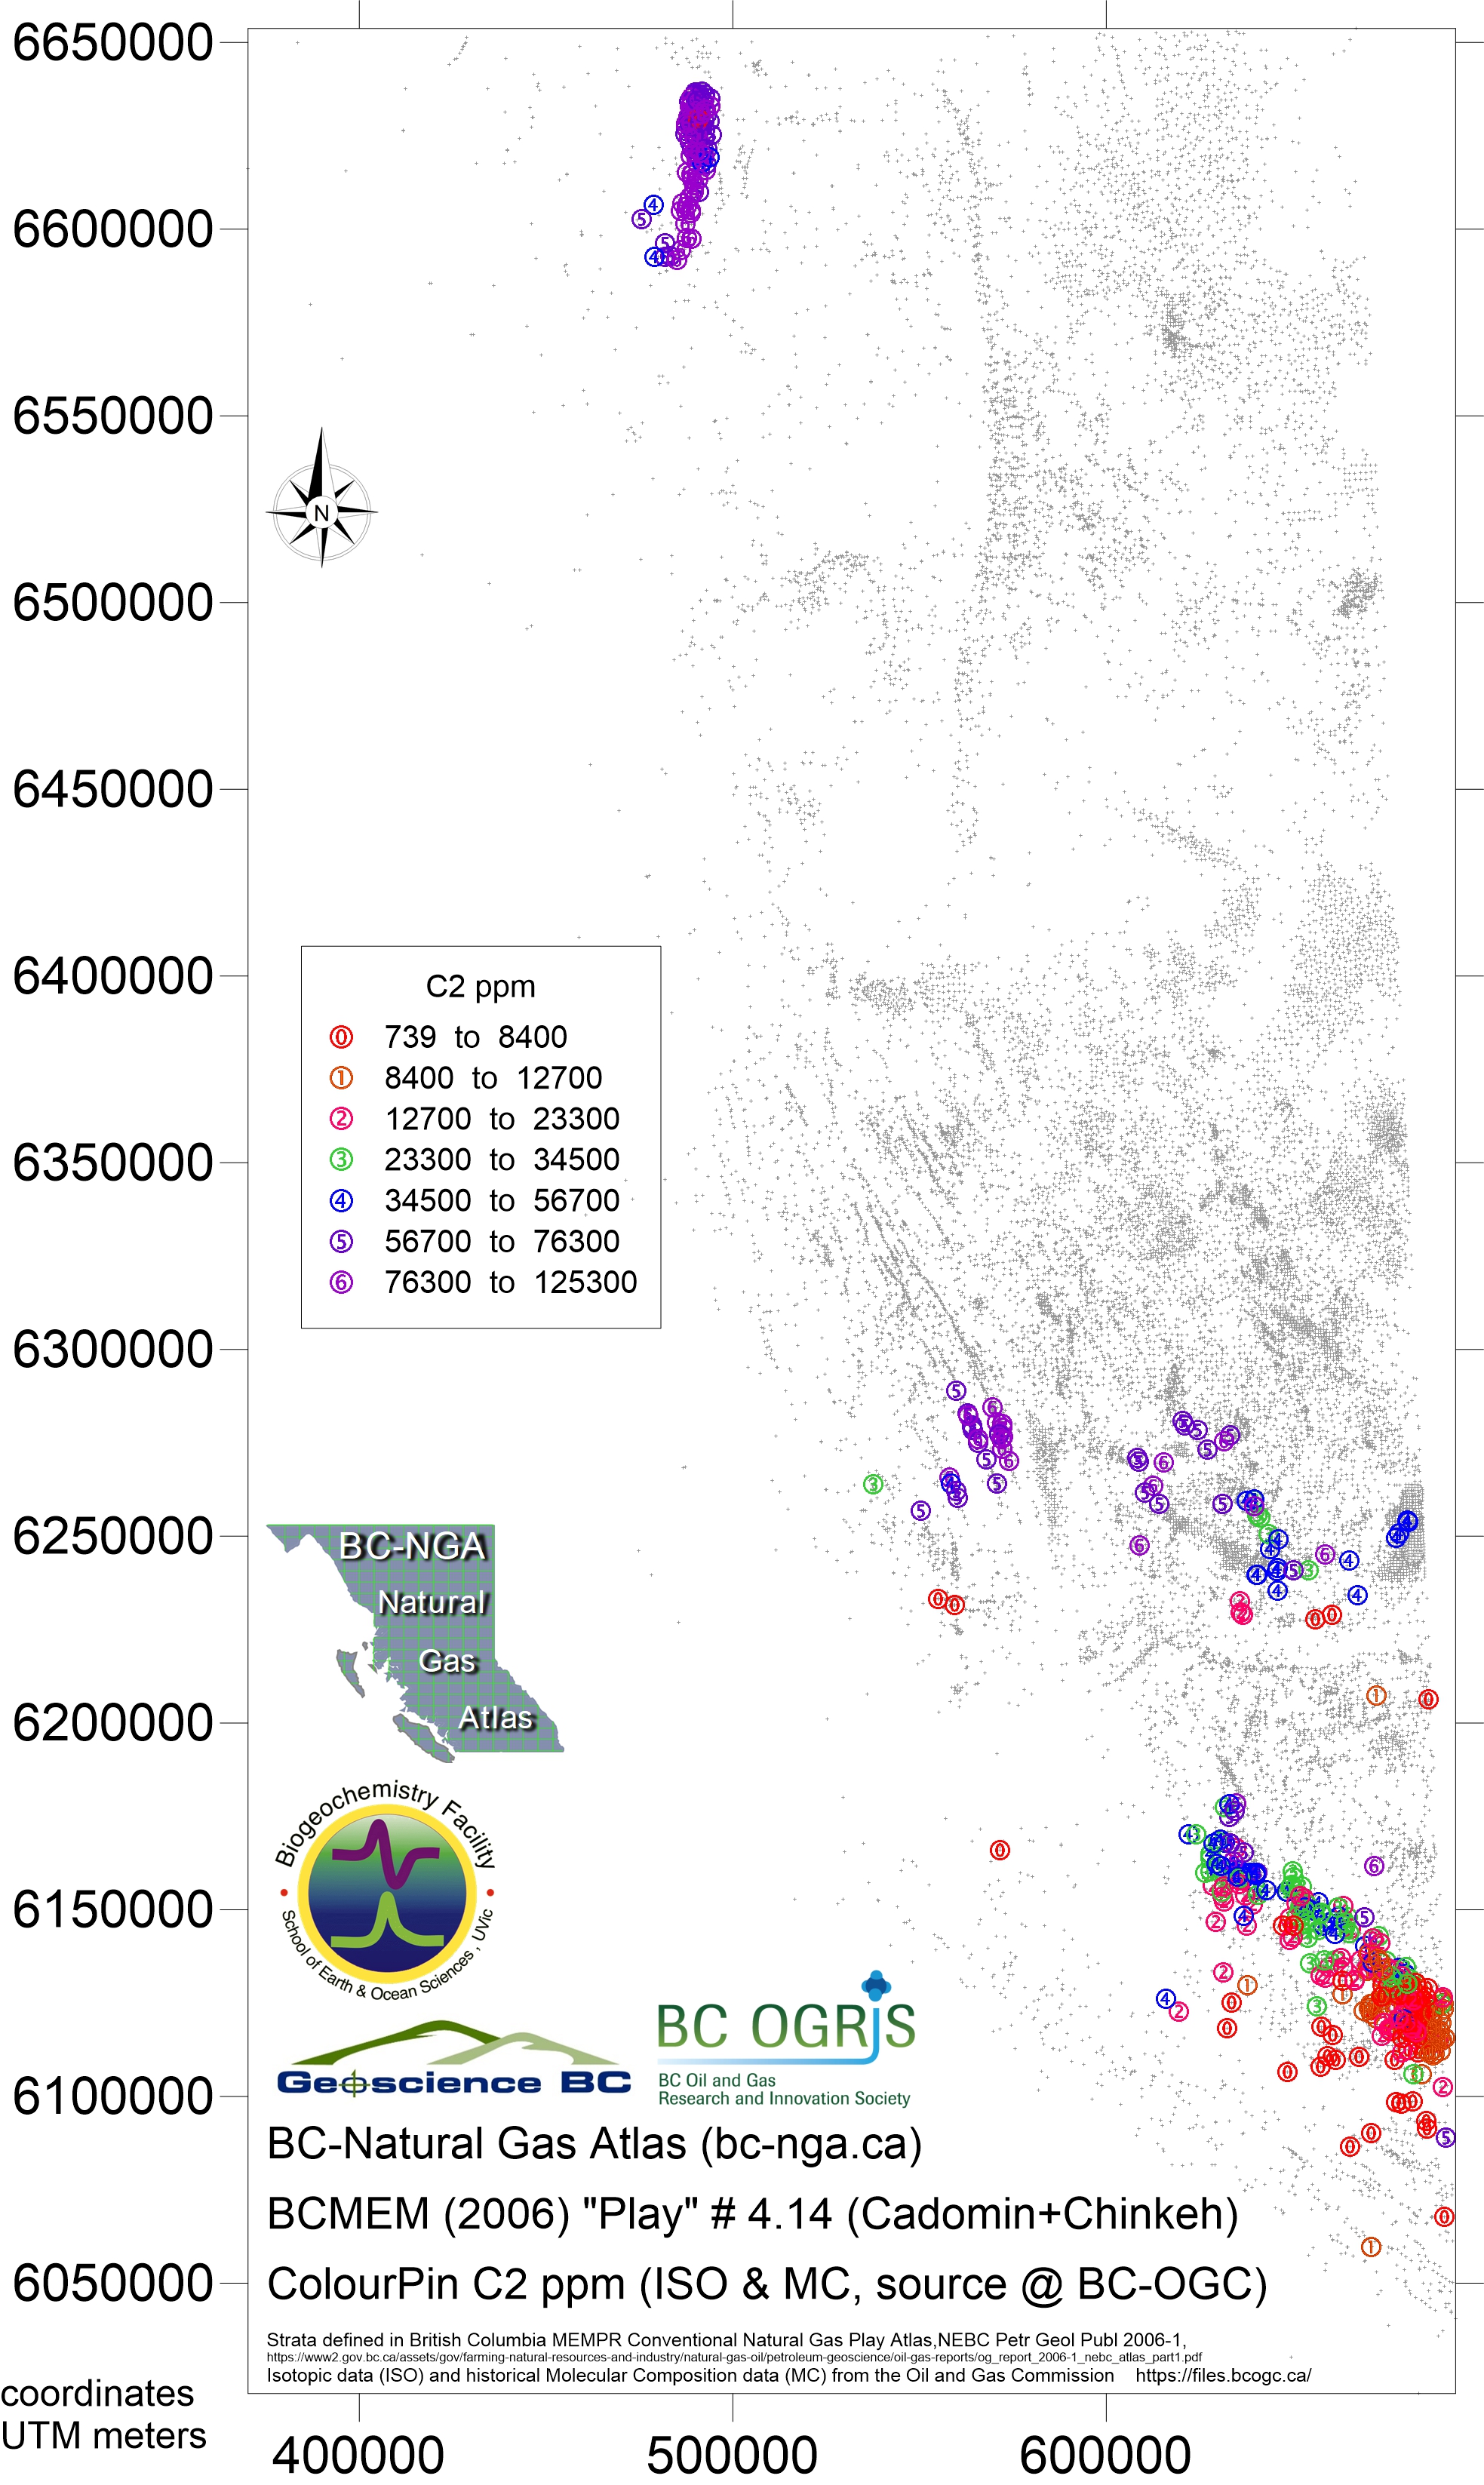
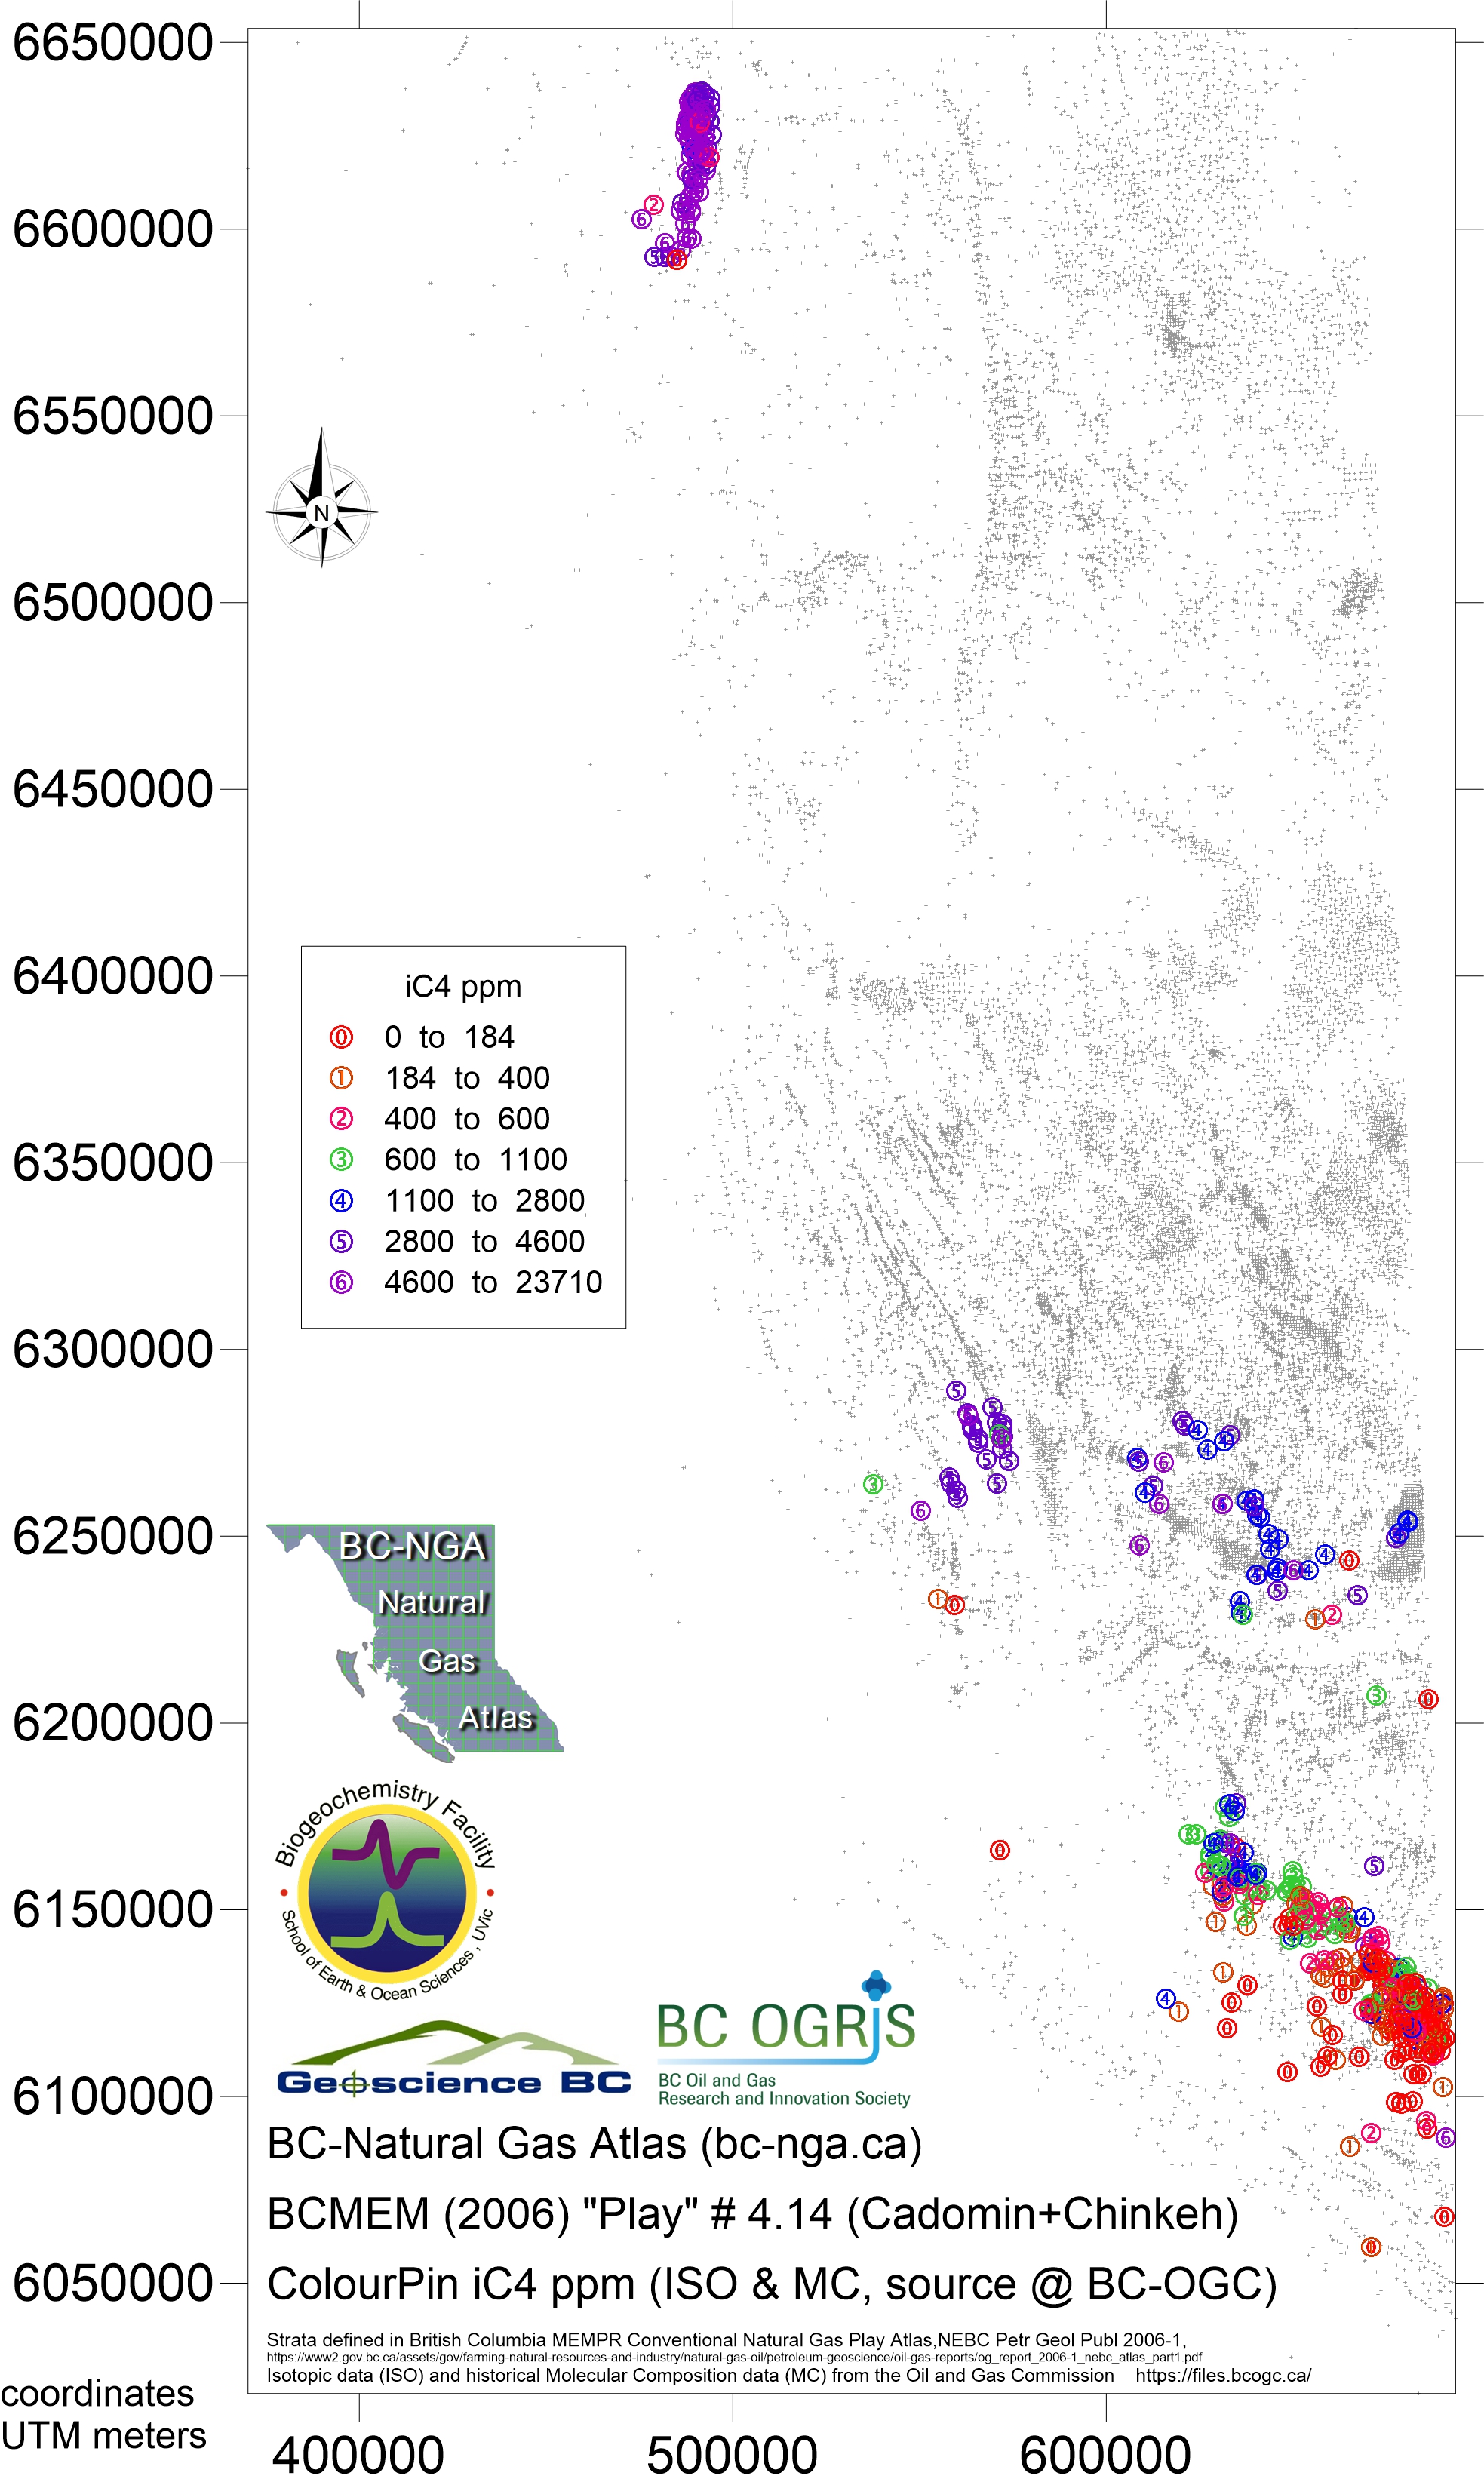
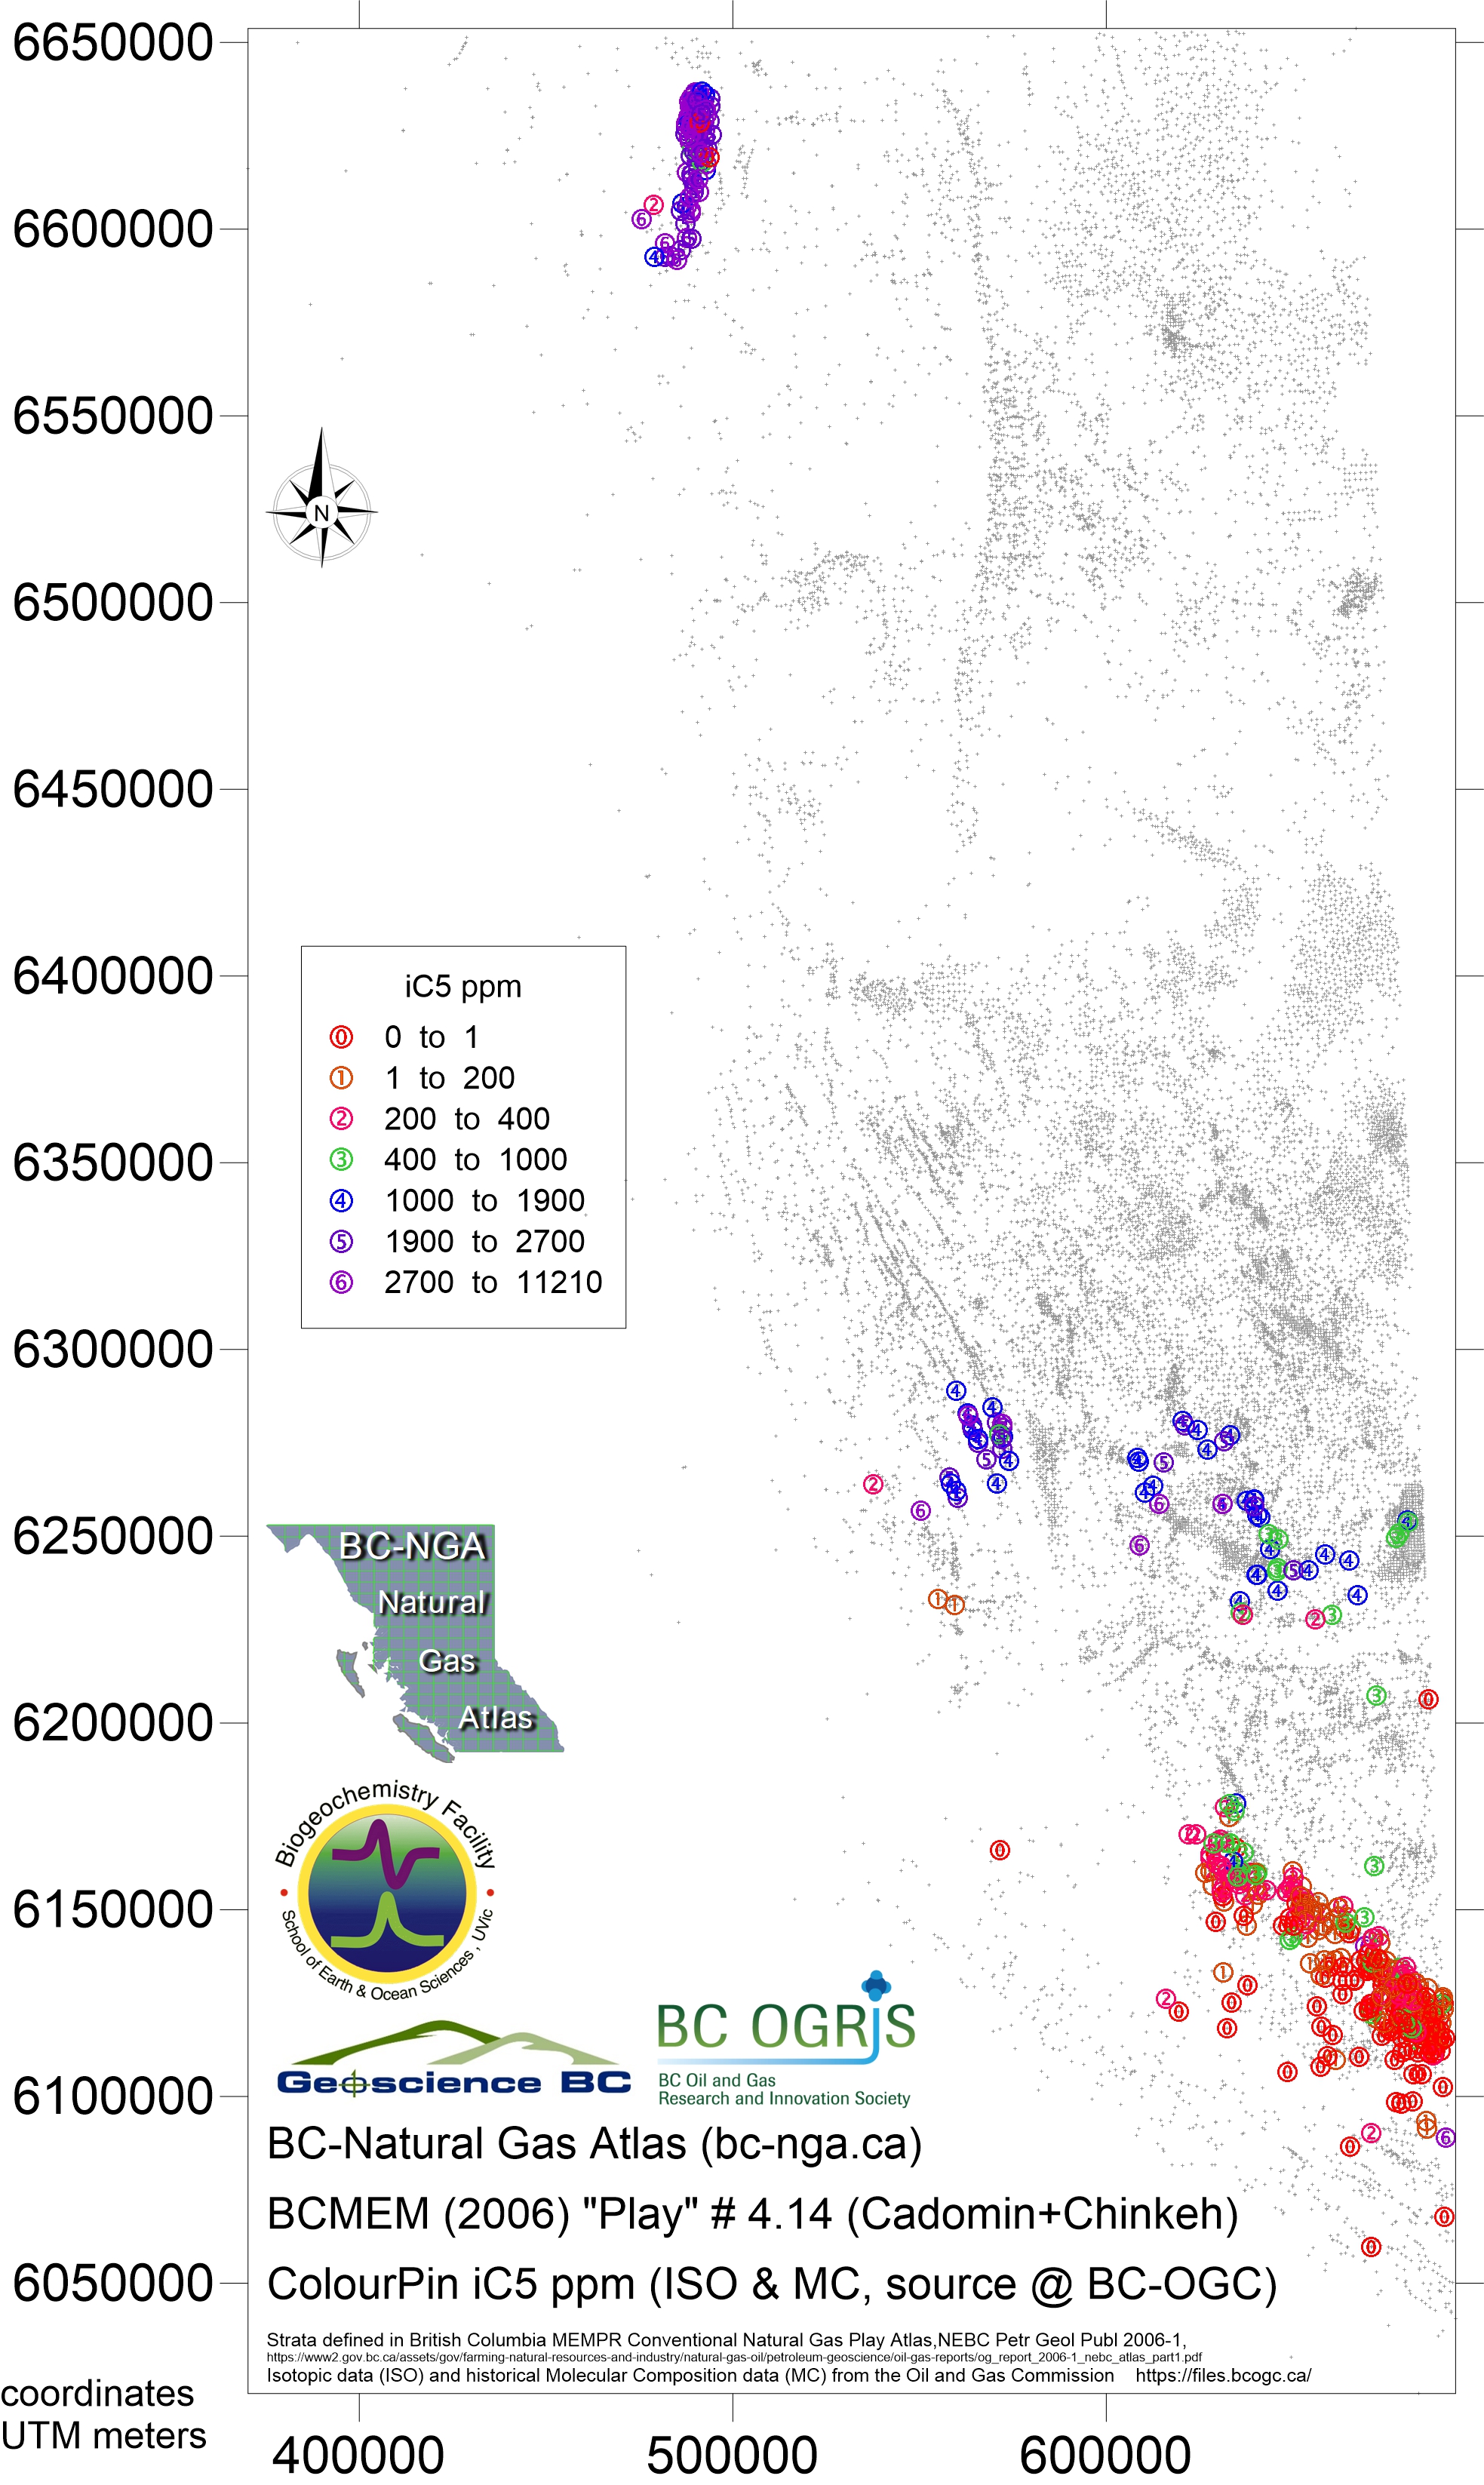
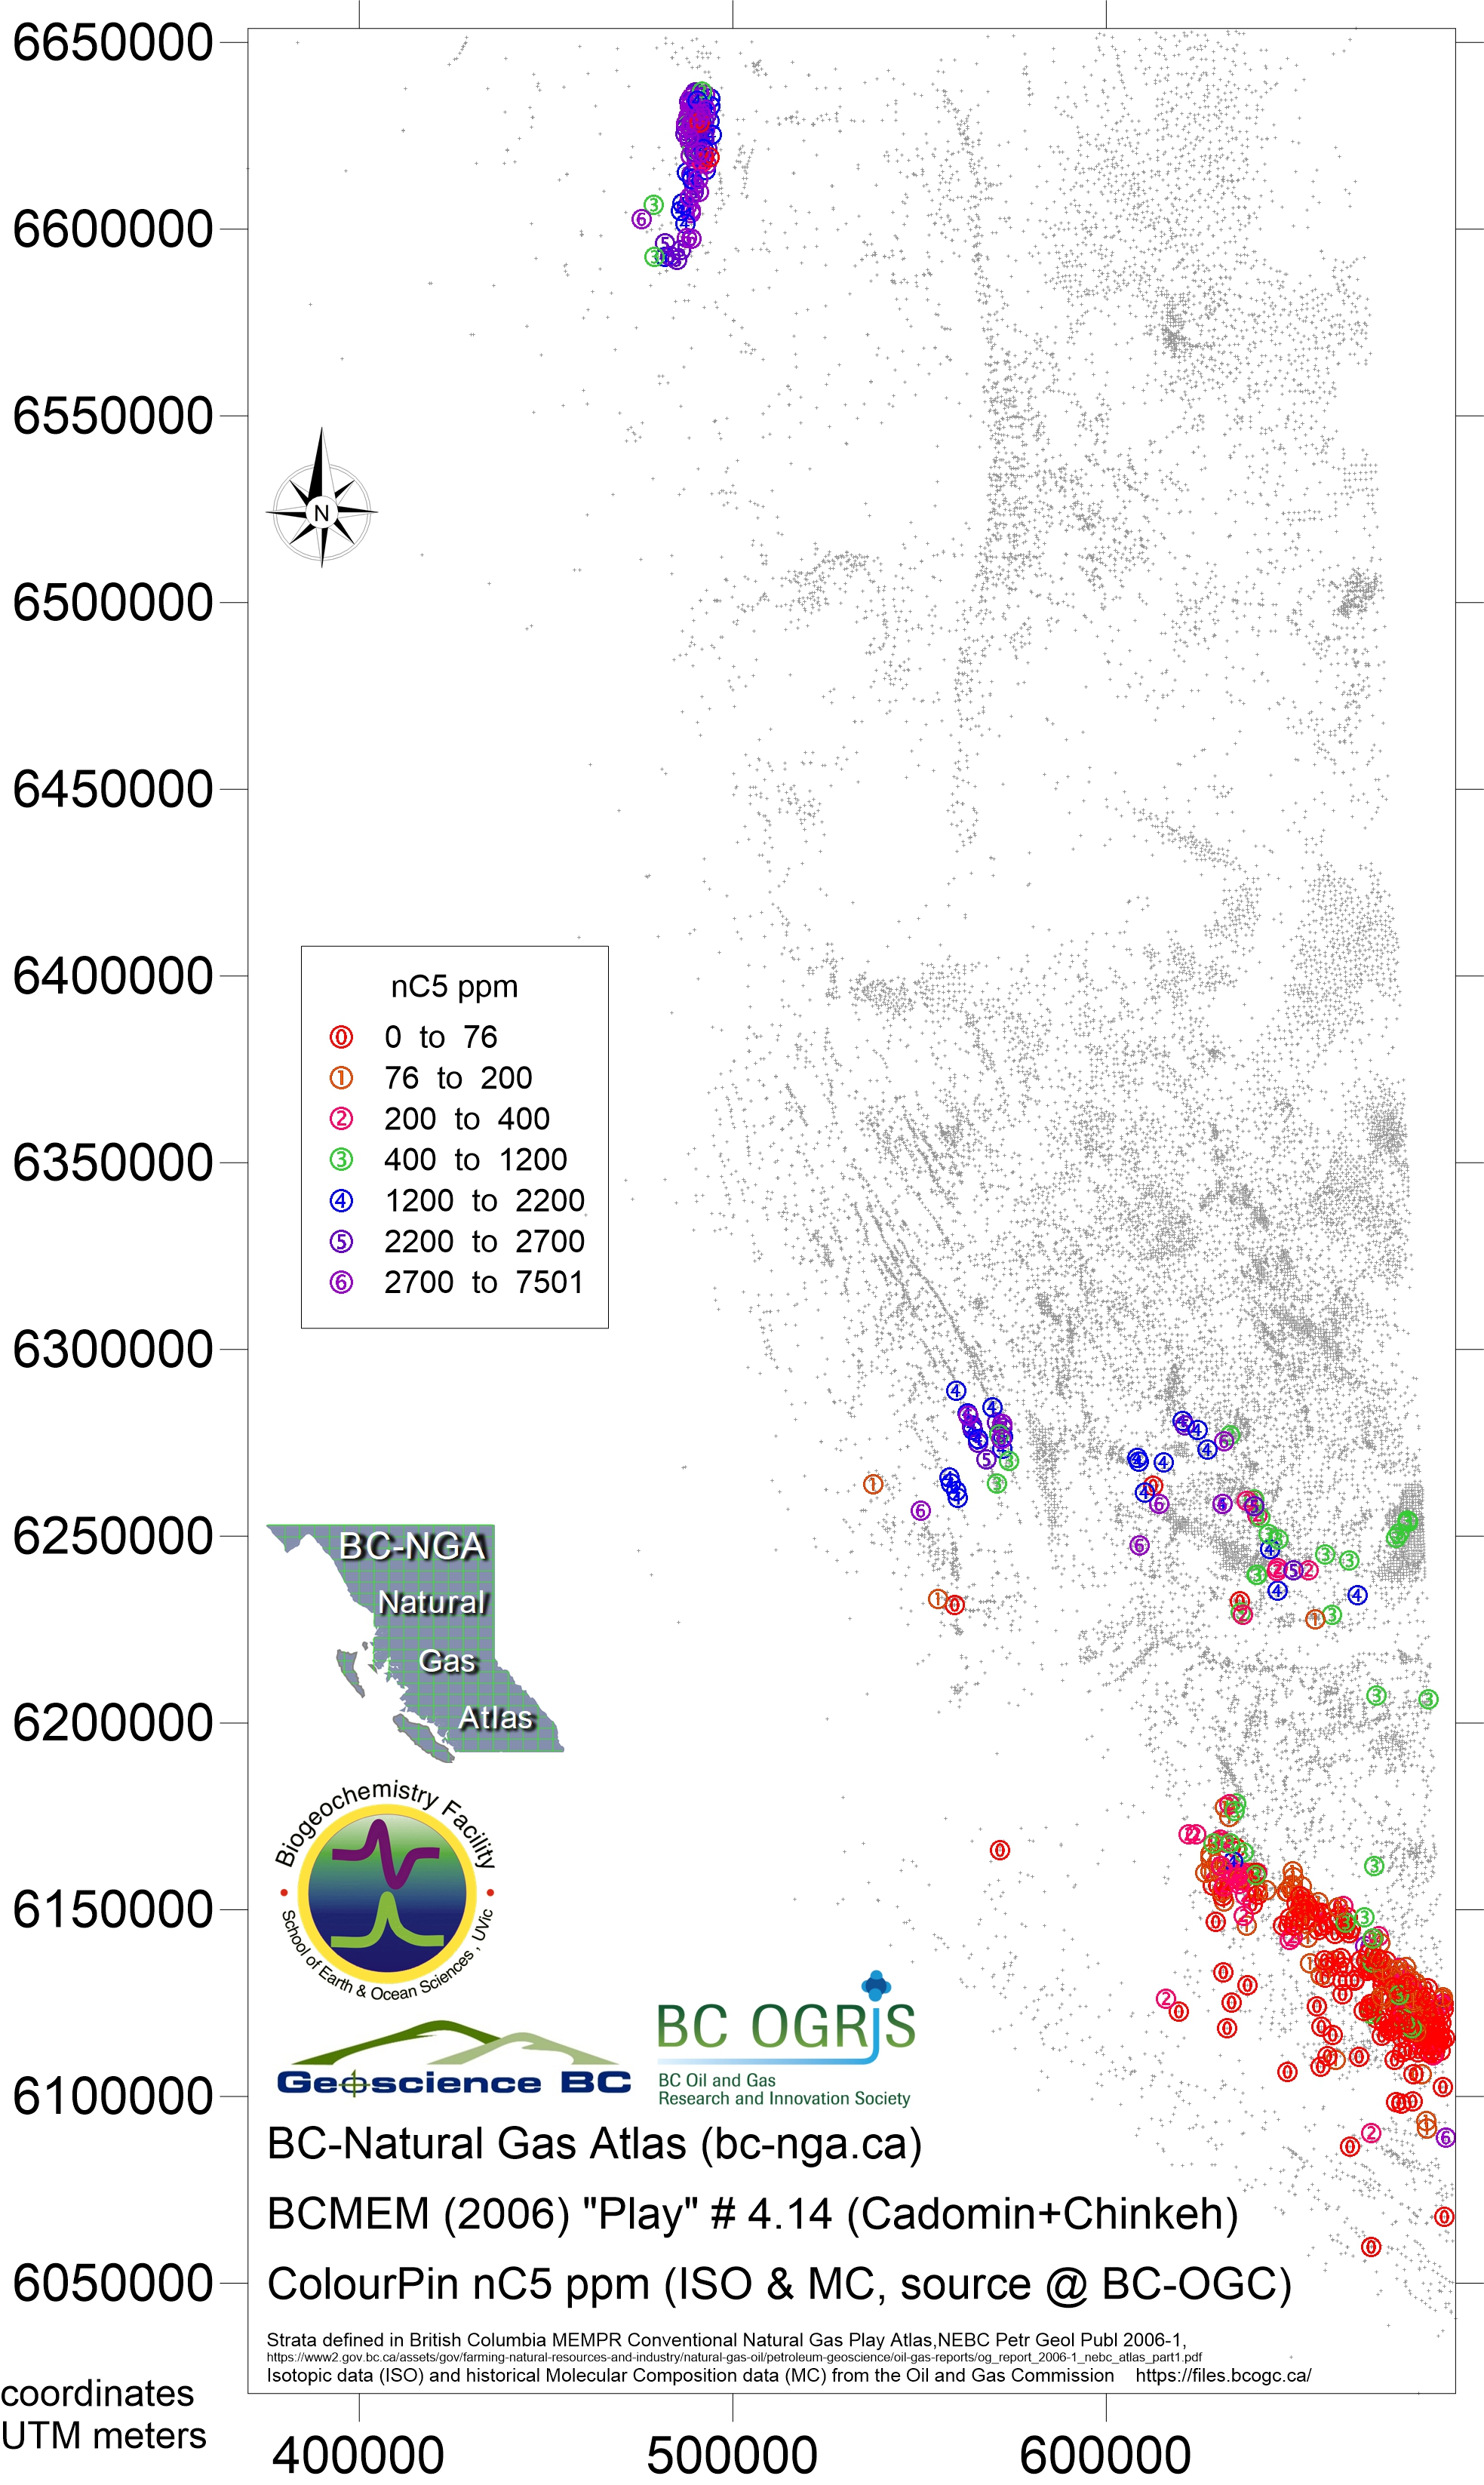
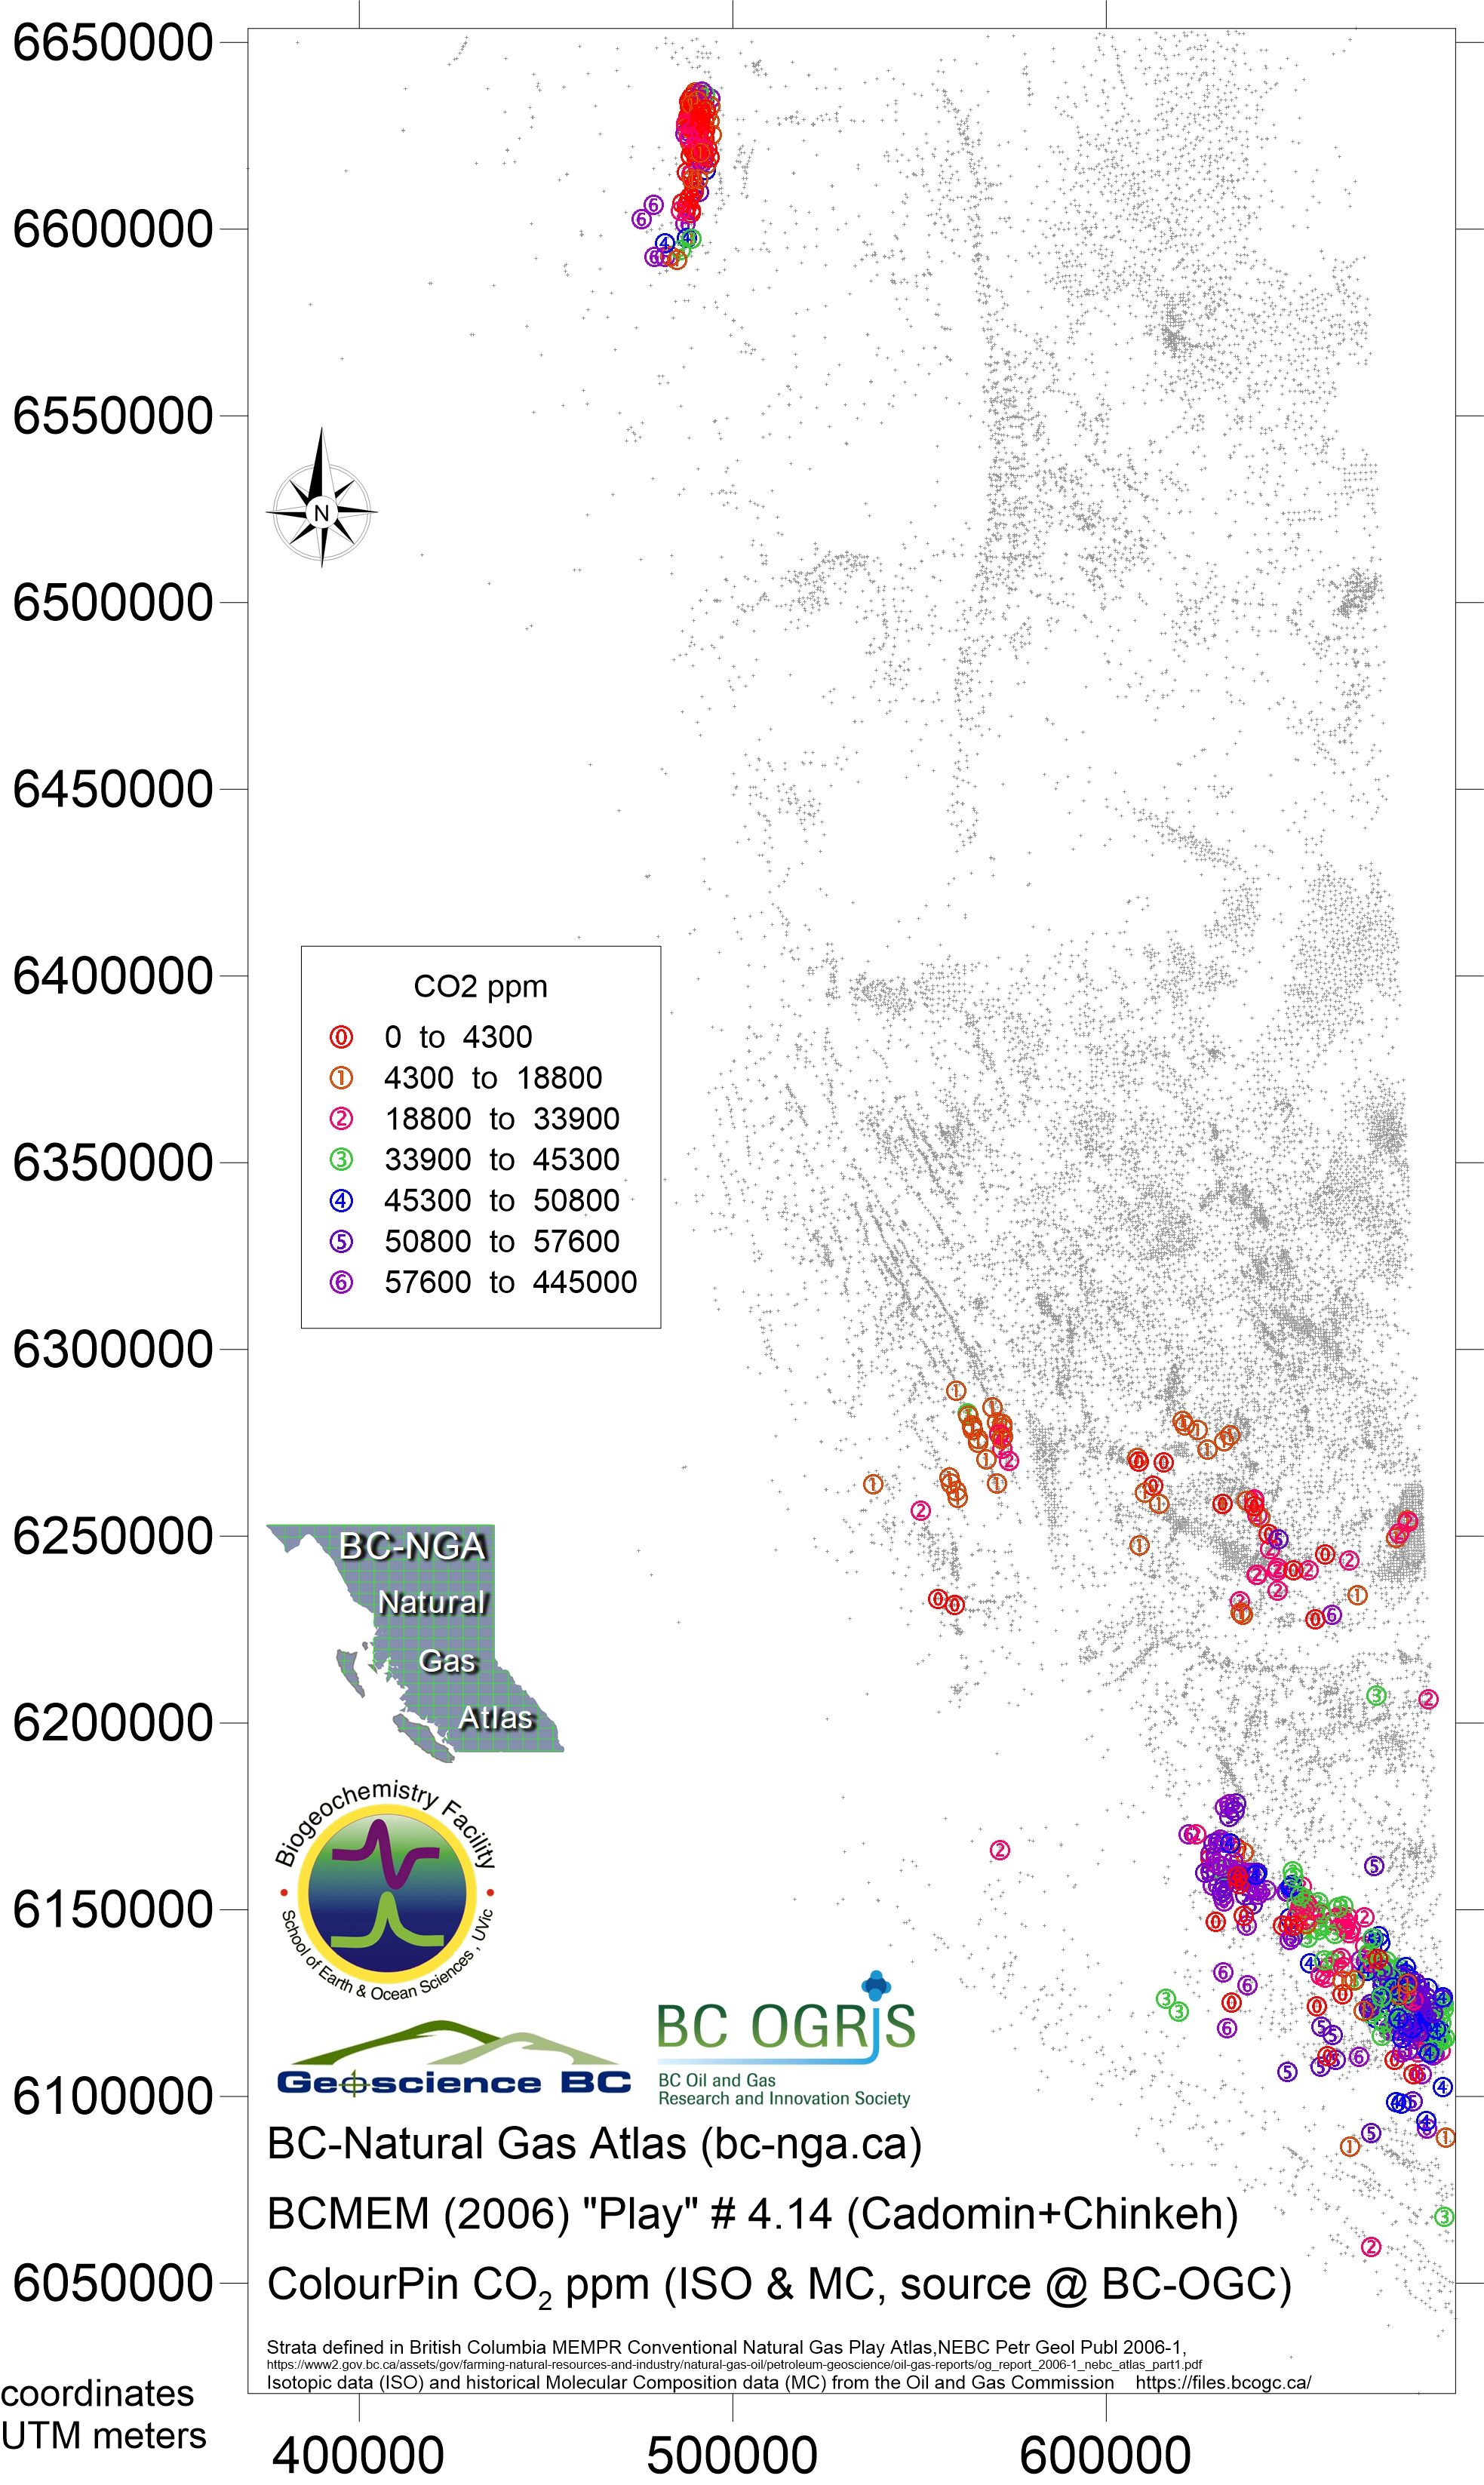
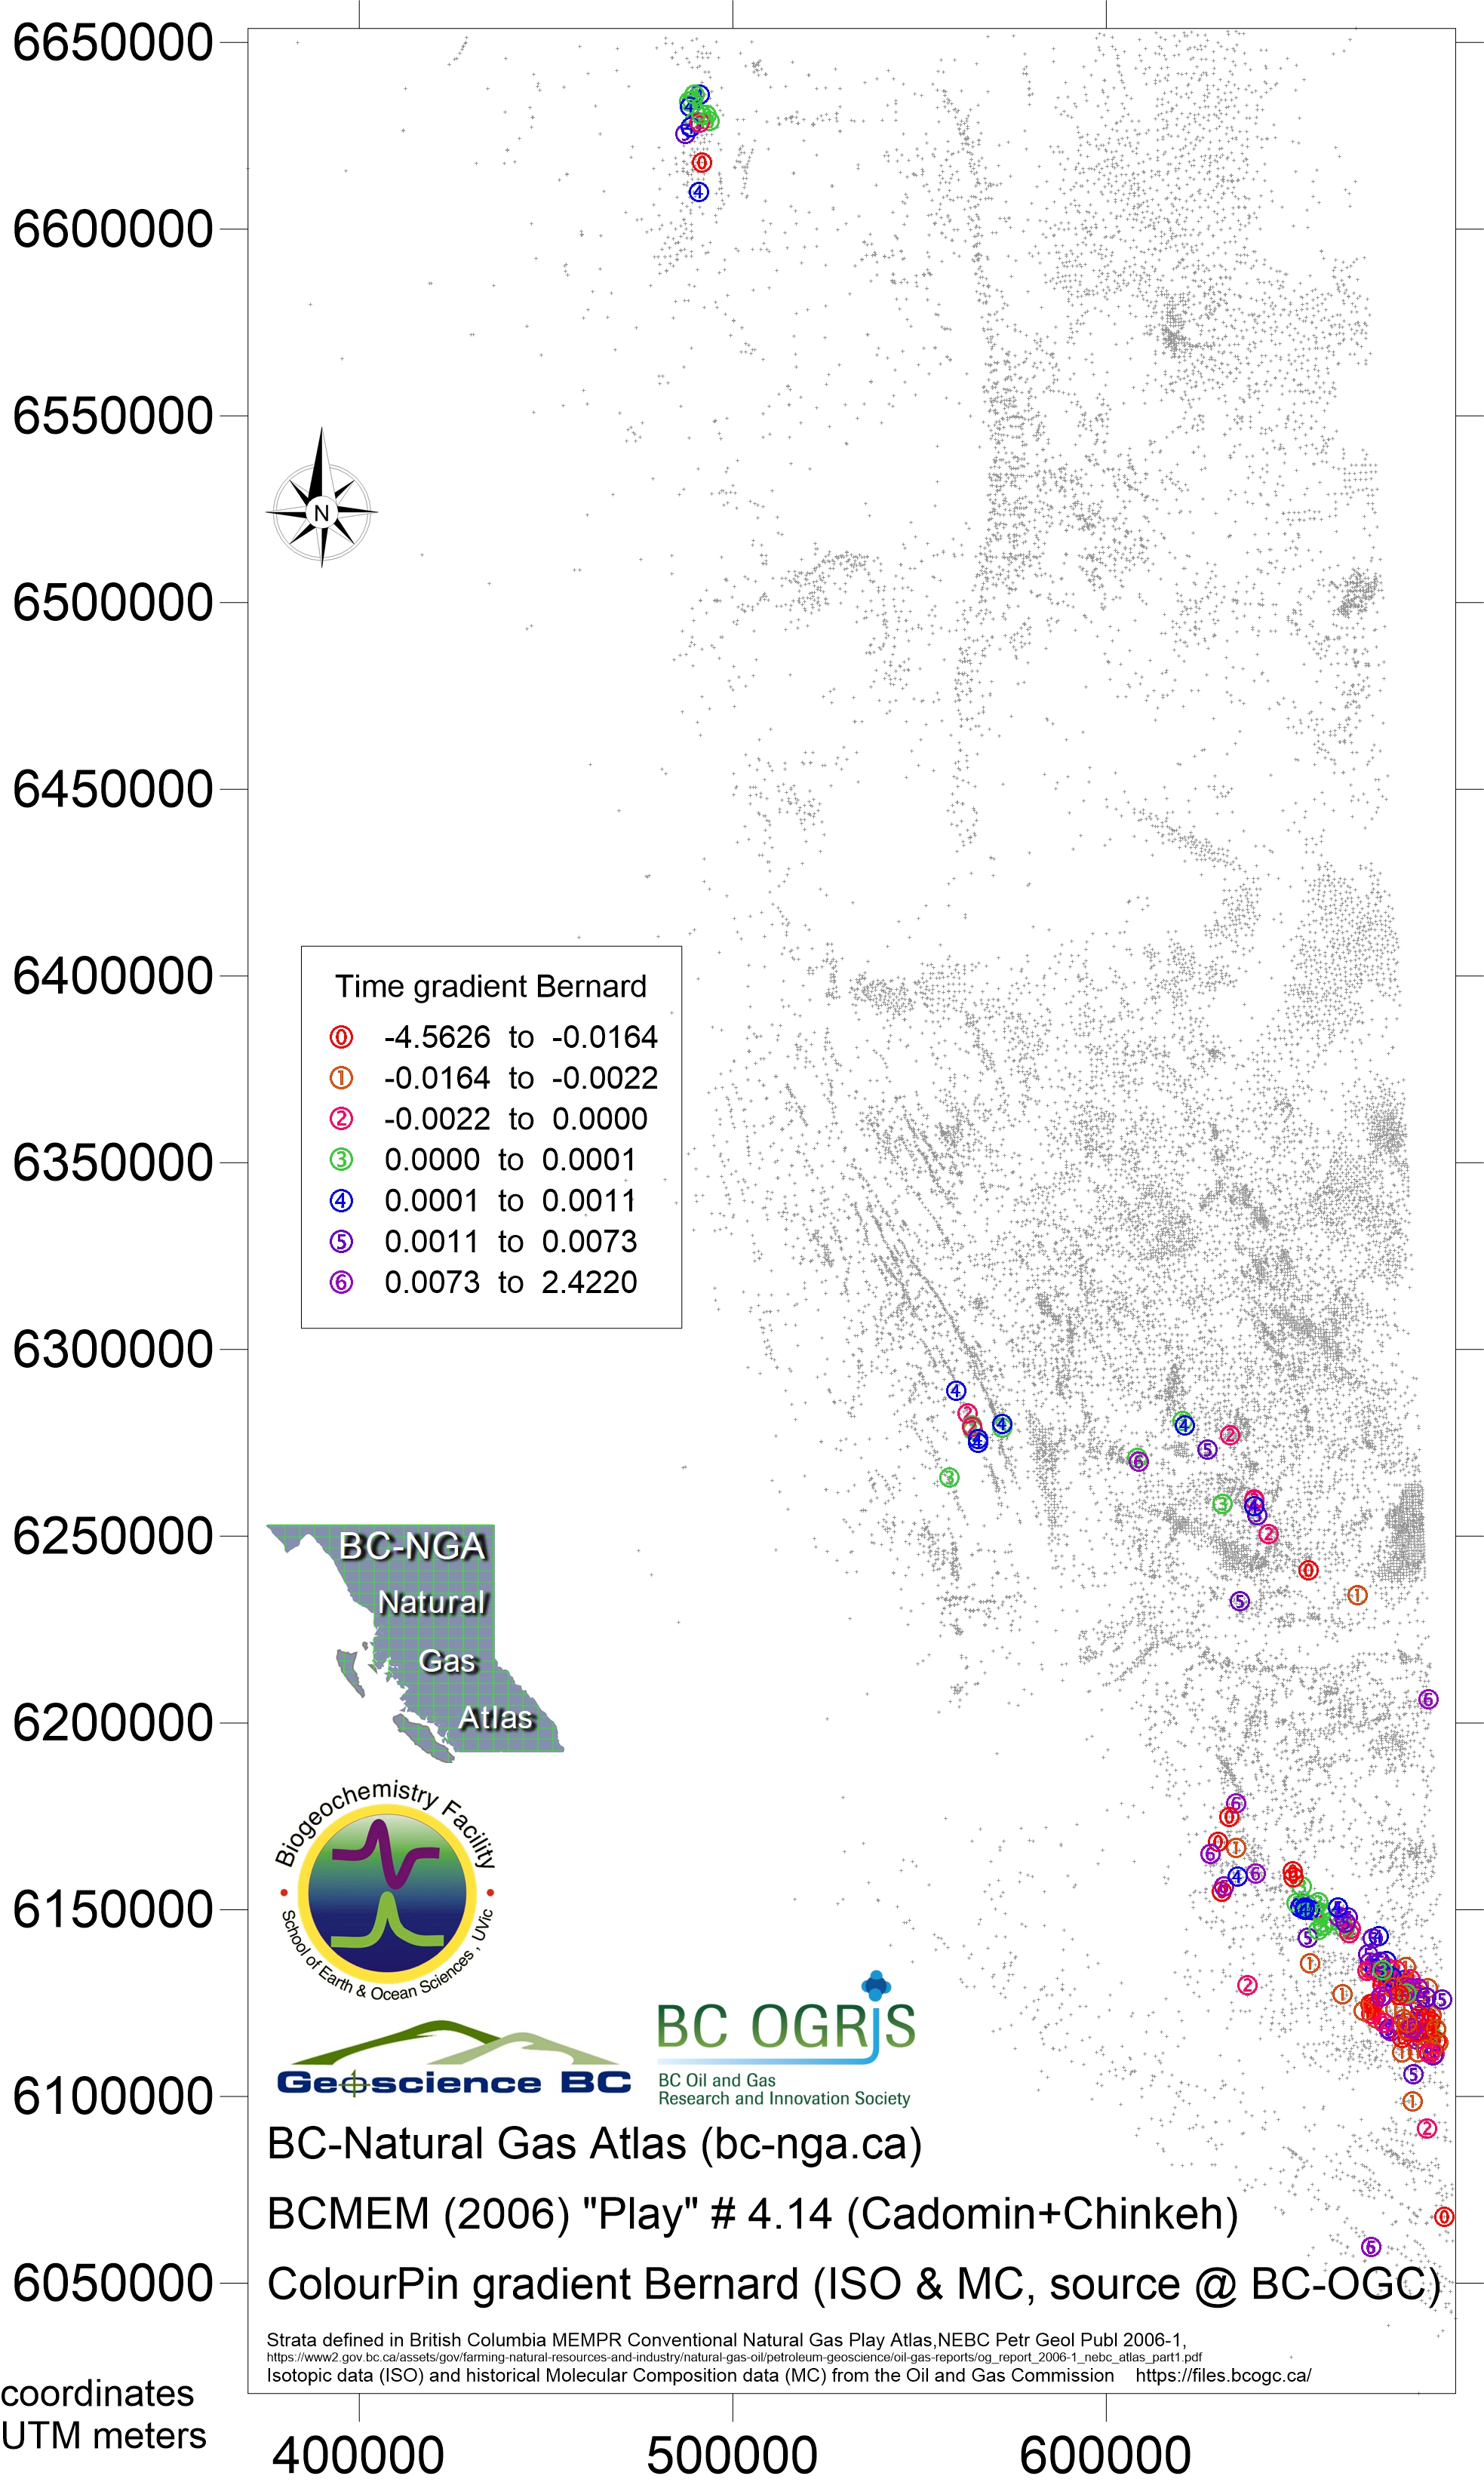
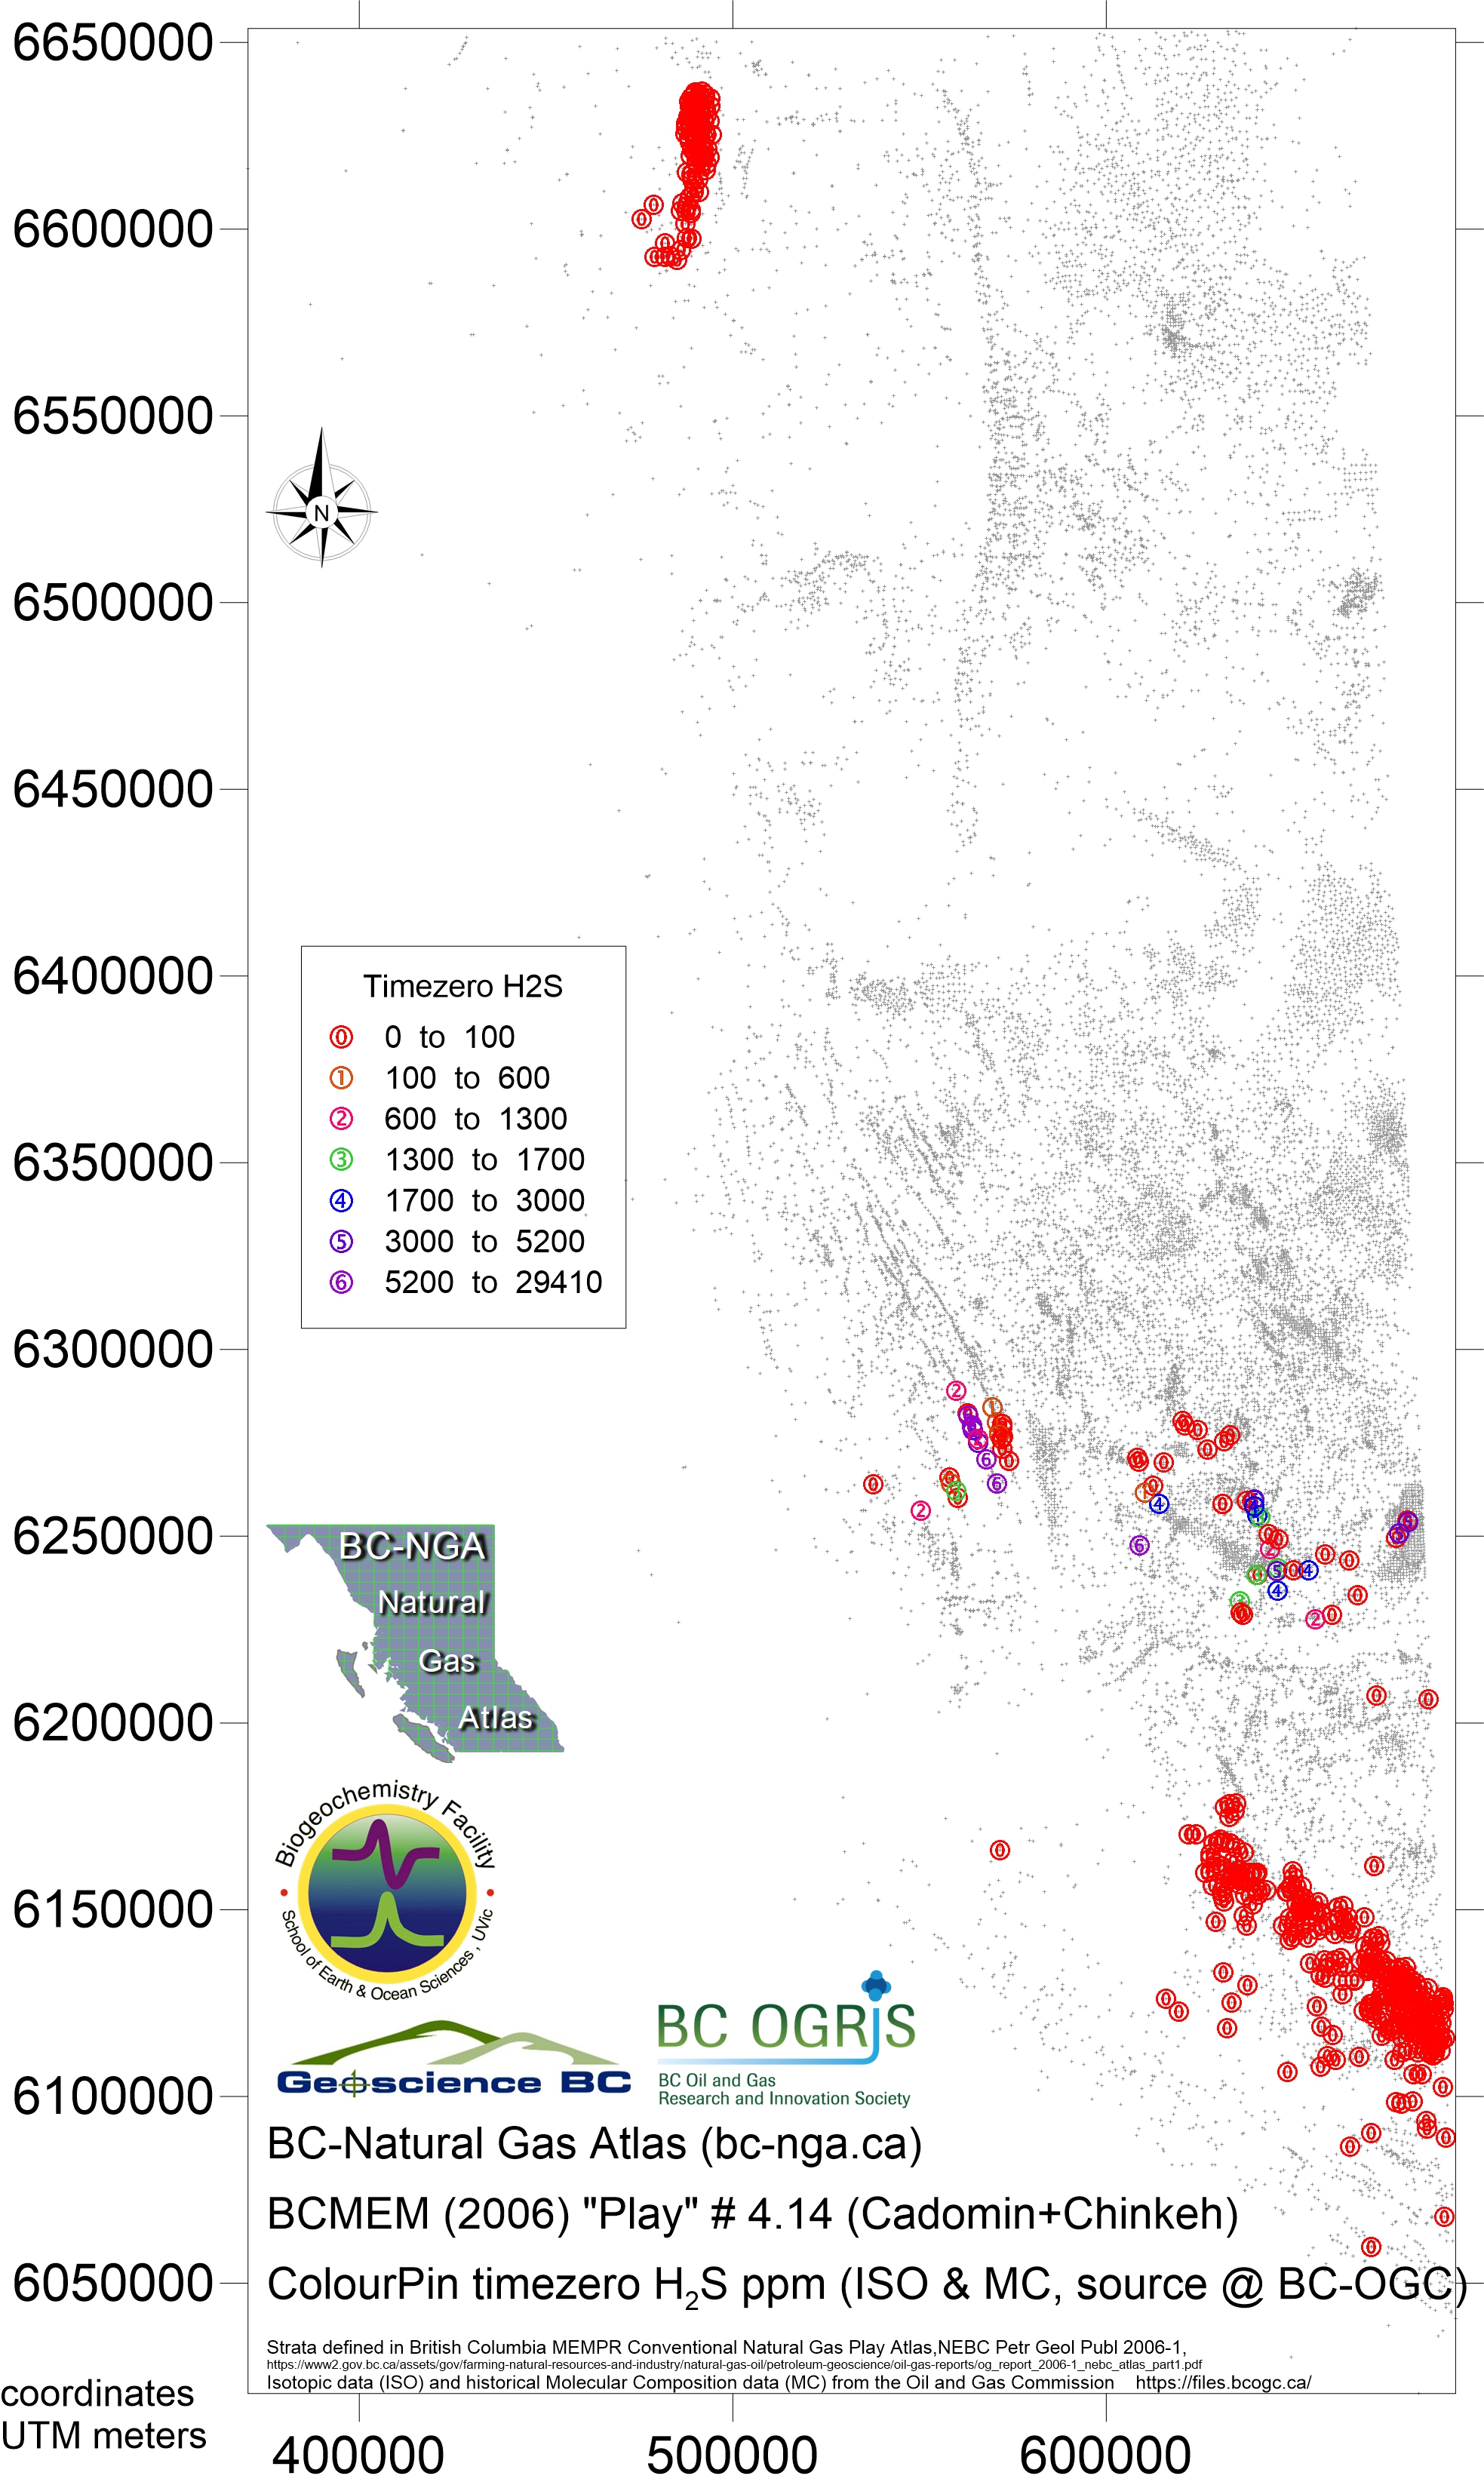
Play 4.14 Cadomin and Chinkeh Formations and equivalents
- Map078 Nov 2018 play 4.14 Cadomin/Chinkeh eqv Bernard ratio
- Map079 Nov 2018 play 4.14 Cadomin/Chinkeh eqv dryness ratio
- Map080 Nov 2018 play 4.14 Cadomin/Chinkeh eqv iC4nC4 ratio
- Map081 Nov 2018 play 4.14 Cadomin/Chinkeh eqv H2S ppm
- Map082 Nov 2018 play 4.14 Cadomin/Chinkeh eqv CH4 ppm
- Map083 Nov 2018 play 4.14 Cadomin/Chinkeh eqv C2H6 ppm
- Map084 Nov 2018 play 4.14 Cadomin/Chinkeh eqv C3H8 ppm
- Map085 Nov 2018 play 4.14 Cadomin/Chinkeh eqv iC4H10 ppm
- Map086 Nov 2018 play 4.14 Cadomin/Chinkeh eqv nC4H10 ppm
- Map087 Nov 2018 play 4.14 Cadomin/Chinkeh eqv iC5H12 ppm
- Map088 Nov 2018 play 4.14 Cadomin/Chinkeh eqv nC5H12 ppm
- Map089 Nov 2018 play 4.14 Cadomin/Chinkeh eqv C6H14 plus ppm
- Map090 Nov 2018 play 4.14 Cadomin/Chinkeh eqv CO2 ppm
- Map091 Nov 2018 play 4.14 Cadomin/Chinkeh eqv δ13CH4
- Map092 Nov 2018 play 4.14 Cadomin/Chinkeh eqv δ13C2H6
- Map093 Nov 2018 play 4.14 Cadomin/Chinkeh eqv δ13C3H8
- Map094 Nov 2018 play 4.14 Cadomin/Chinkeh eqv time series gradient Bernard ratio
- Map095 Nov 2018 play 4.14 Cadomin/Chinkeh eqv time series gradient CO2
- Map096 Nov 2018 play 4.14 Cadomin/Chinkeh eqv time series gradient H2S
- Map097 Nov 2018 play 4.14 Cadomin/Chinkeh eqv time series start point Bernard ratio
- Map098 Nov 2018 play 4.14 Cadomin/Chinkeh eqv time series start point CO2
- Map099 Nov 2018 play 4.14 Cadomin/Chinkeh eqv time series start point H22
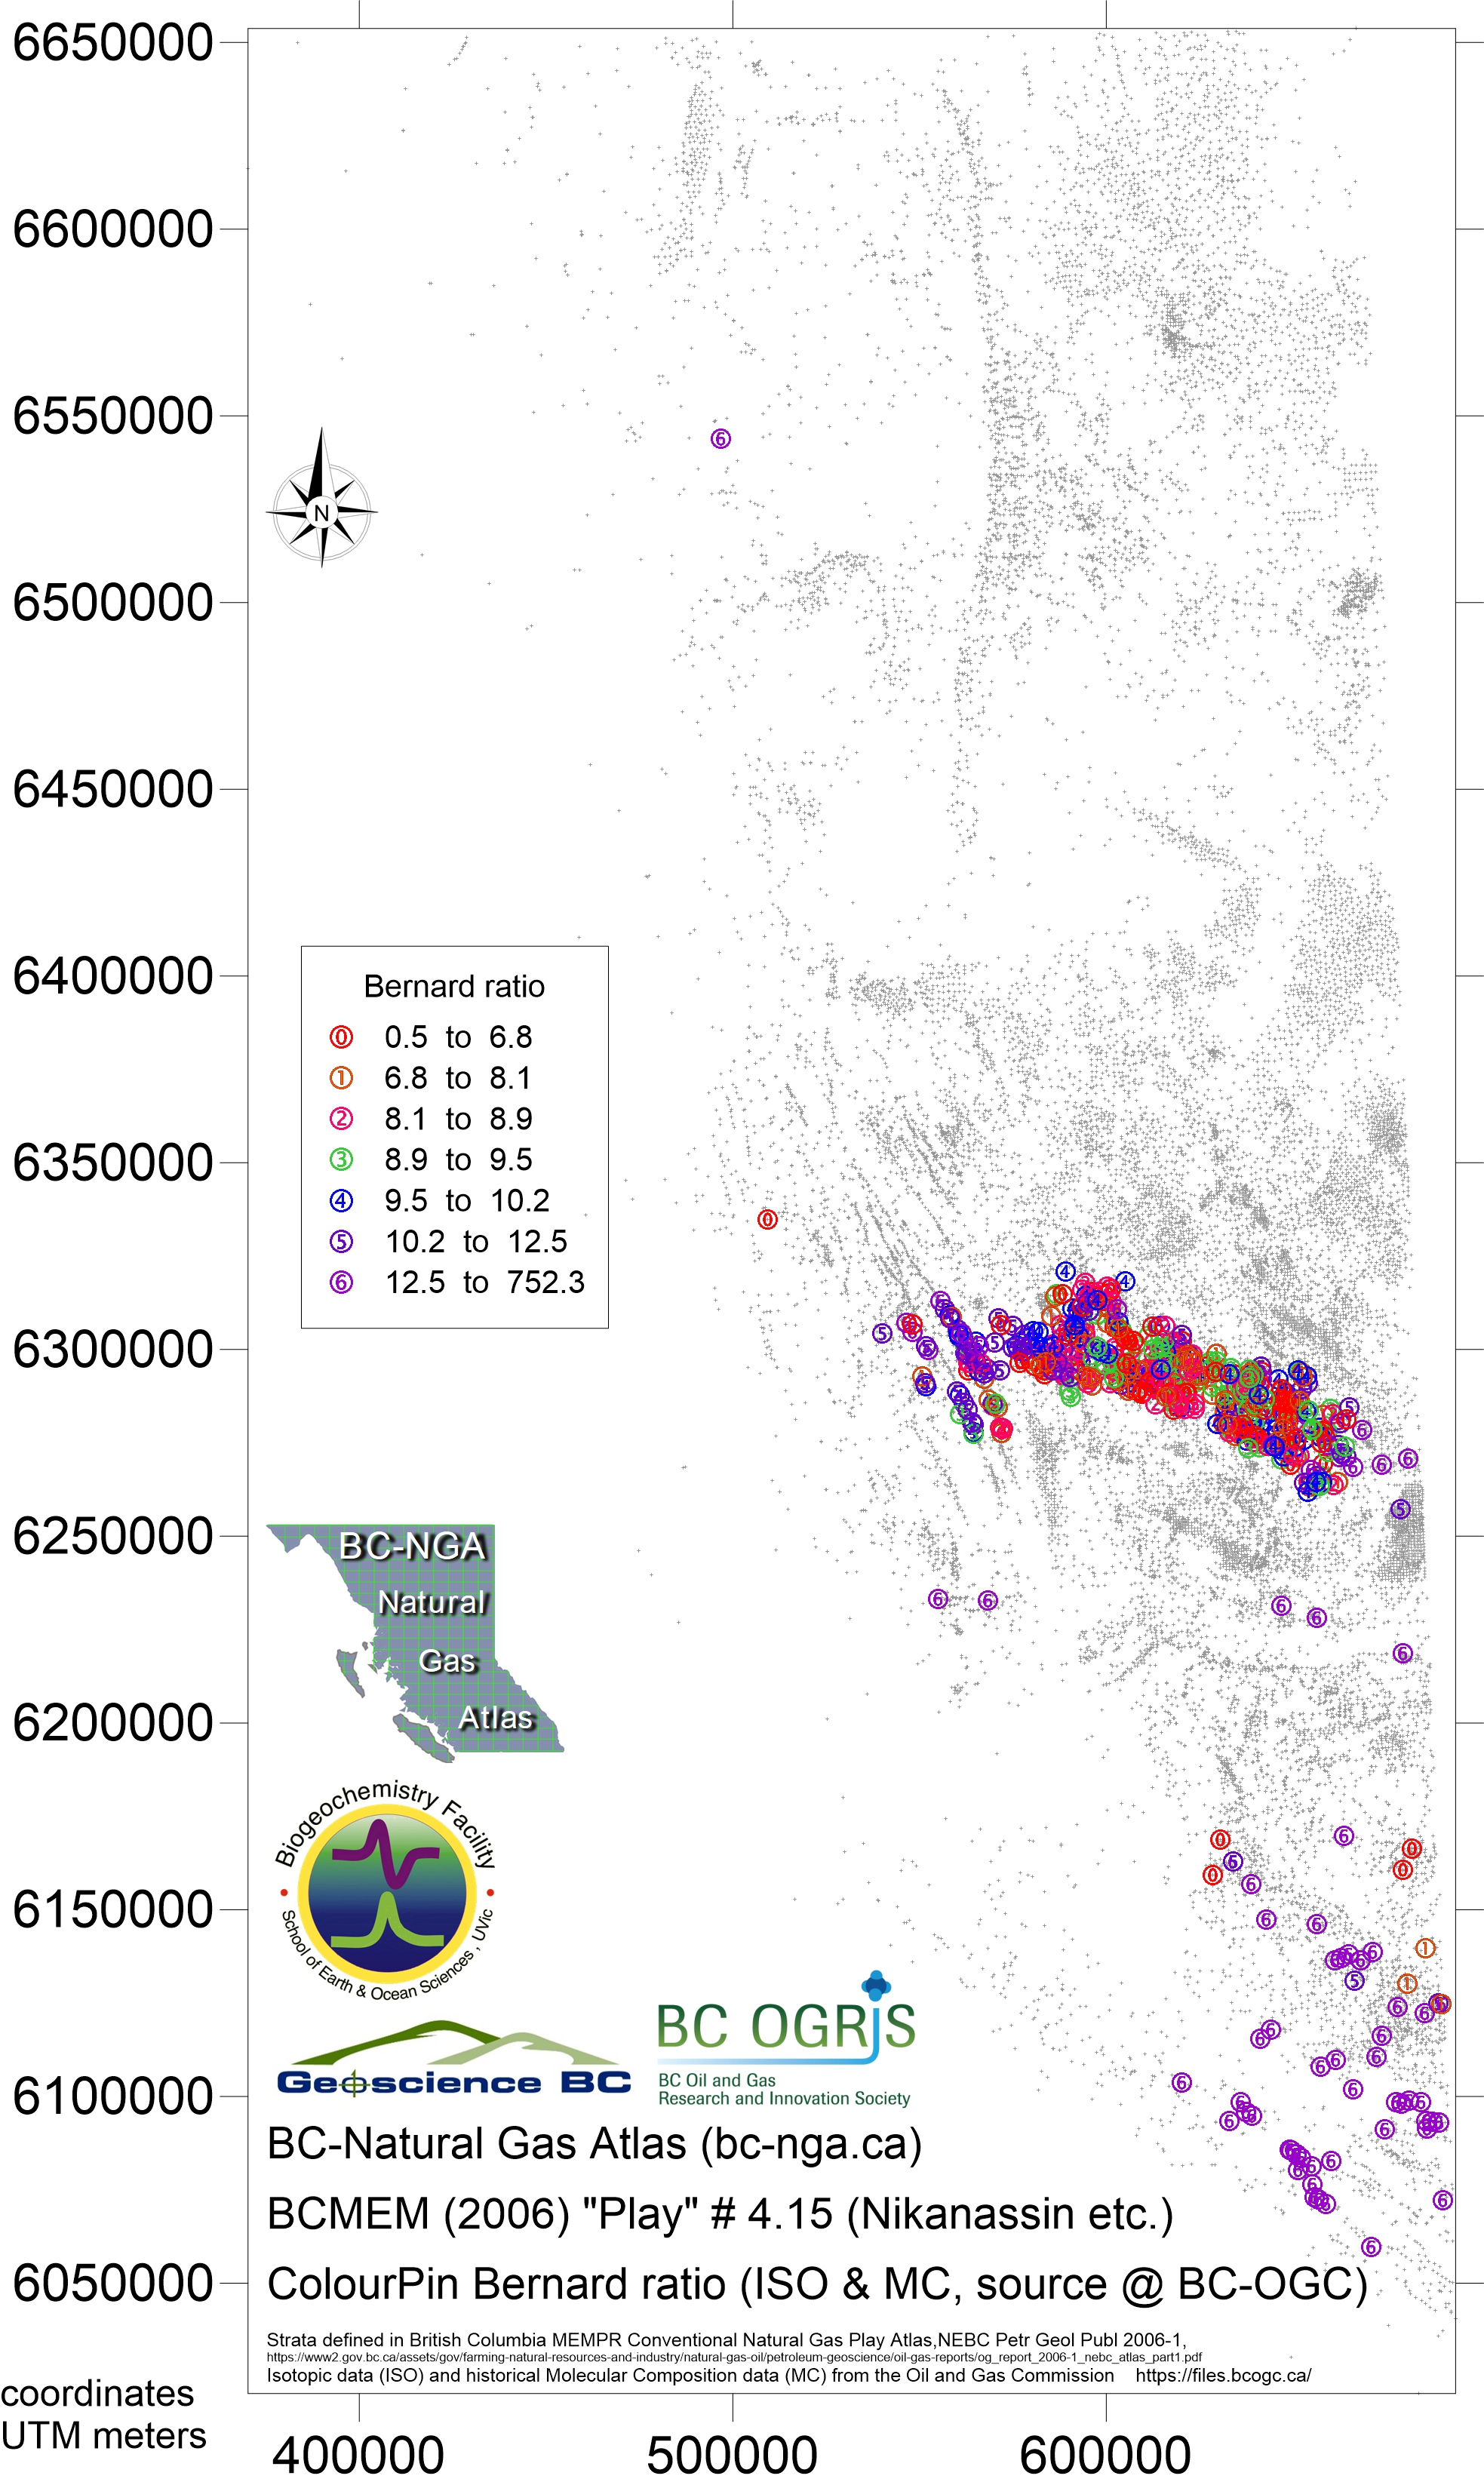
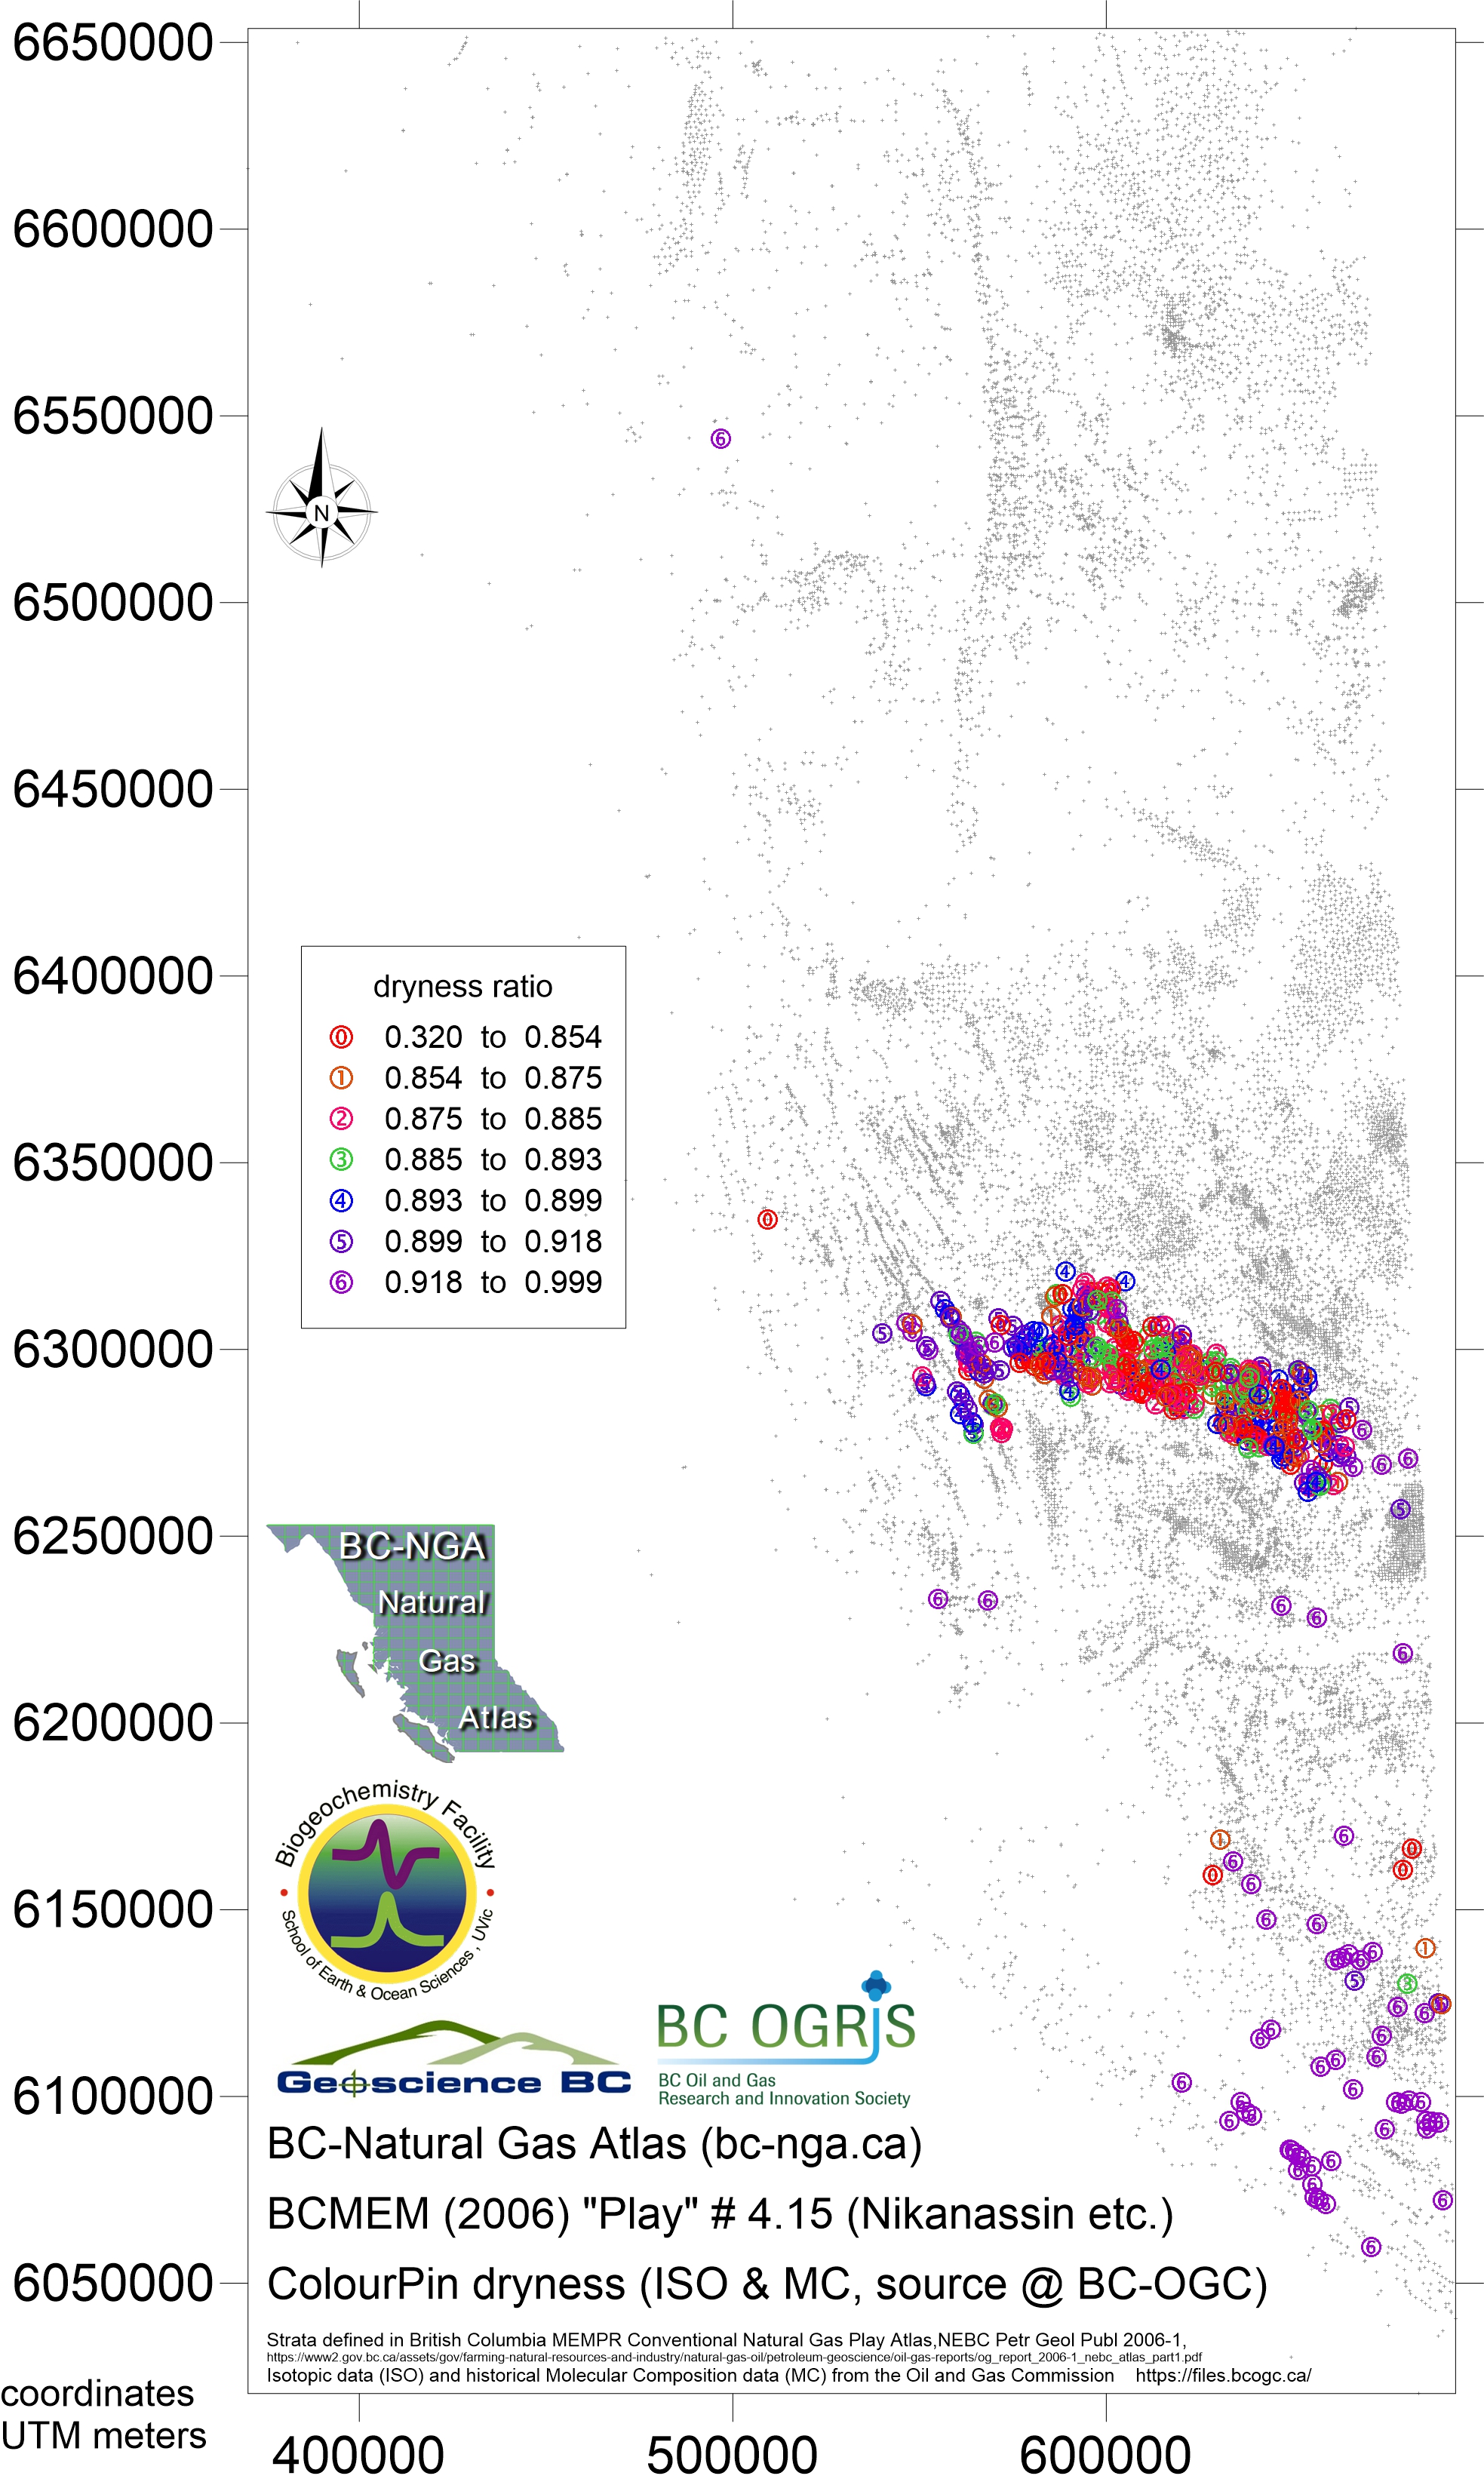
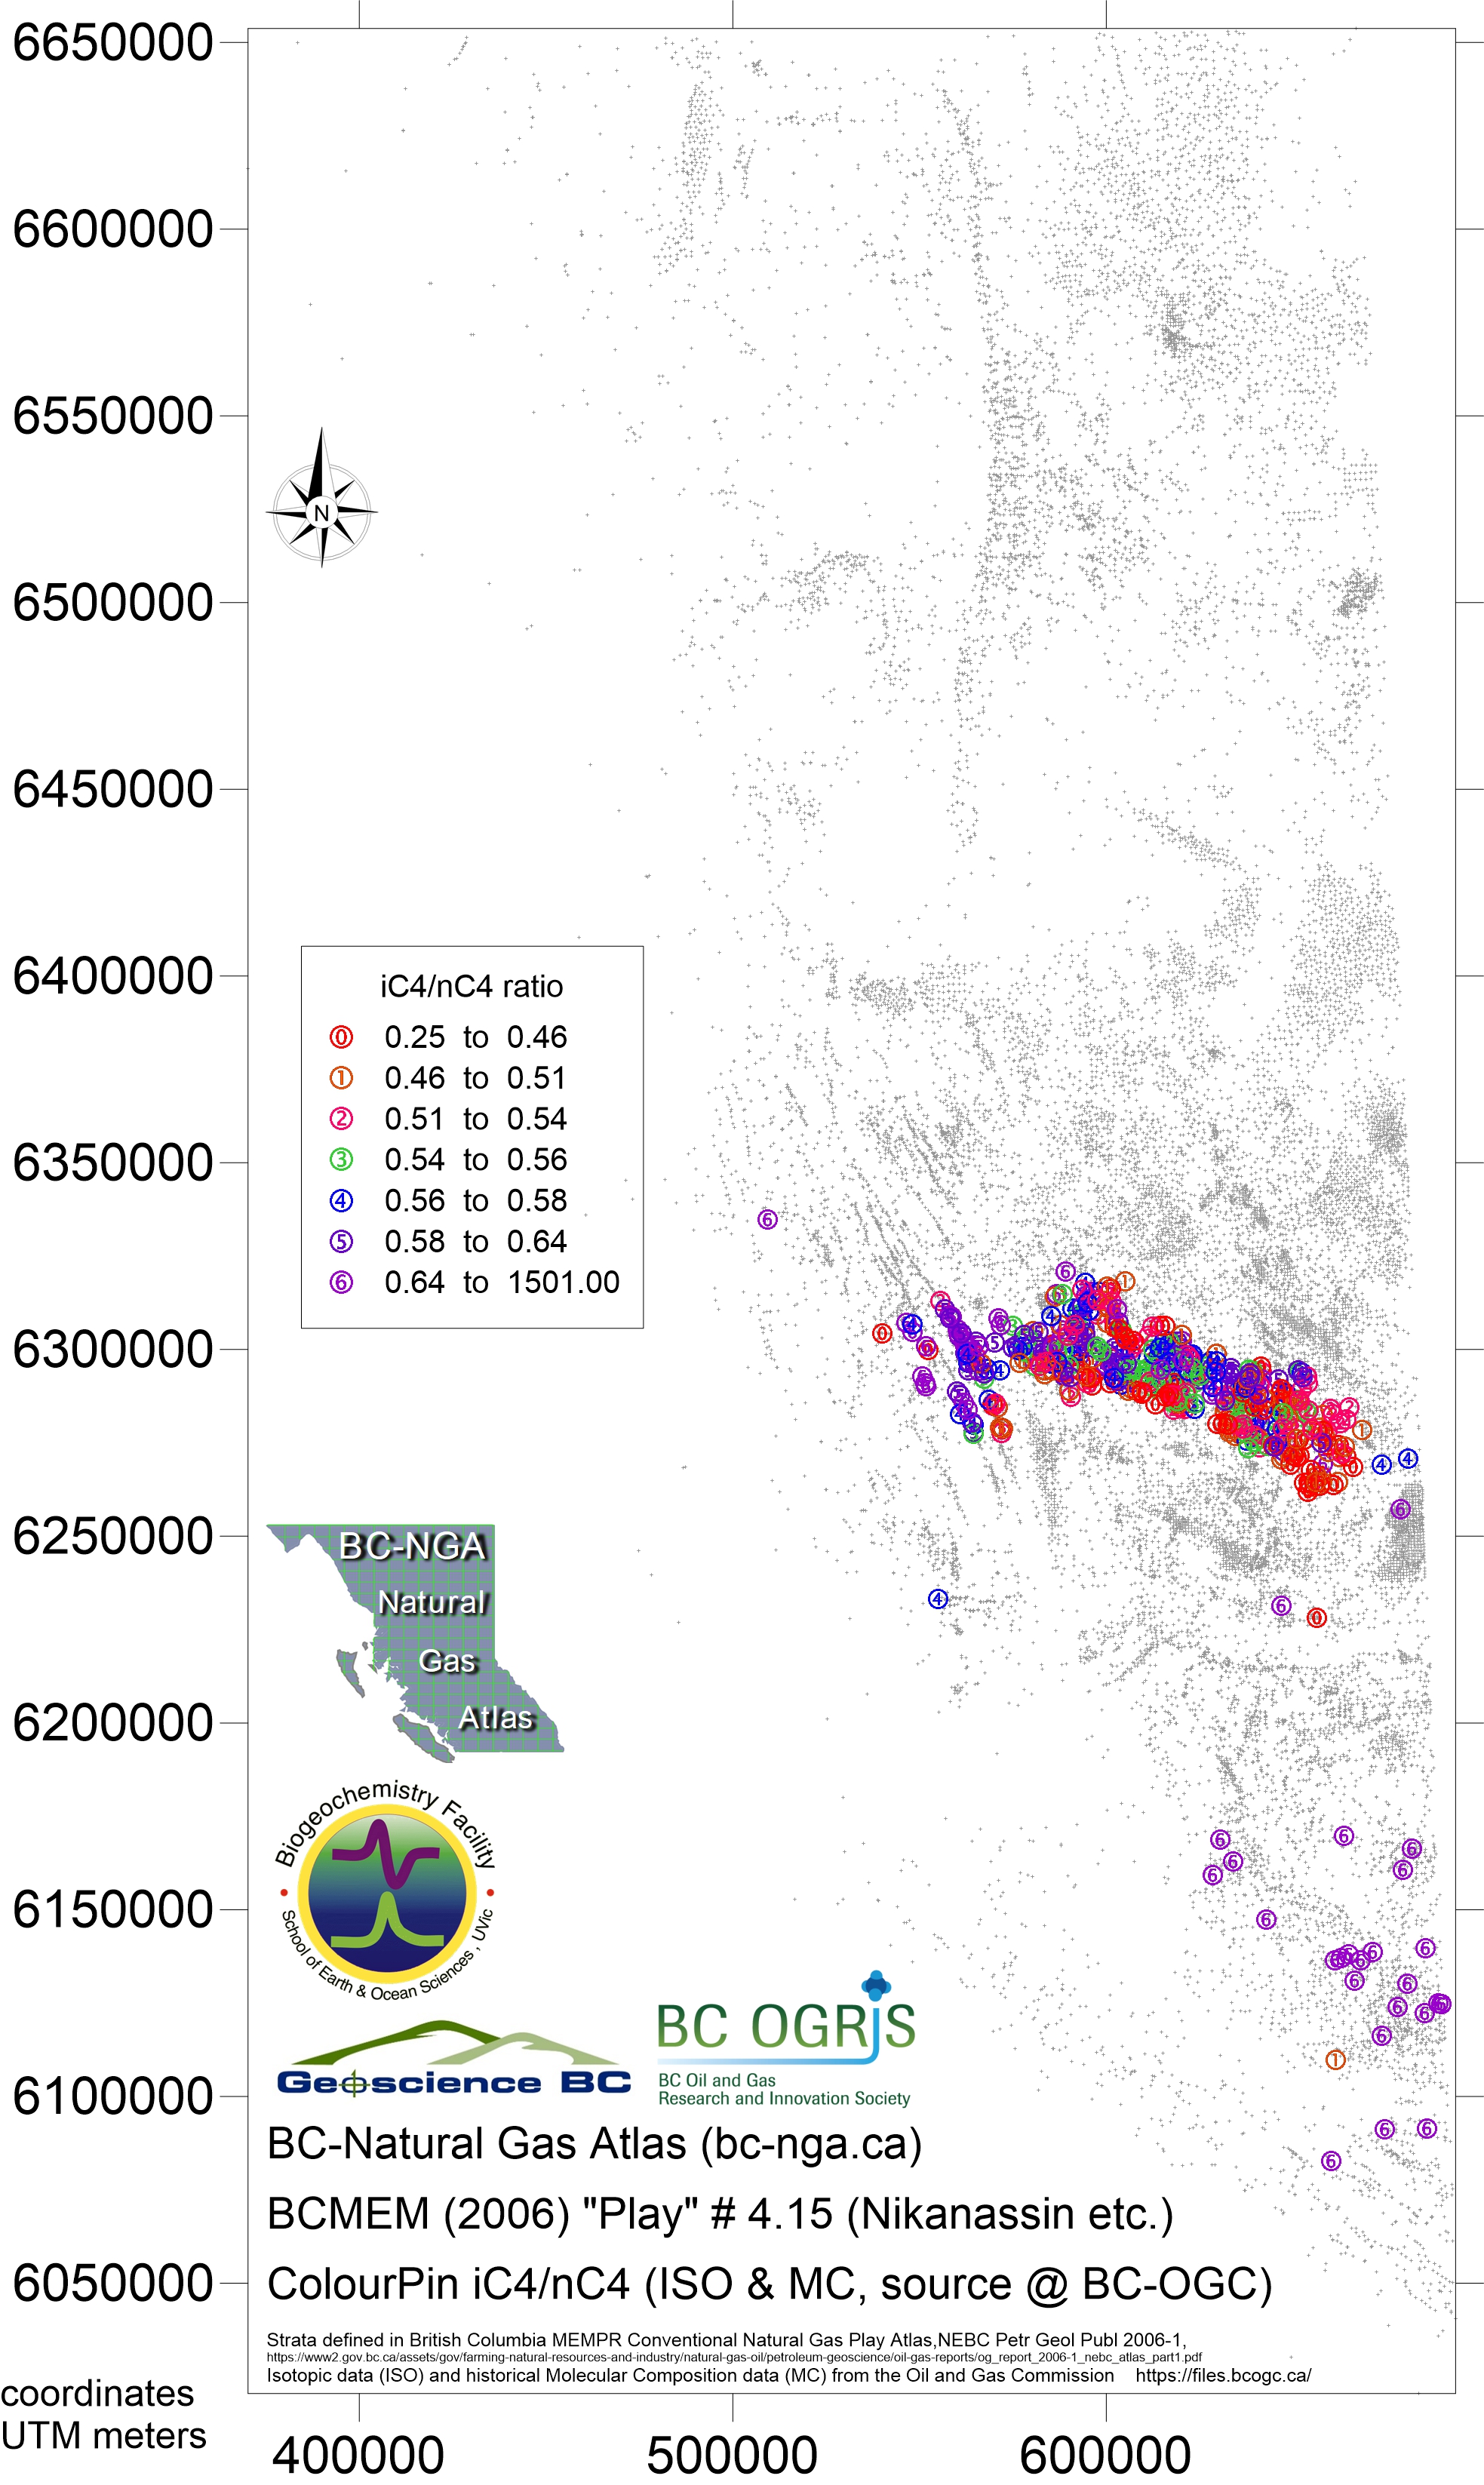
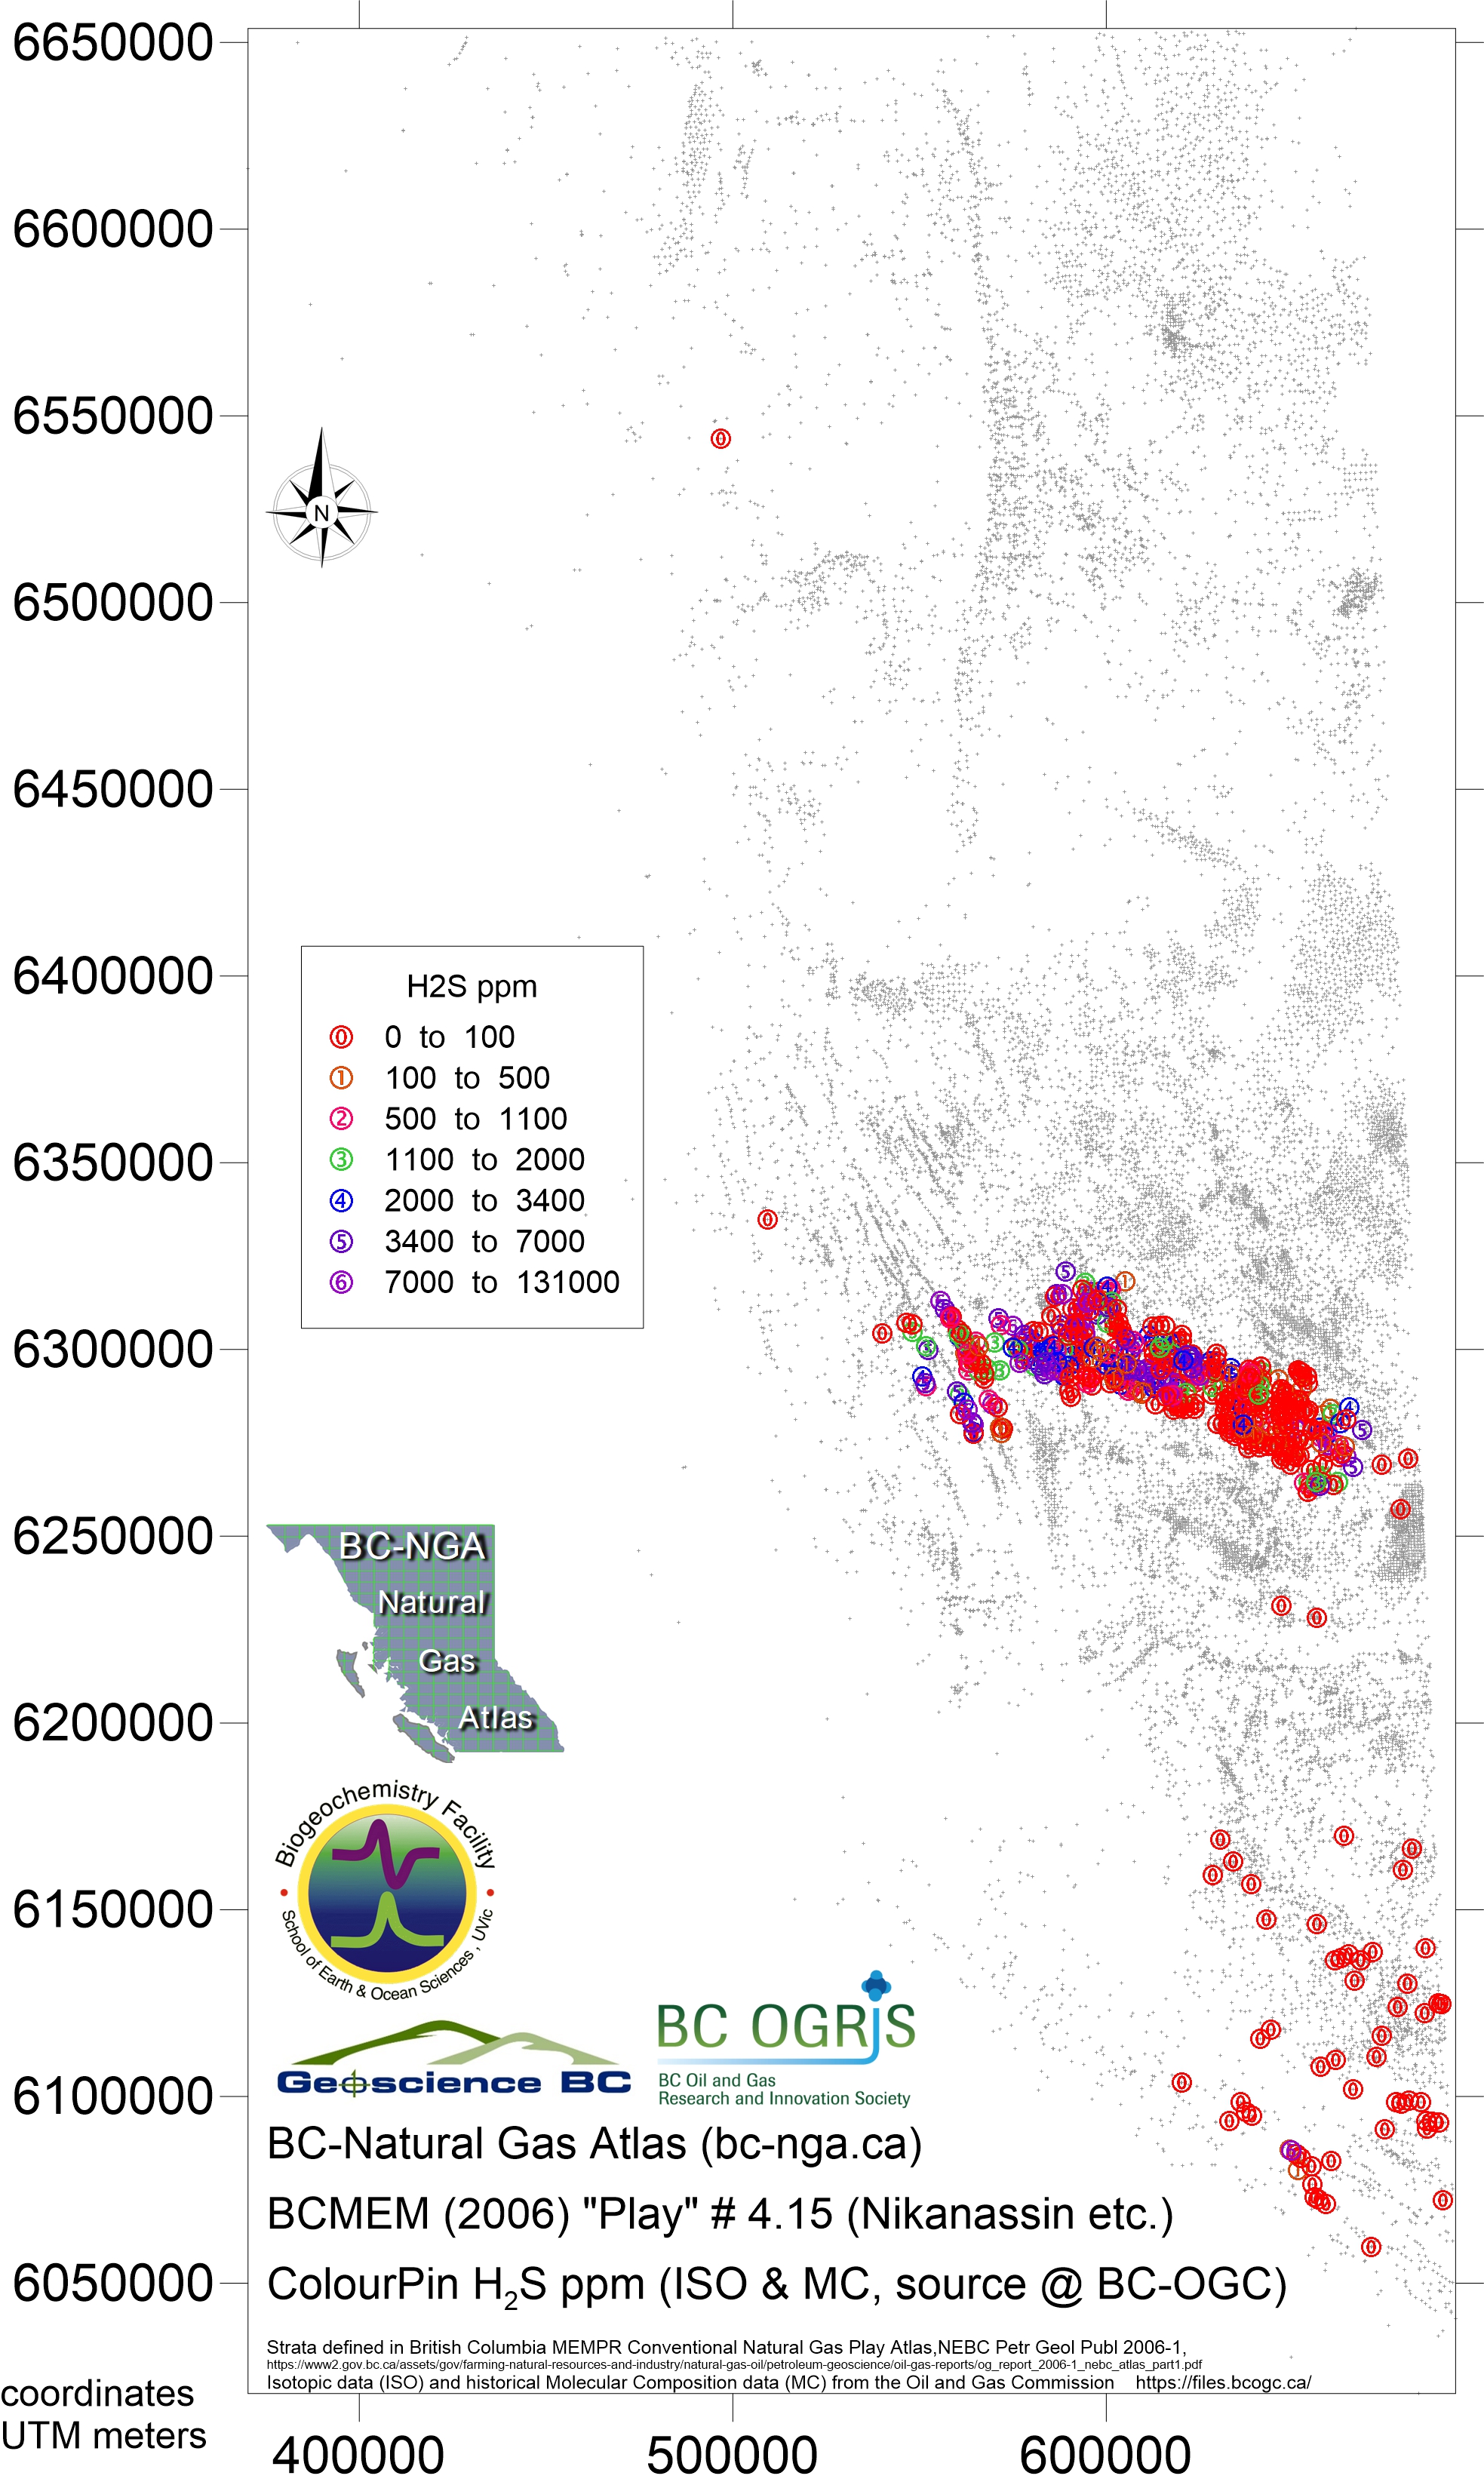
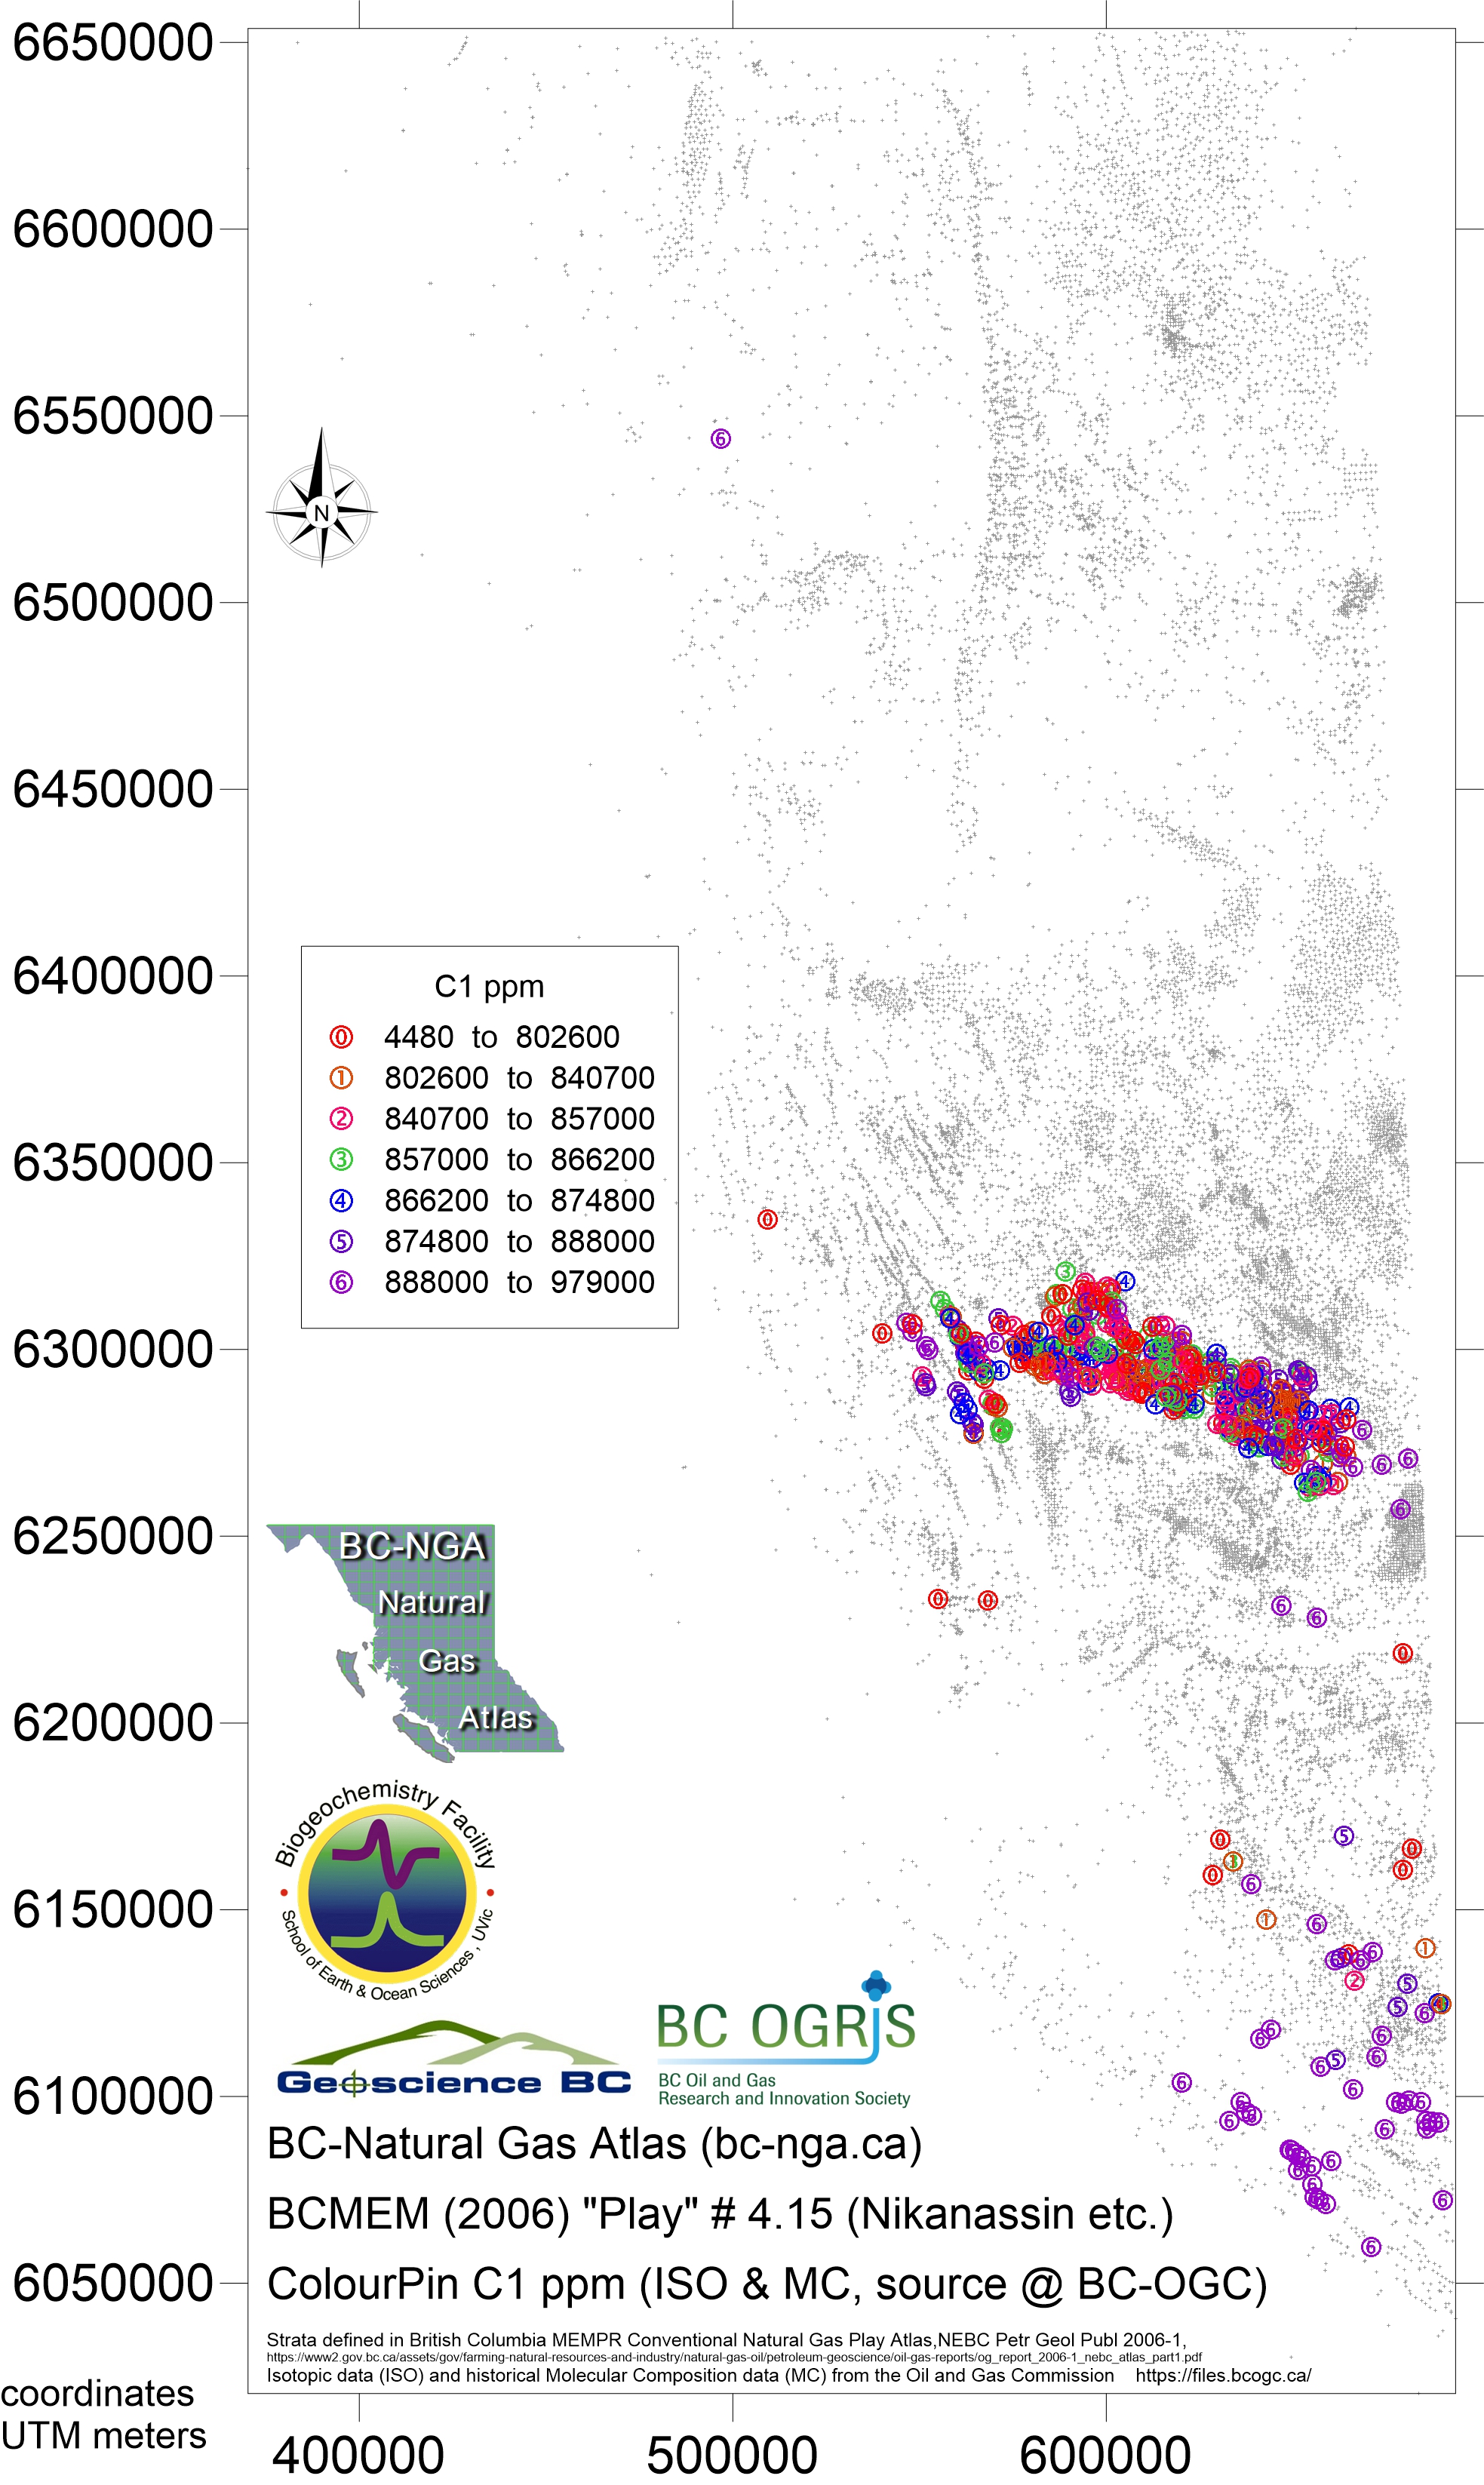
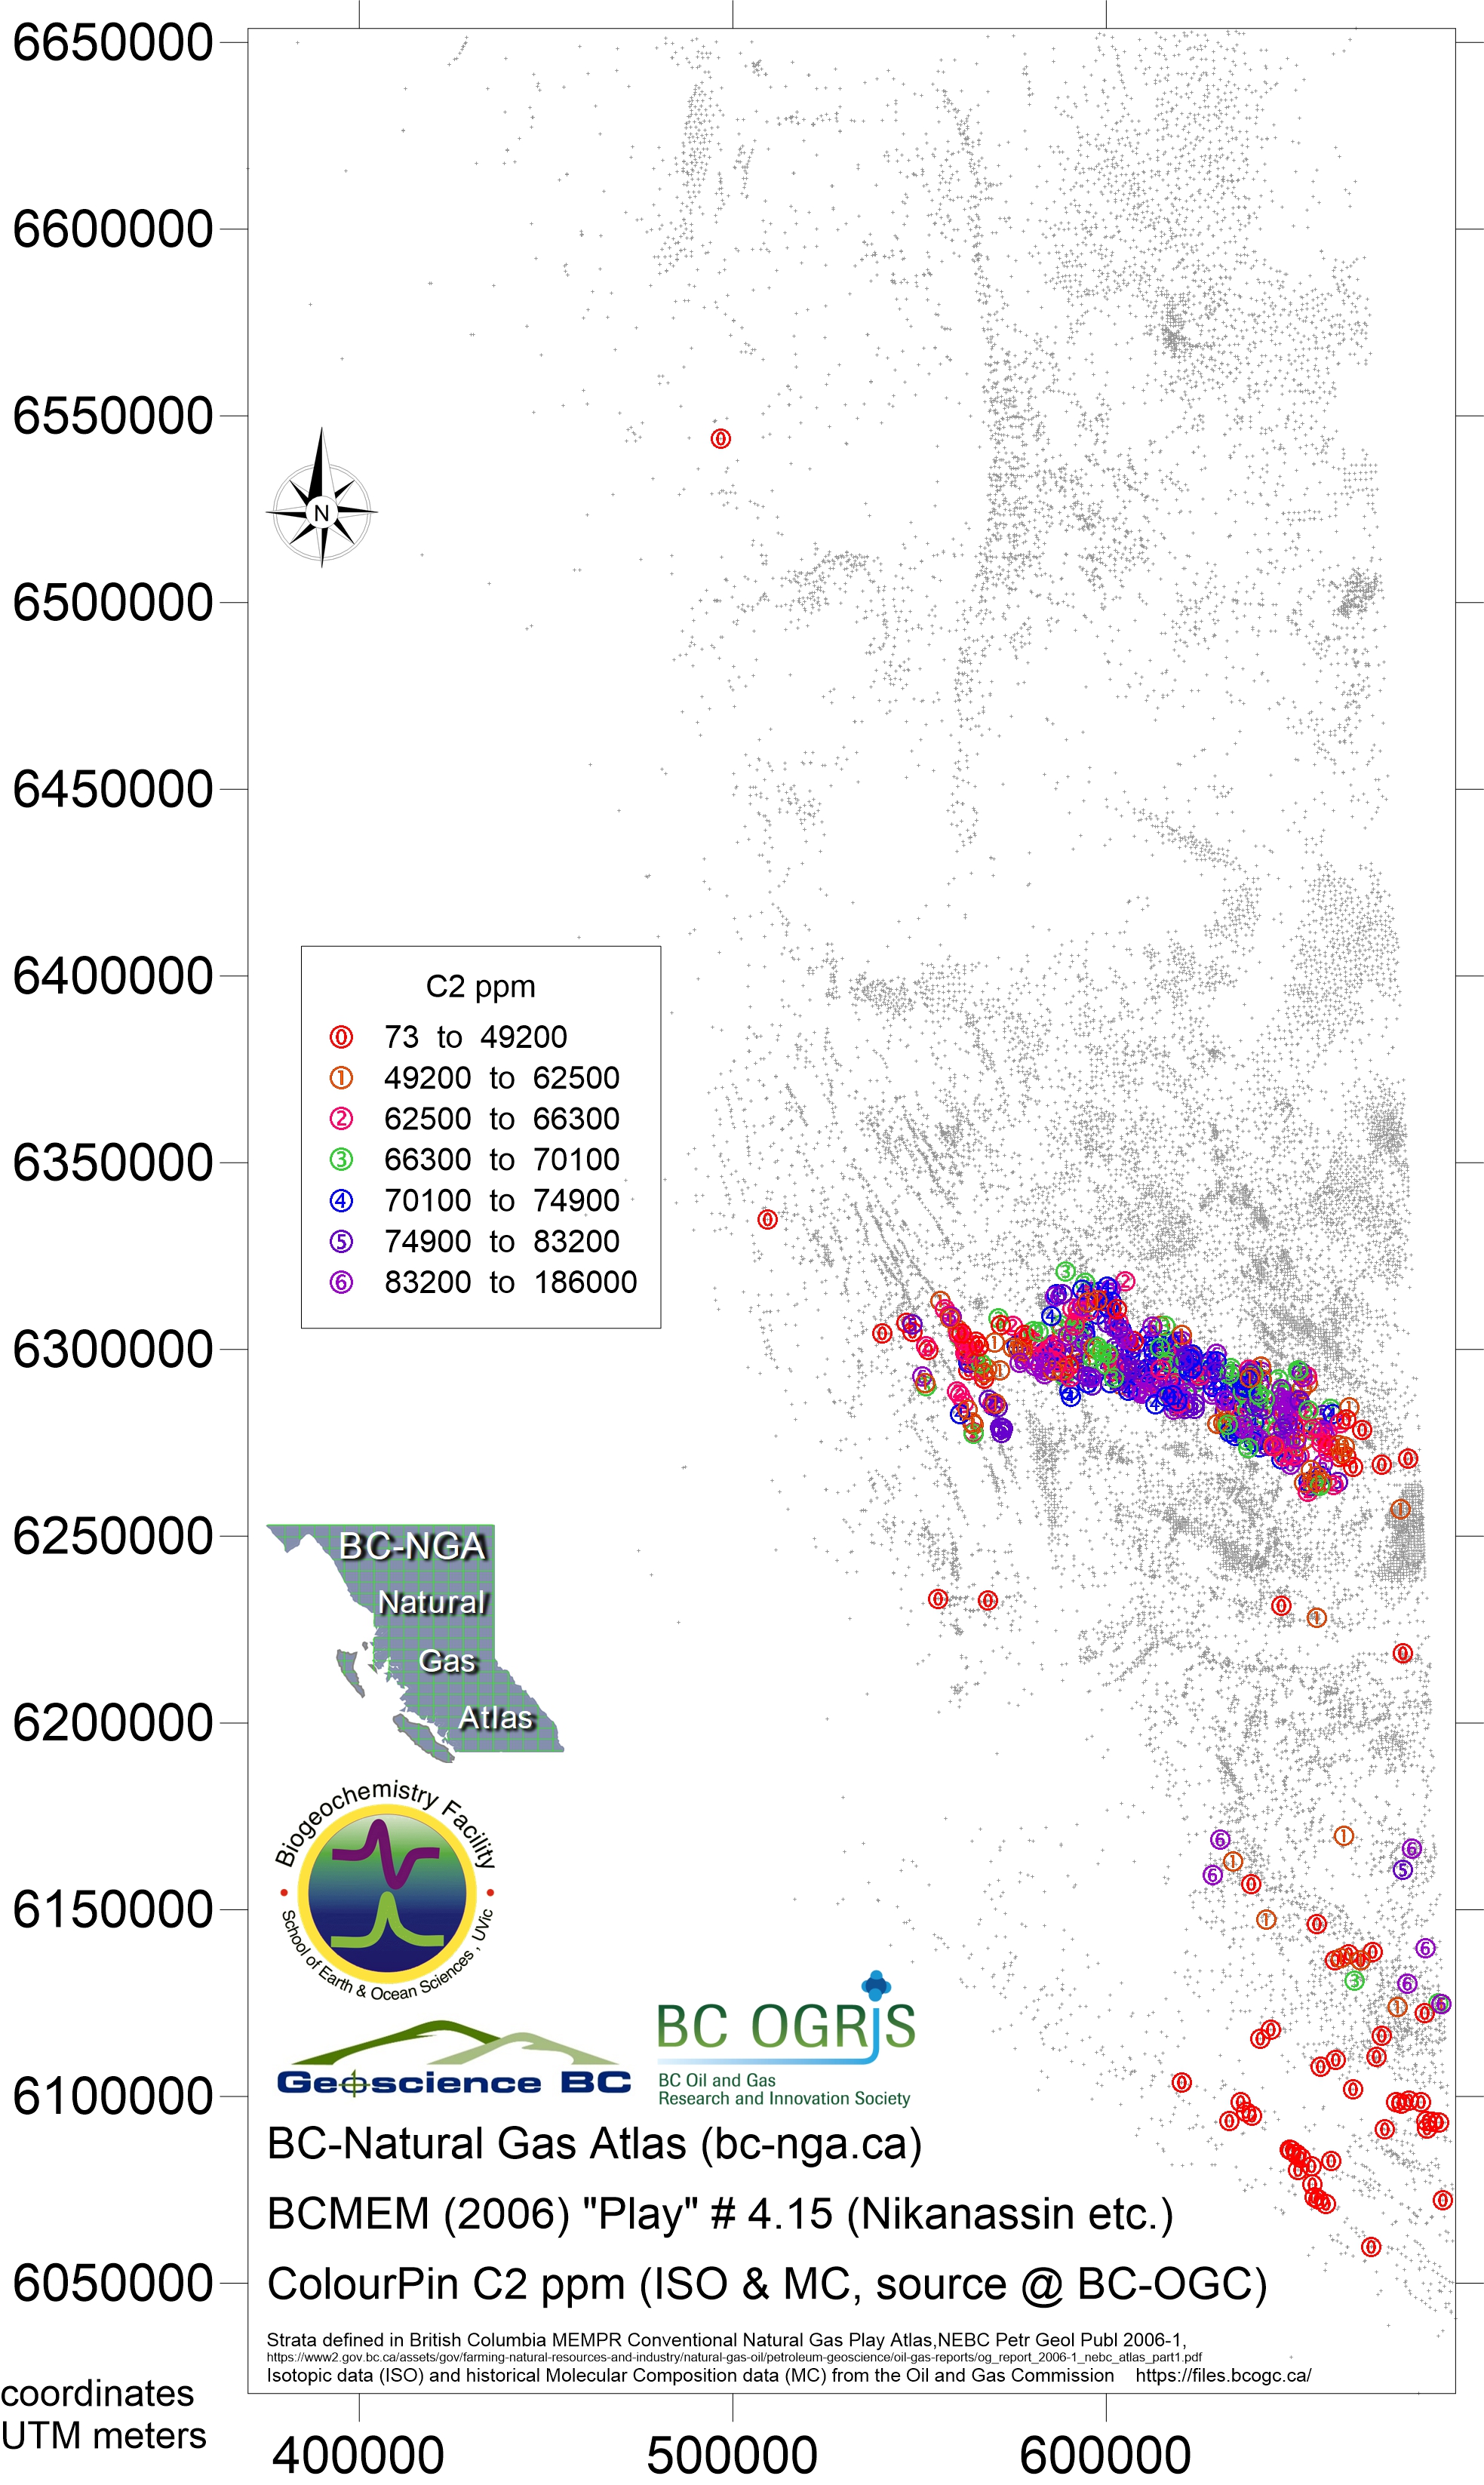
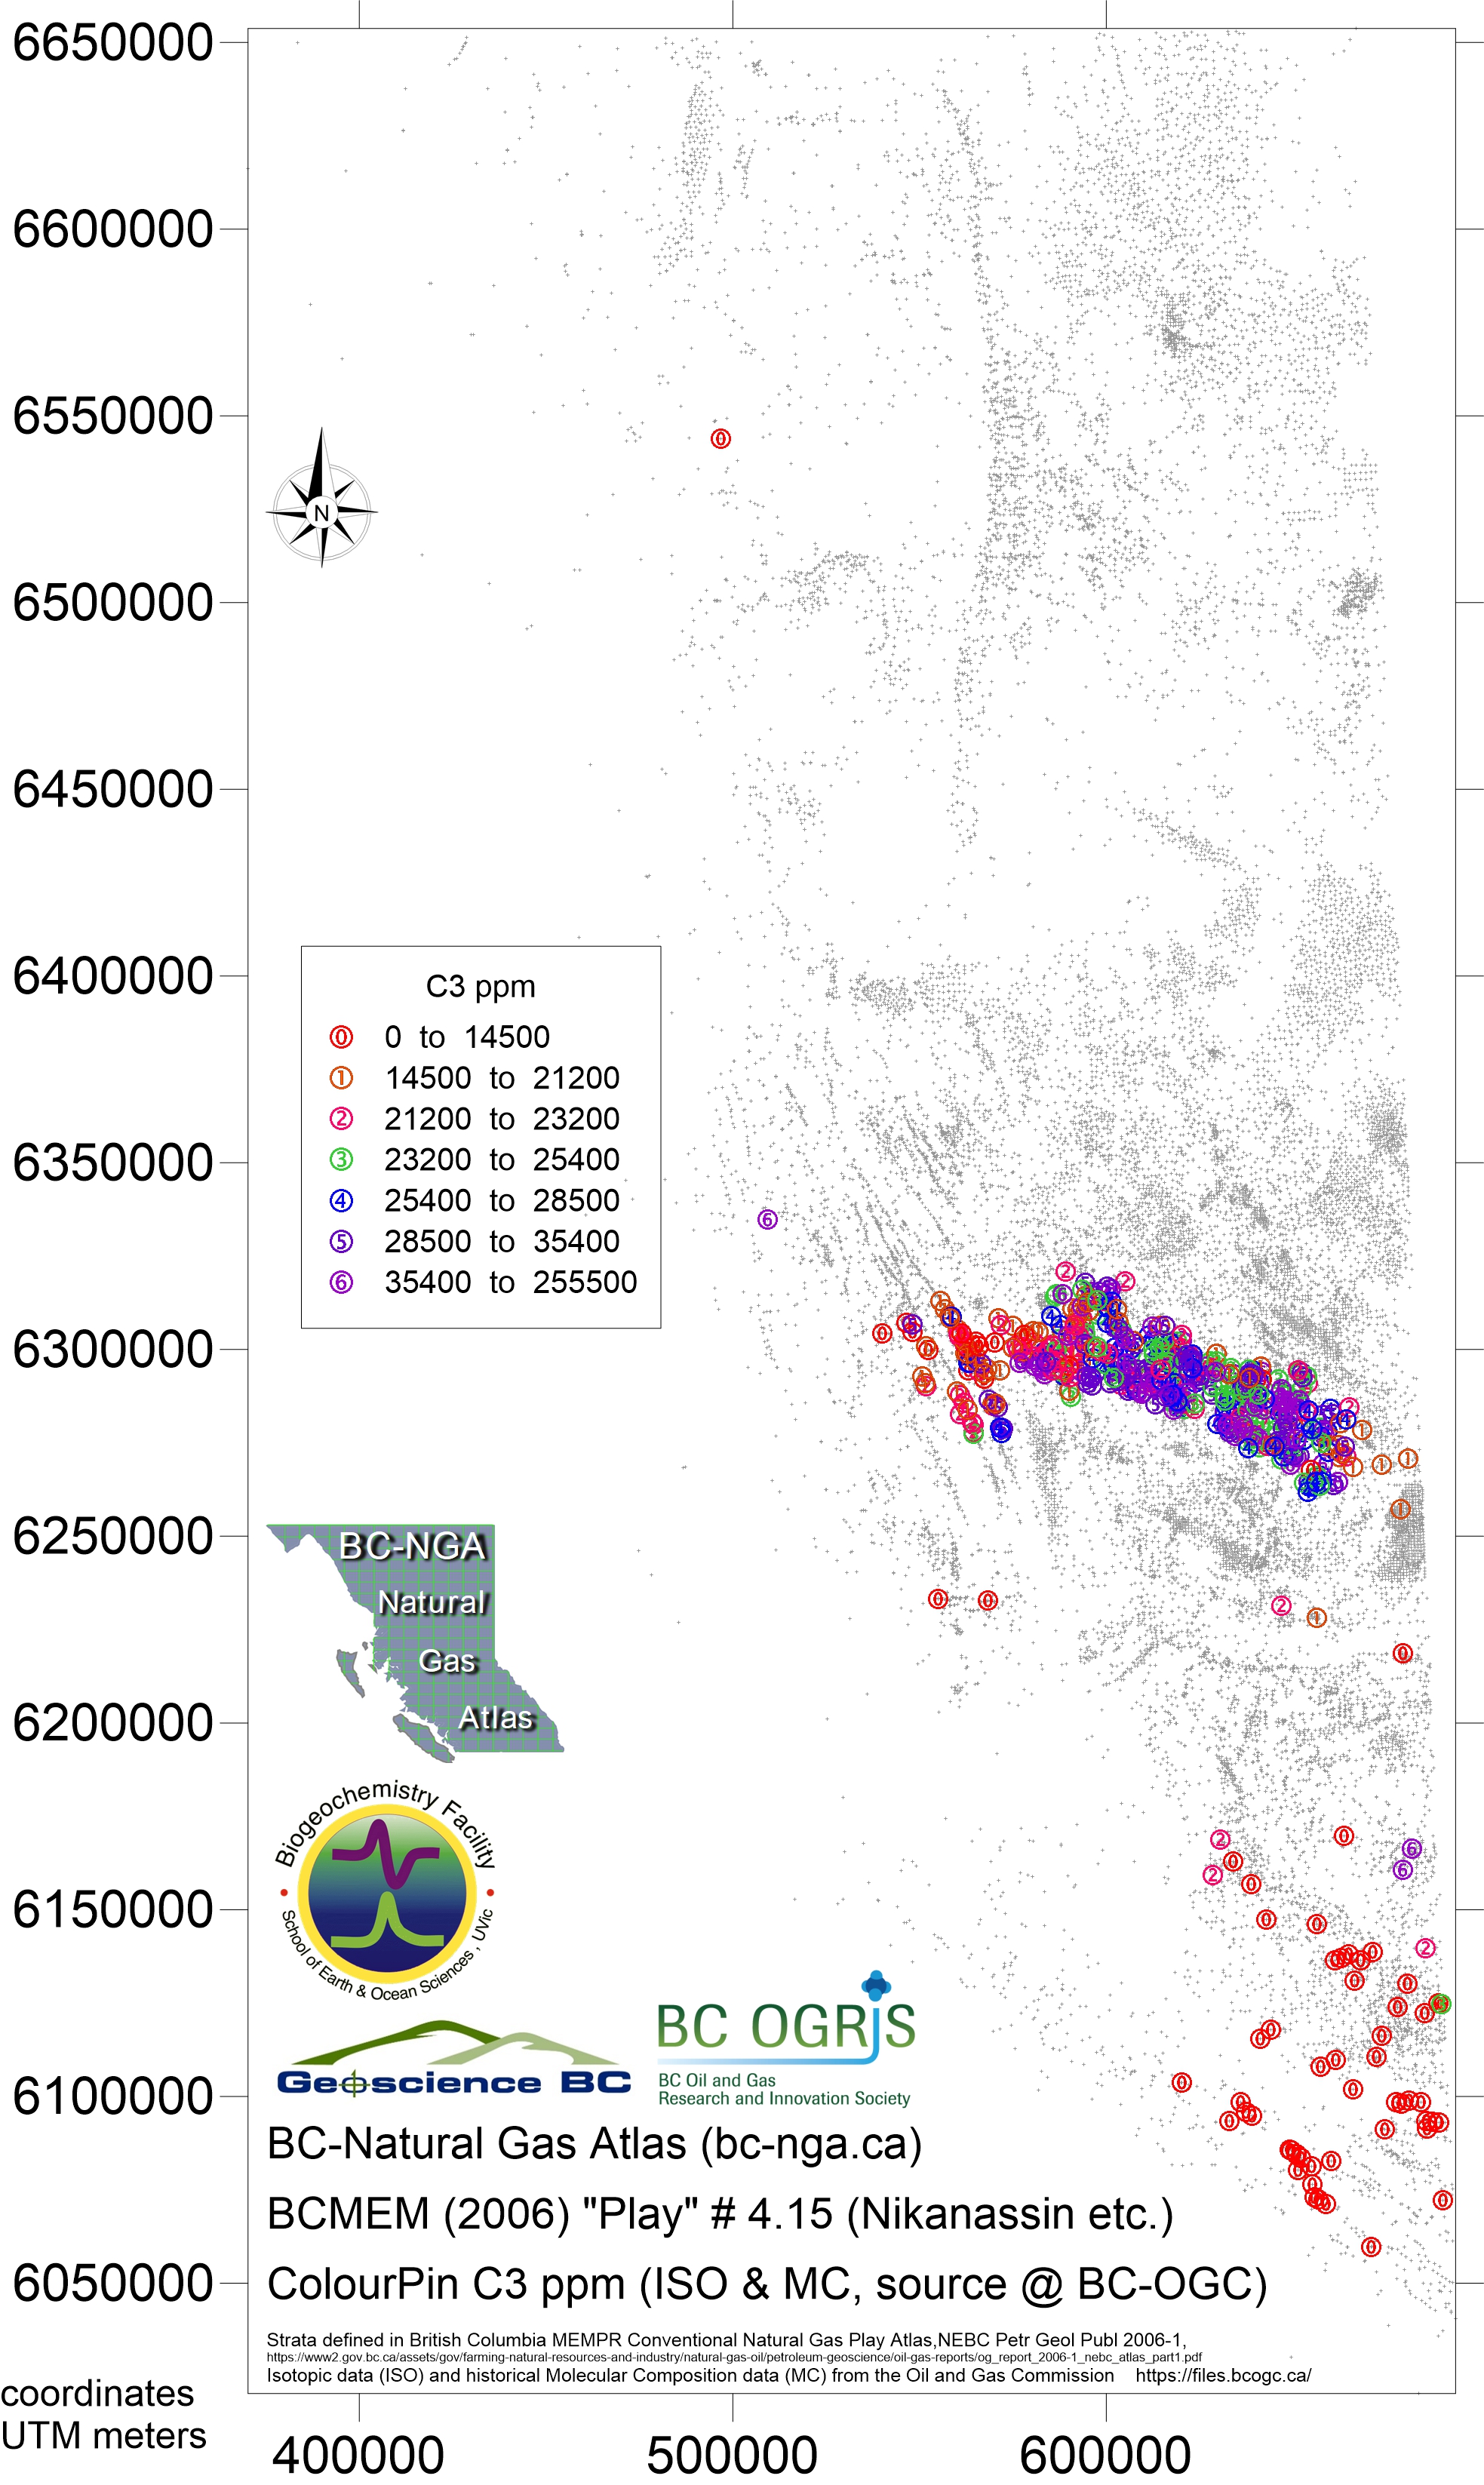
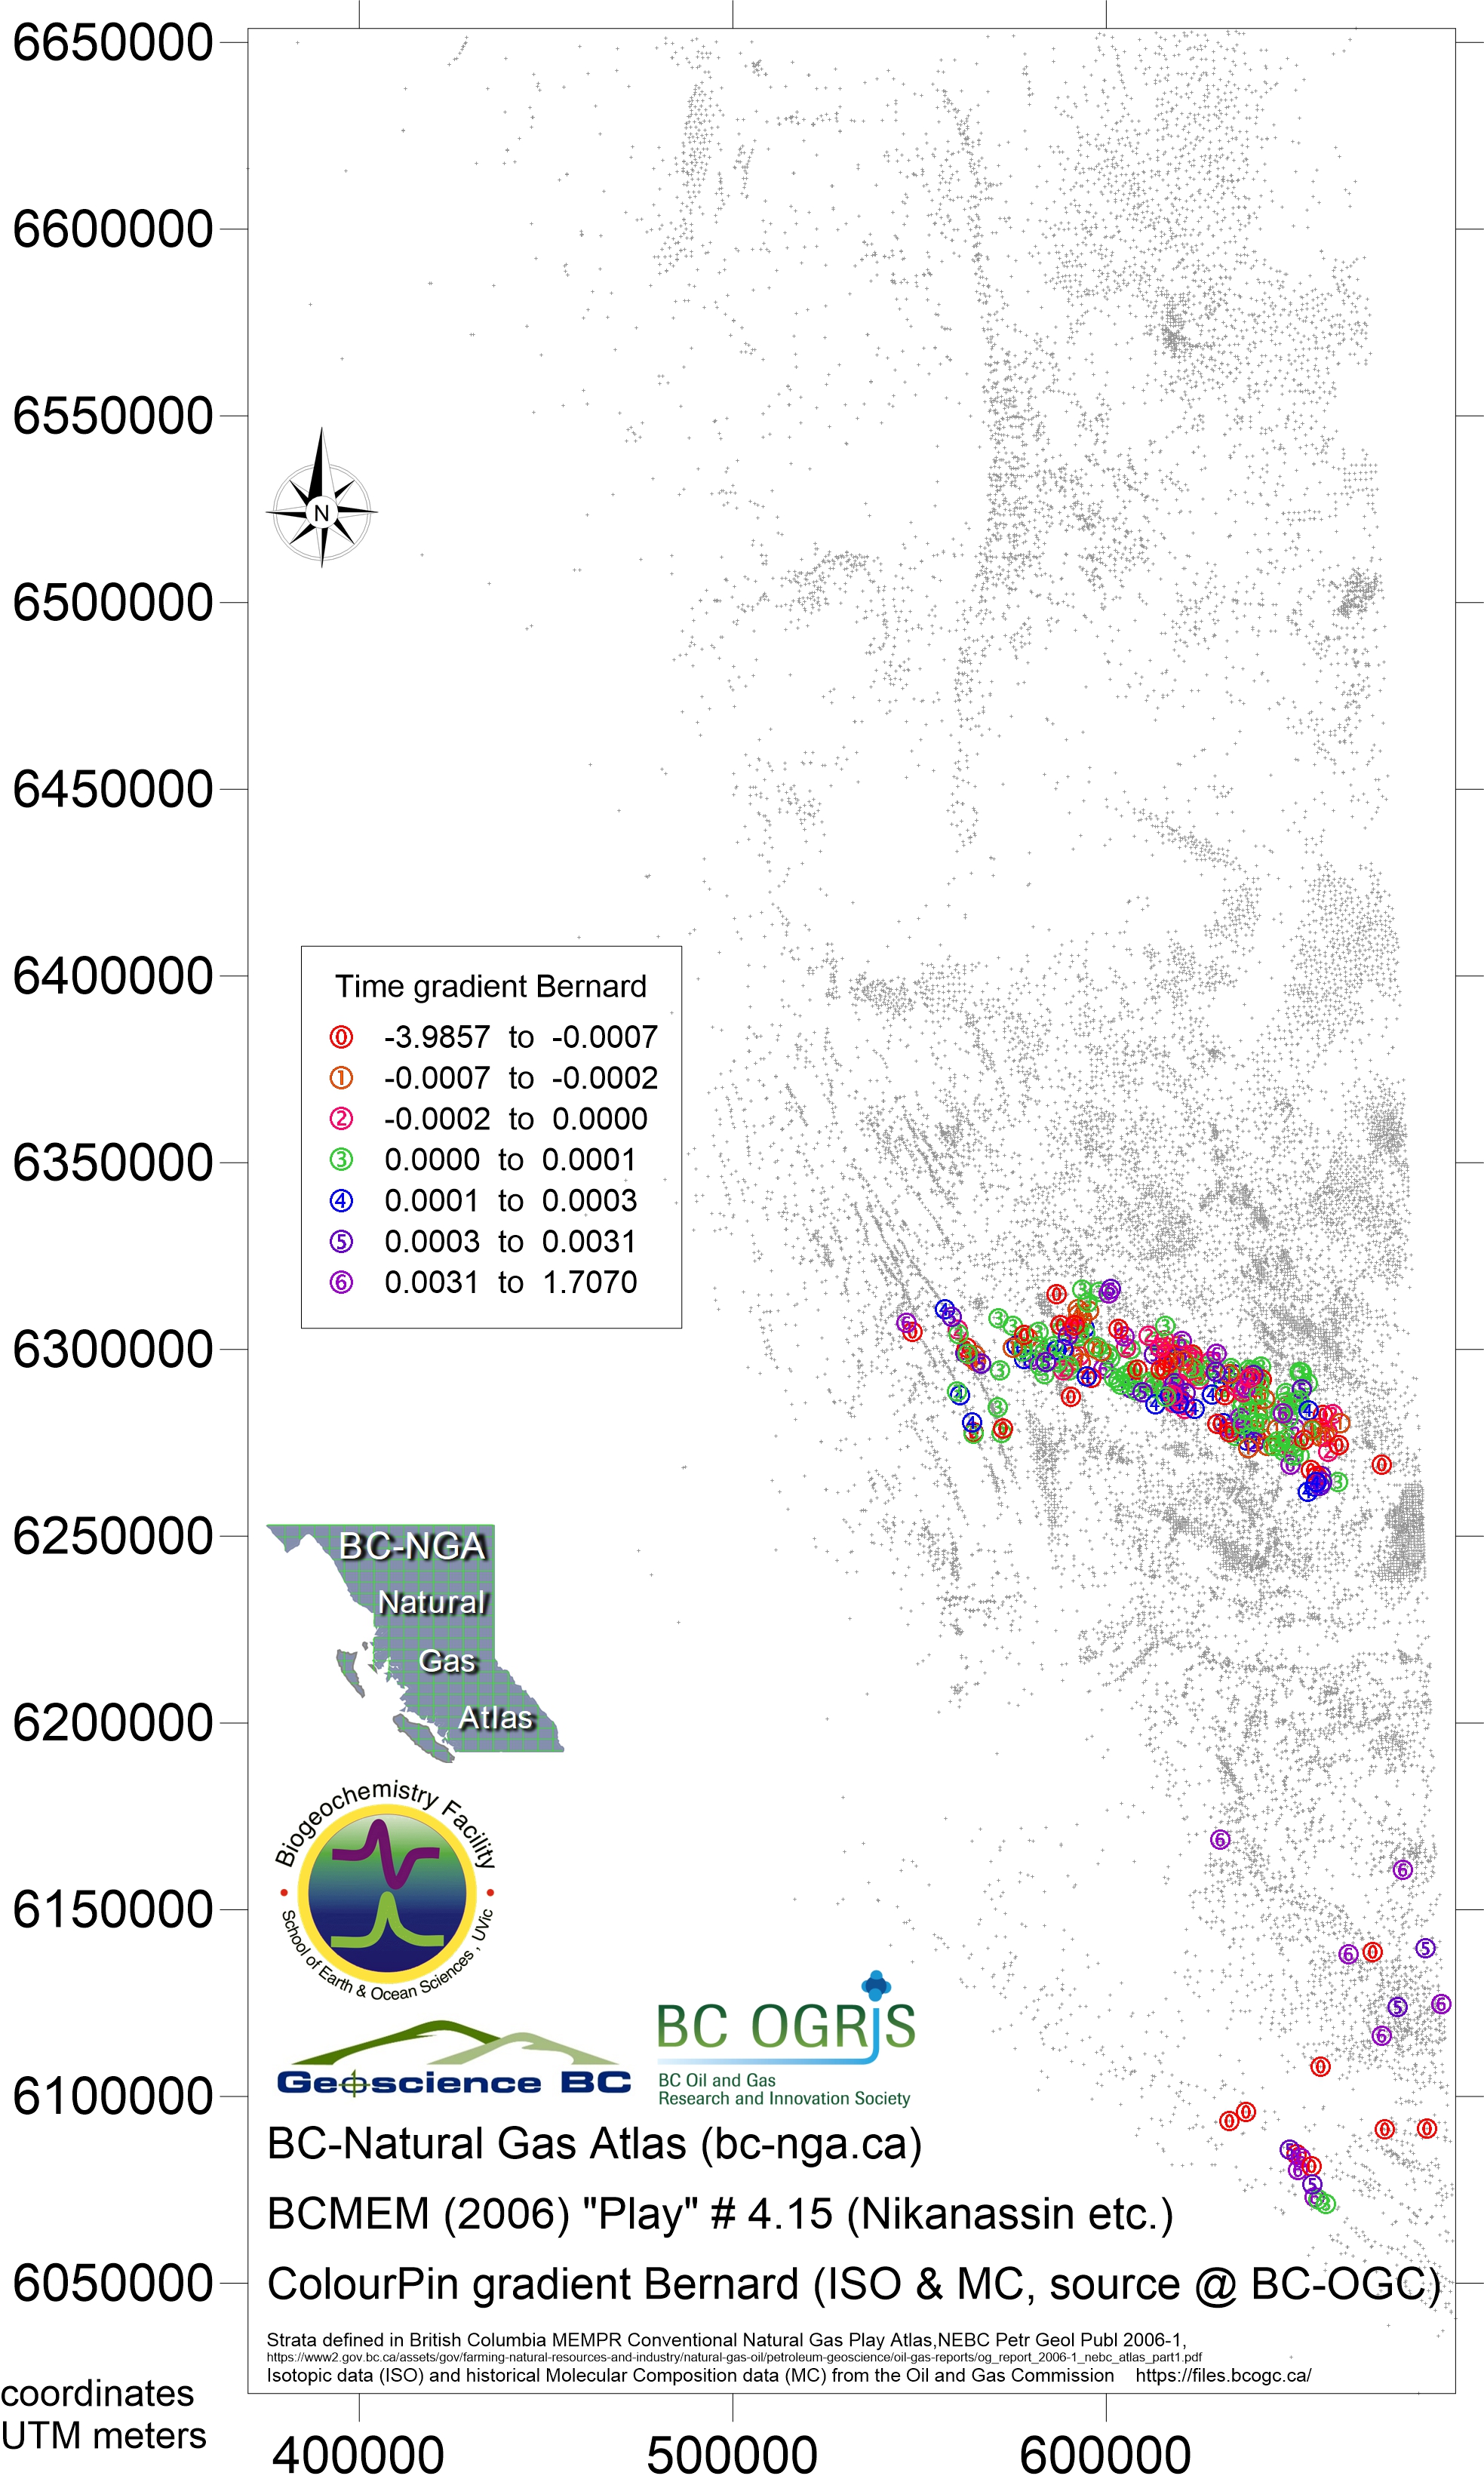
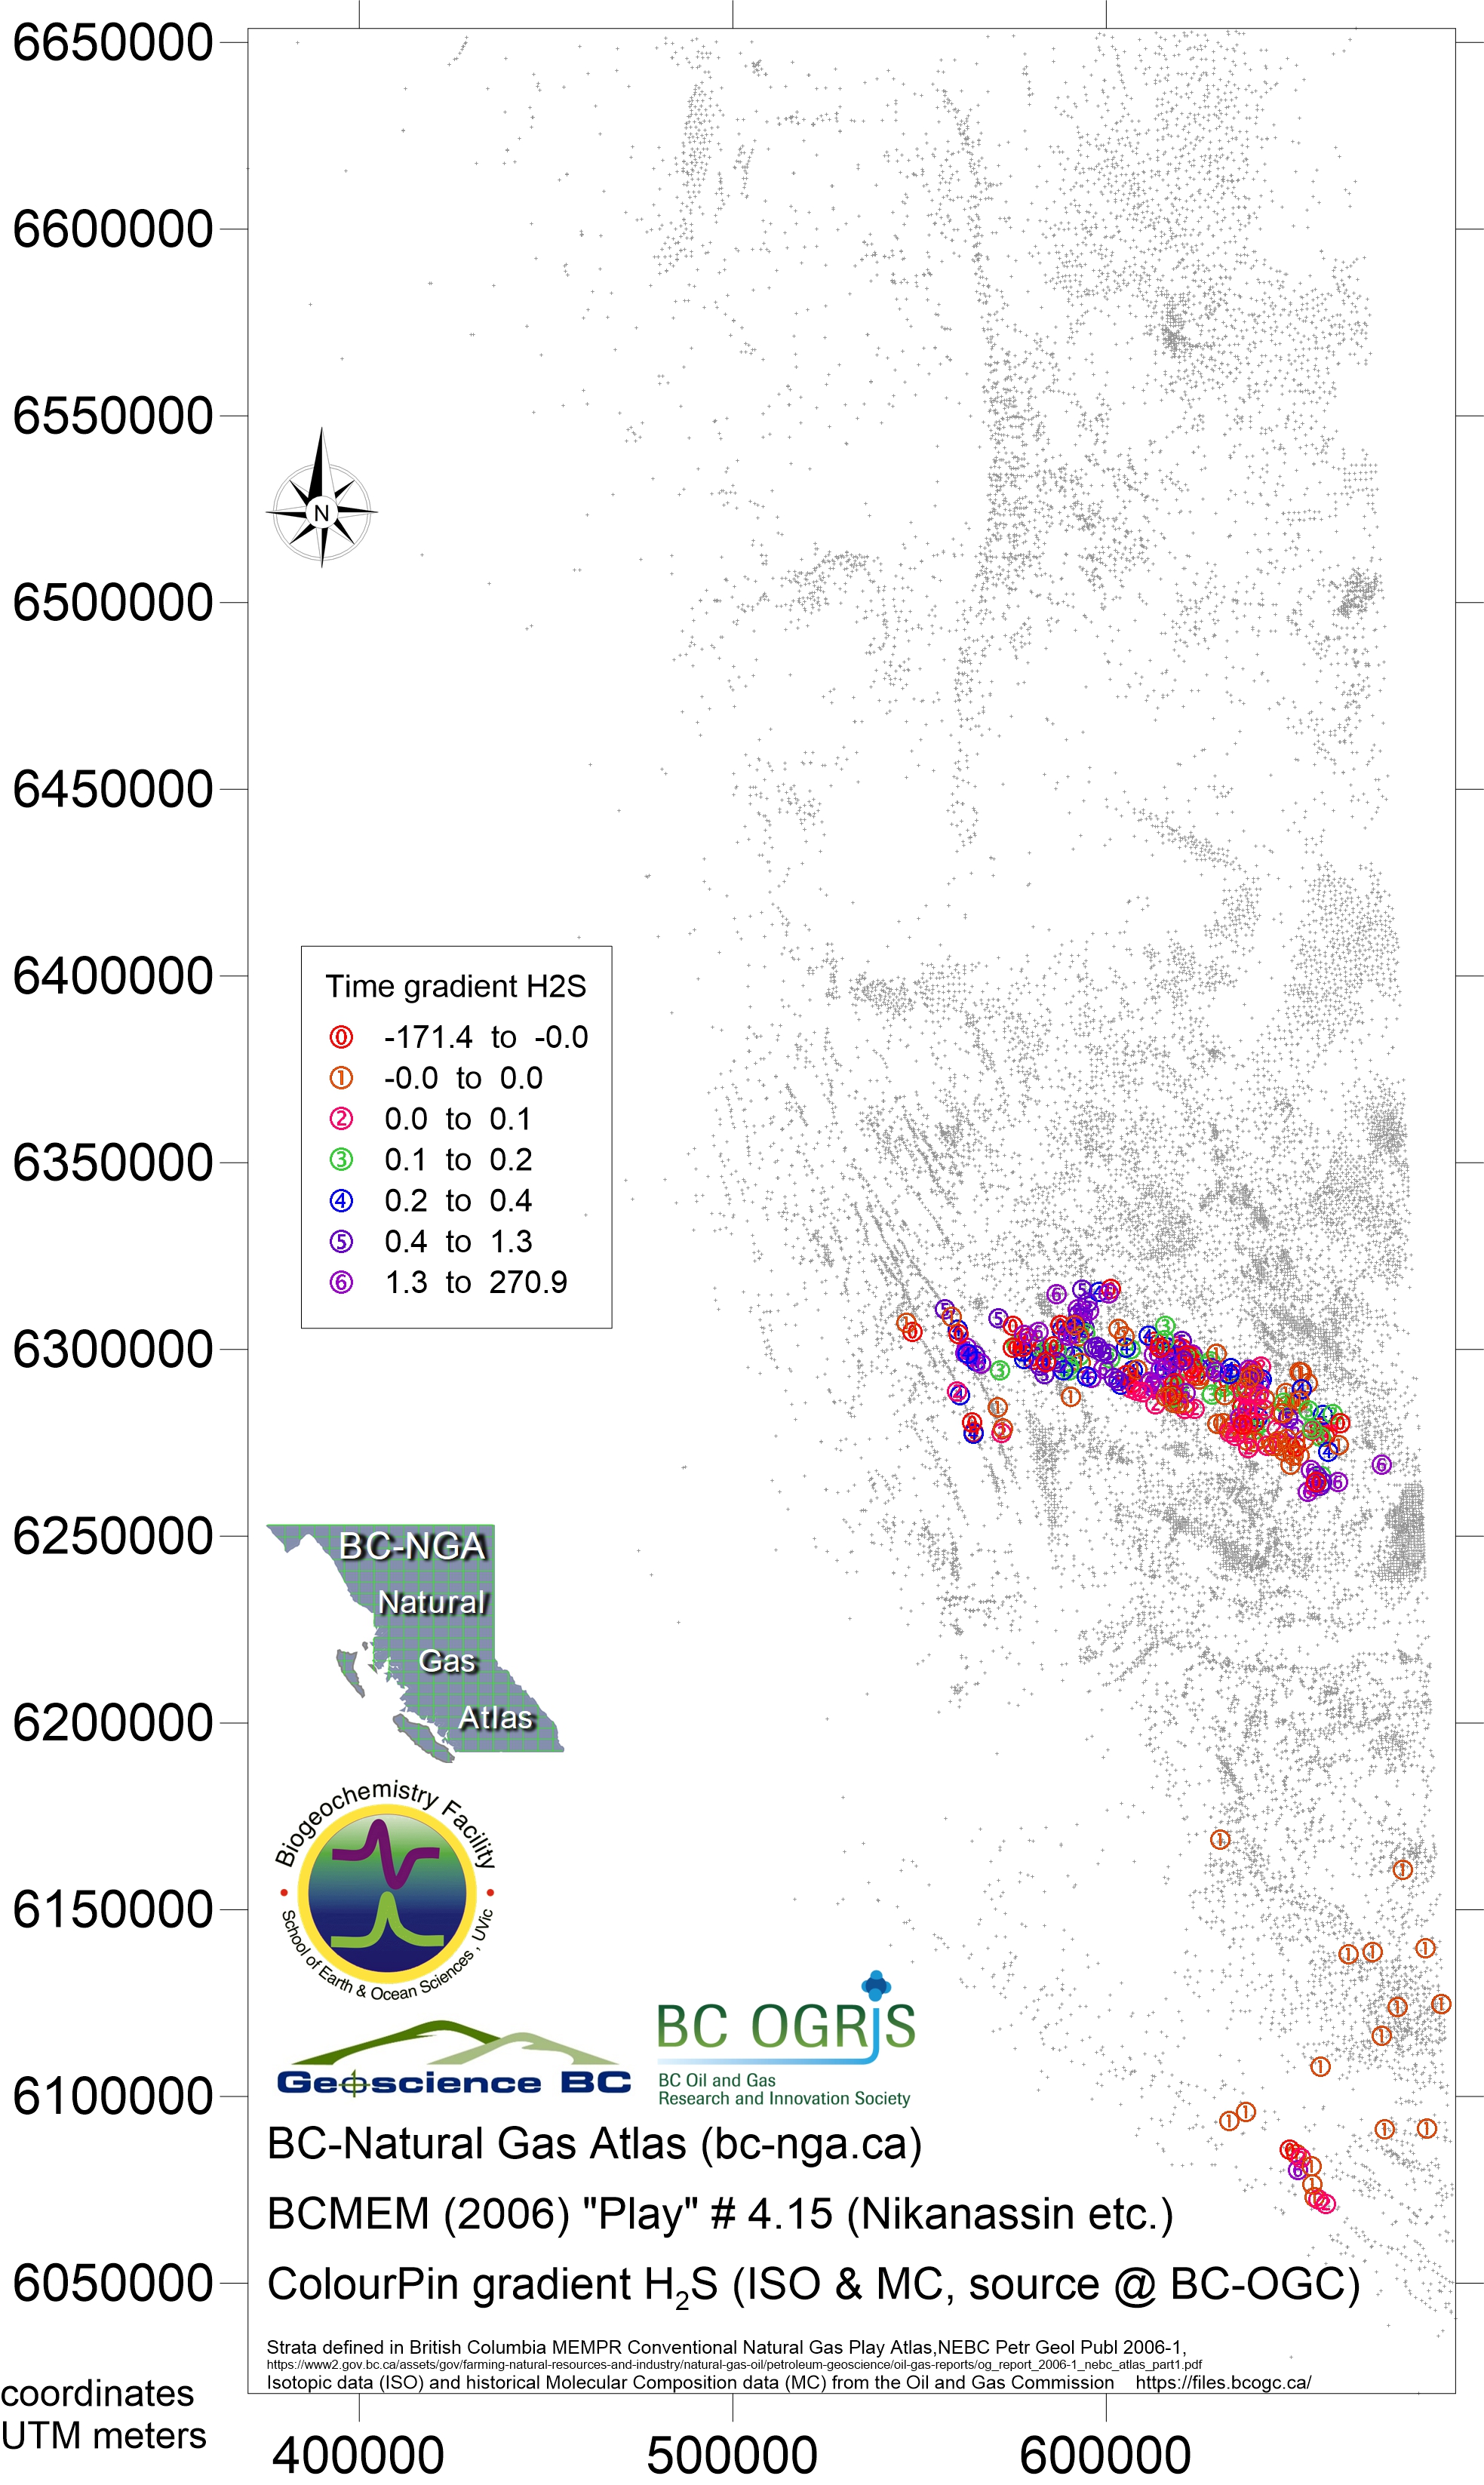
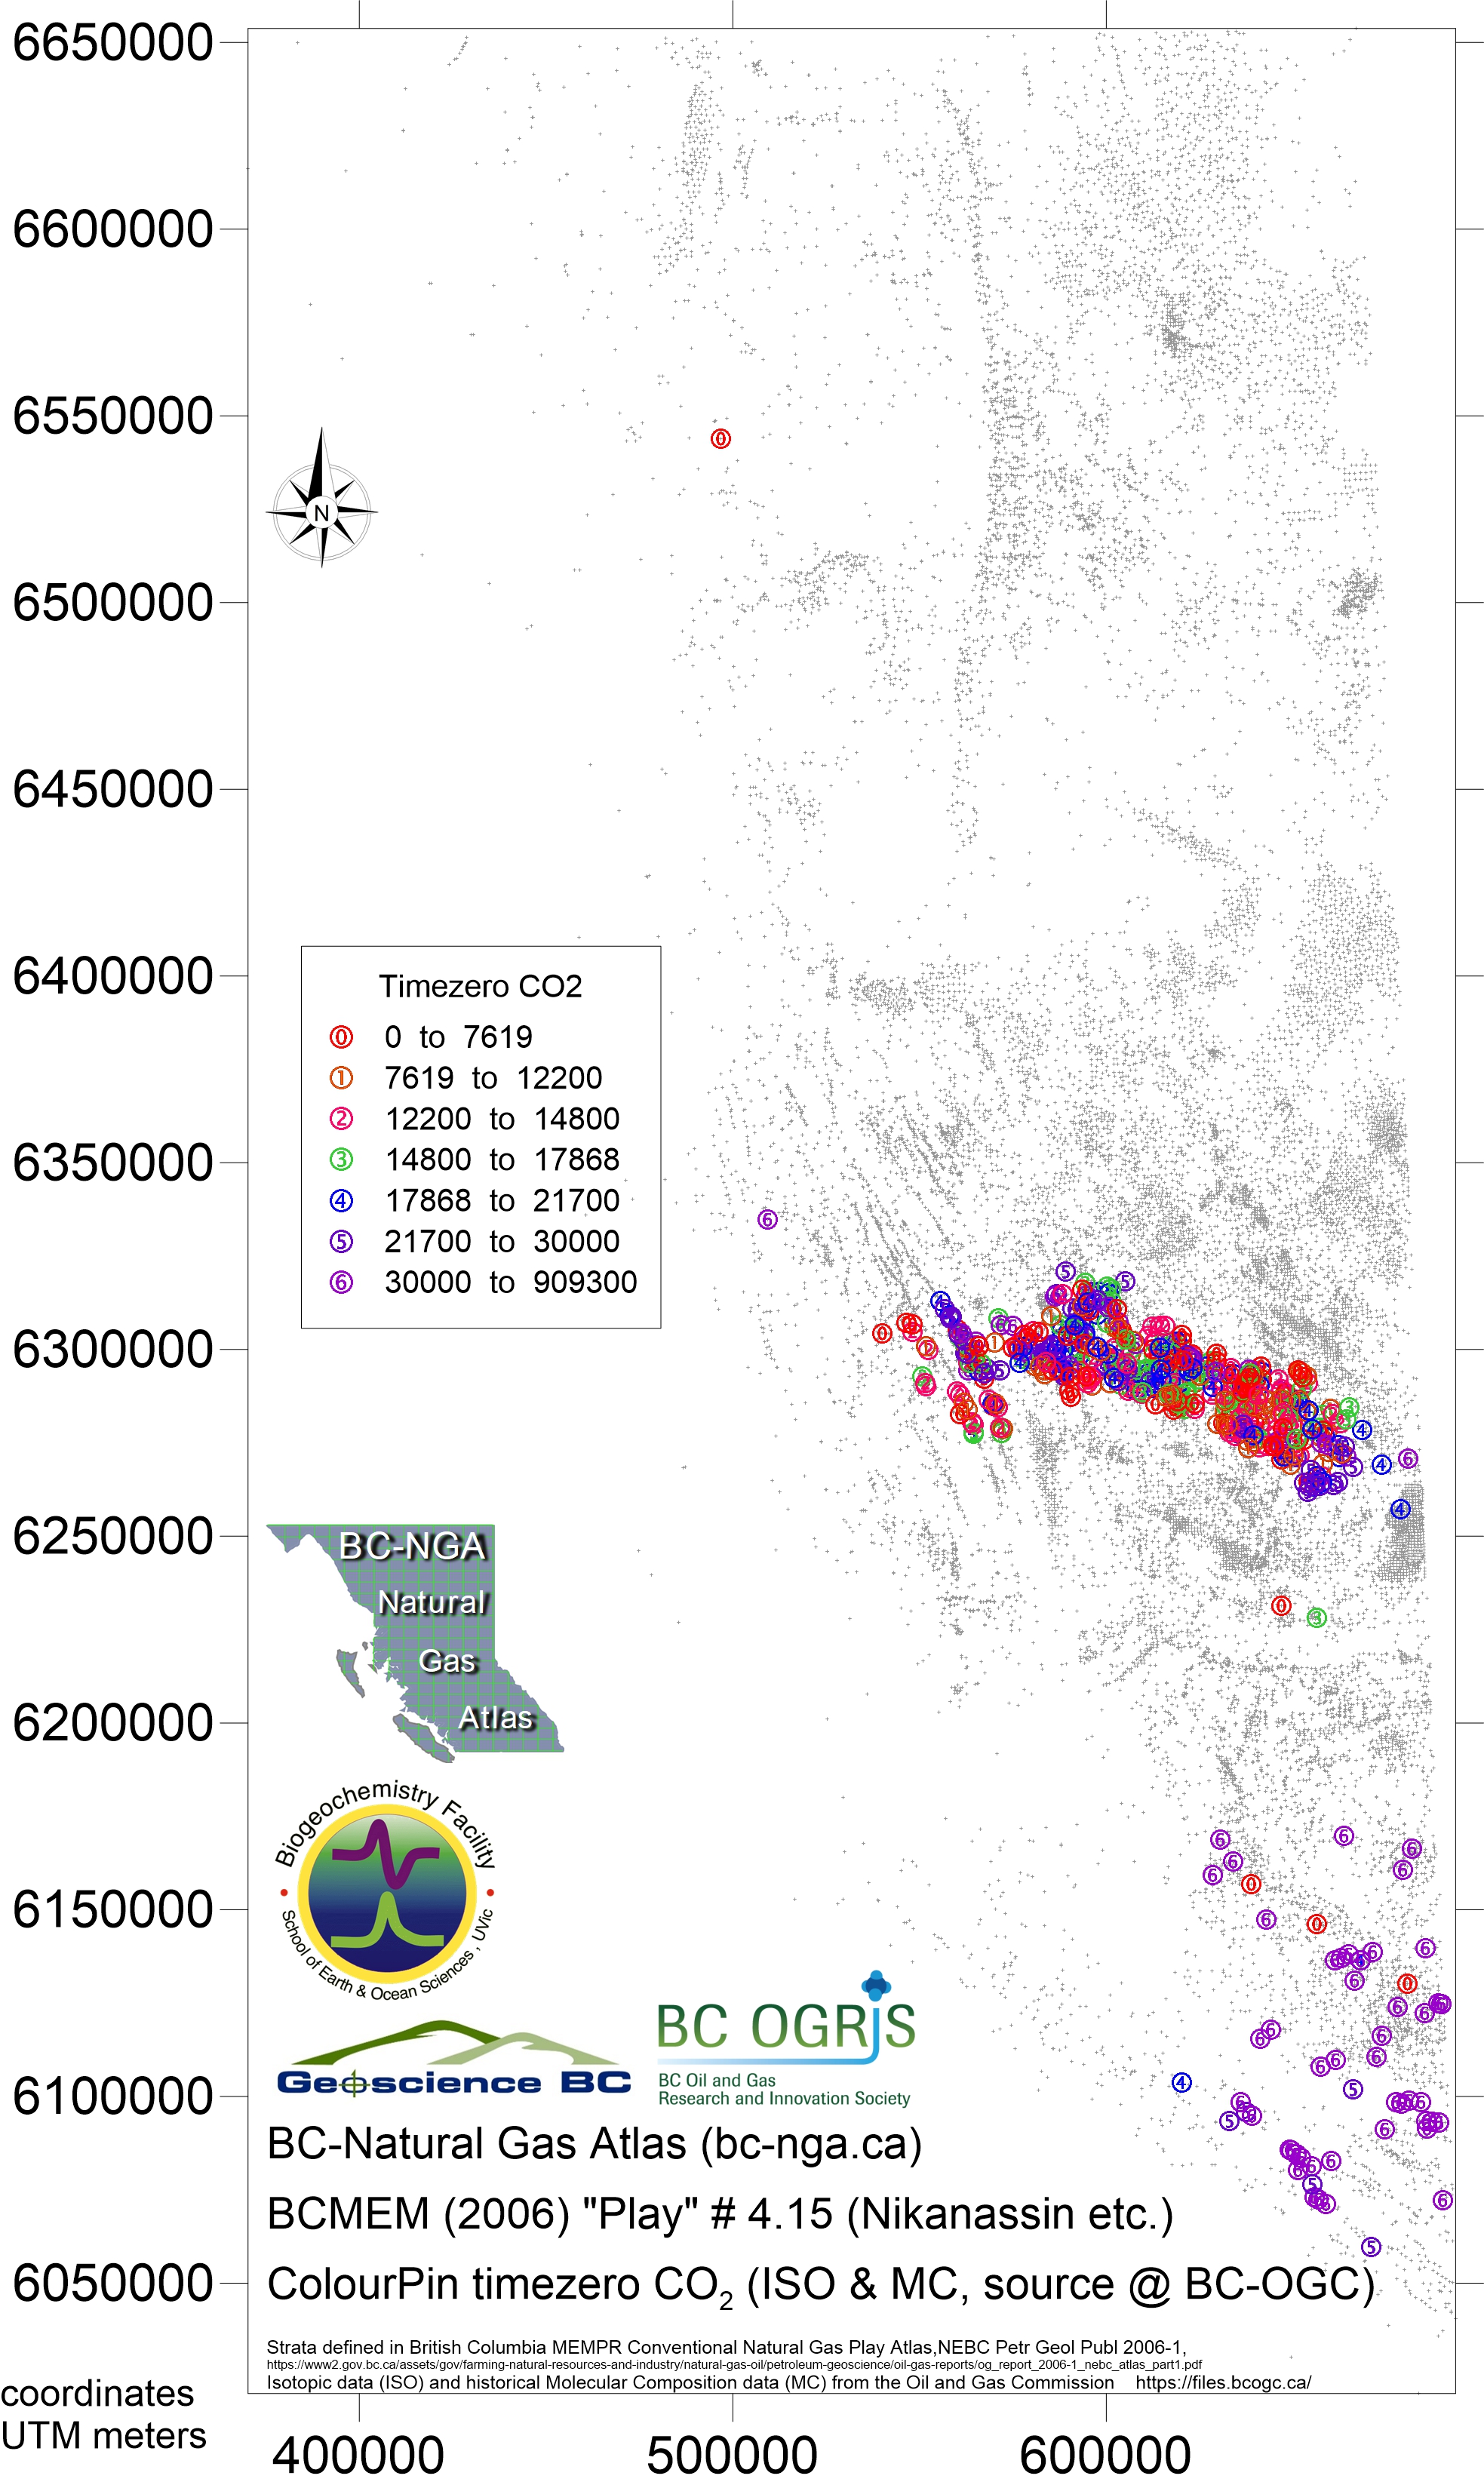
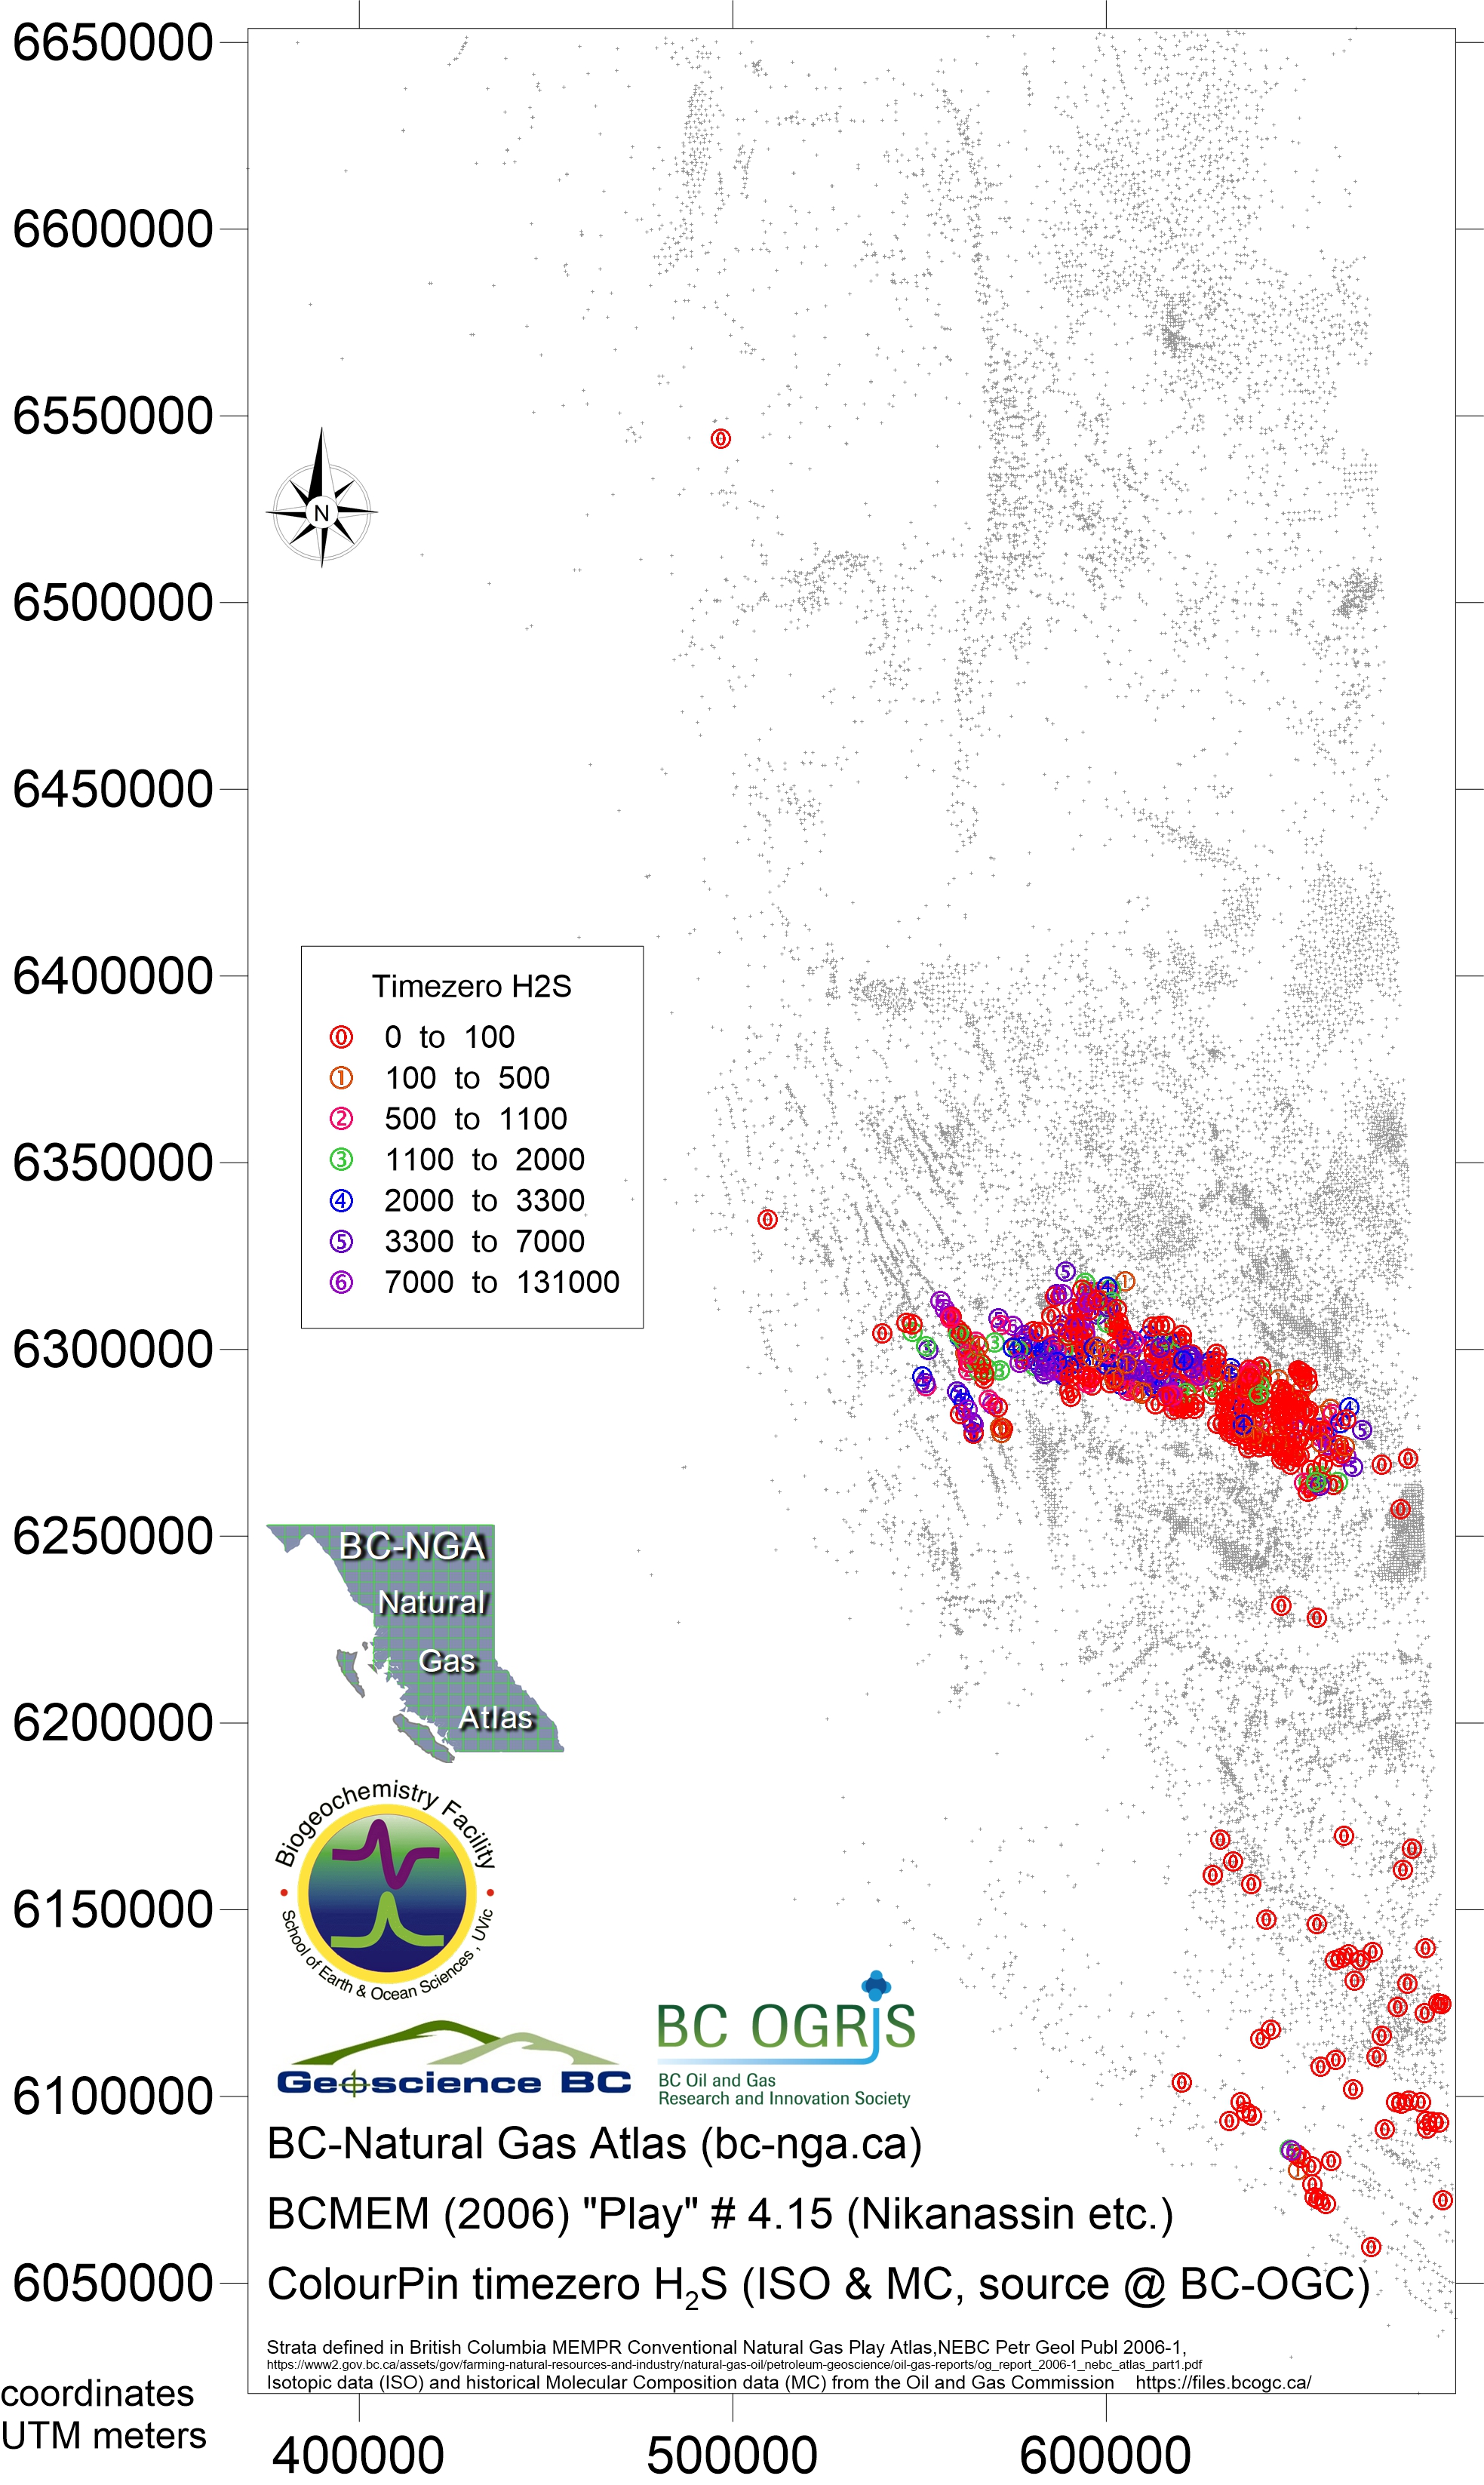
Play 4.15 Nikanassin Formation / Buick Creek Sandstone and equivalents
- Map100 Nov 2018 play 4.15 Nikanassin eqv Bernard ratio
- Map101 Nov 2018 play 4.15 Nikanassin eqv dryness ratio
- Map102 Nov 2018 play 4.15 Nikanassin eqv iC4nC4 ratio
- Map103 Nov 2018 play 4.15 Nikanassin eqv ISO ratio
- Map104 Nov 2018 play 4.15 Nikanassin eqv H2S ppm
- Map105 Nov 2018 play 4.15 Nikanassin eqv CH4 ppm
- Map106 Nov 2018 play 4.15 Nikanassin eqv C2H6 ppm
- Map107 Nov 2018 play 4.15 Nikanassin eqv C3H8 ppm
- Map108 Nov 2018 play 4.15 Nikanassin eqv iC4H10 ppm
- Map109 Nov 2018 play 4.15 Nikanassin eqv nC4H10 ppm
- Map110 Nov 2018 play 4.15 Nikanassin eqv iC5H12 ppm
- Map111 Nov 2018 play 4.15 Nikanassin eqv nC5H12 ppm
- Map112 Nov 2018 play 4.15 Nikanassin eqv C6H14 plus ppm
- Map113 Nov 2018 play 4.15 Nikanassin eqv CO2 ppm
- Map114 Nov 2018 play 4.15 Nikanassin eqv δ13CH4
- Map115 Nov 2018 play 4.15 Nikanassin eqv δ13C2H6
- Map116 Nov 2018 play 4.15 Nikanassin eqv δ13C3H8
- Map118 Nov 2018 play 4.15 Nikanassin eqv time series gradient CO2
- Map117 Nov 2018 play 4.15 Nikanassin eqv time series gradient Bernard ratio
- Map119 Nov 2018 play 4.15 Nikanassin eqv time series gradient H2S
- Map120 Nov 2018 play 4.15 Nikanassin eqv time series start point Bernard ratio
- Map121 Nov 2018 play 4.15 Nikanassin eqva time series start point CO2
- Map122 Nov 2018 play 4.15 Nikanassin eqv time series start point H2S
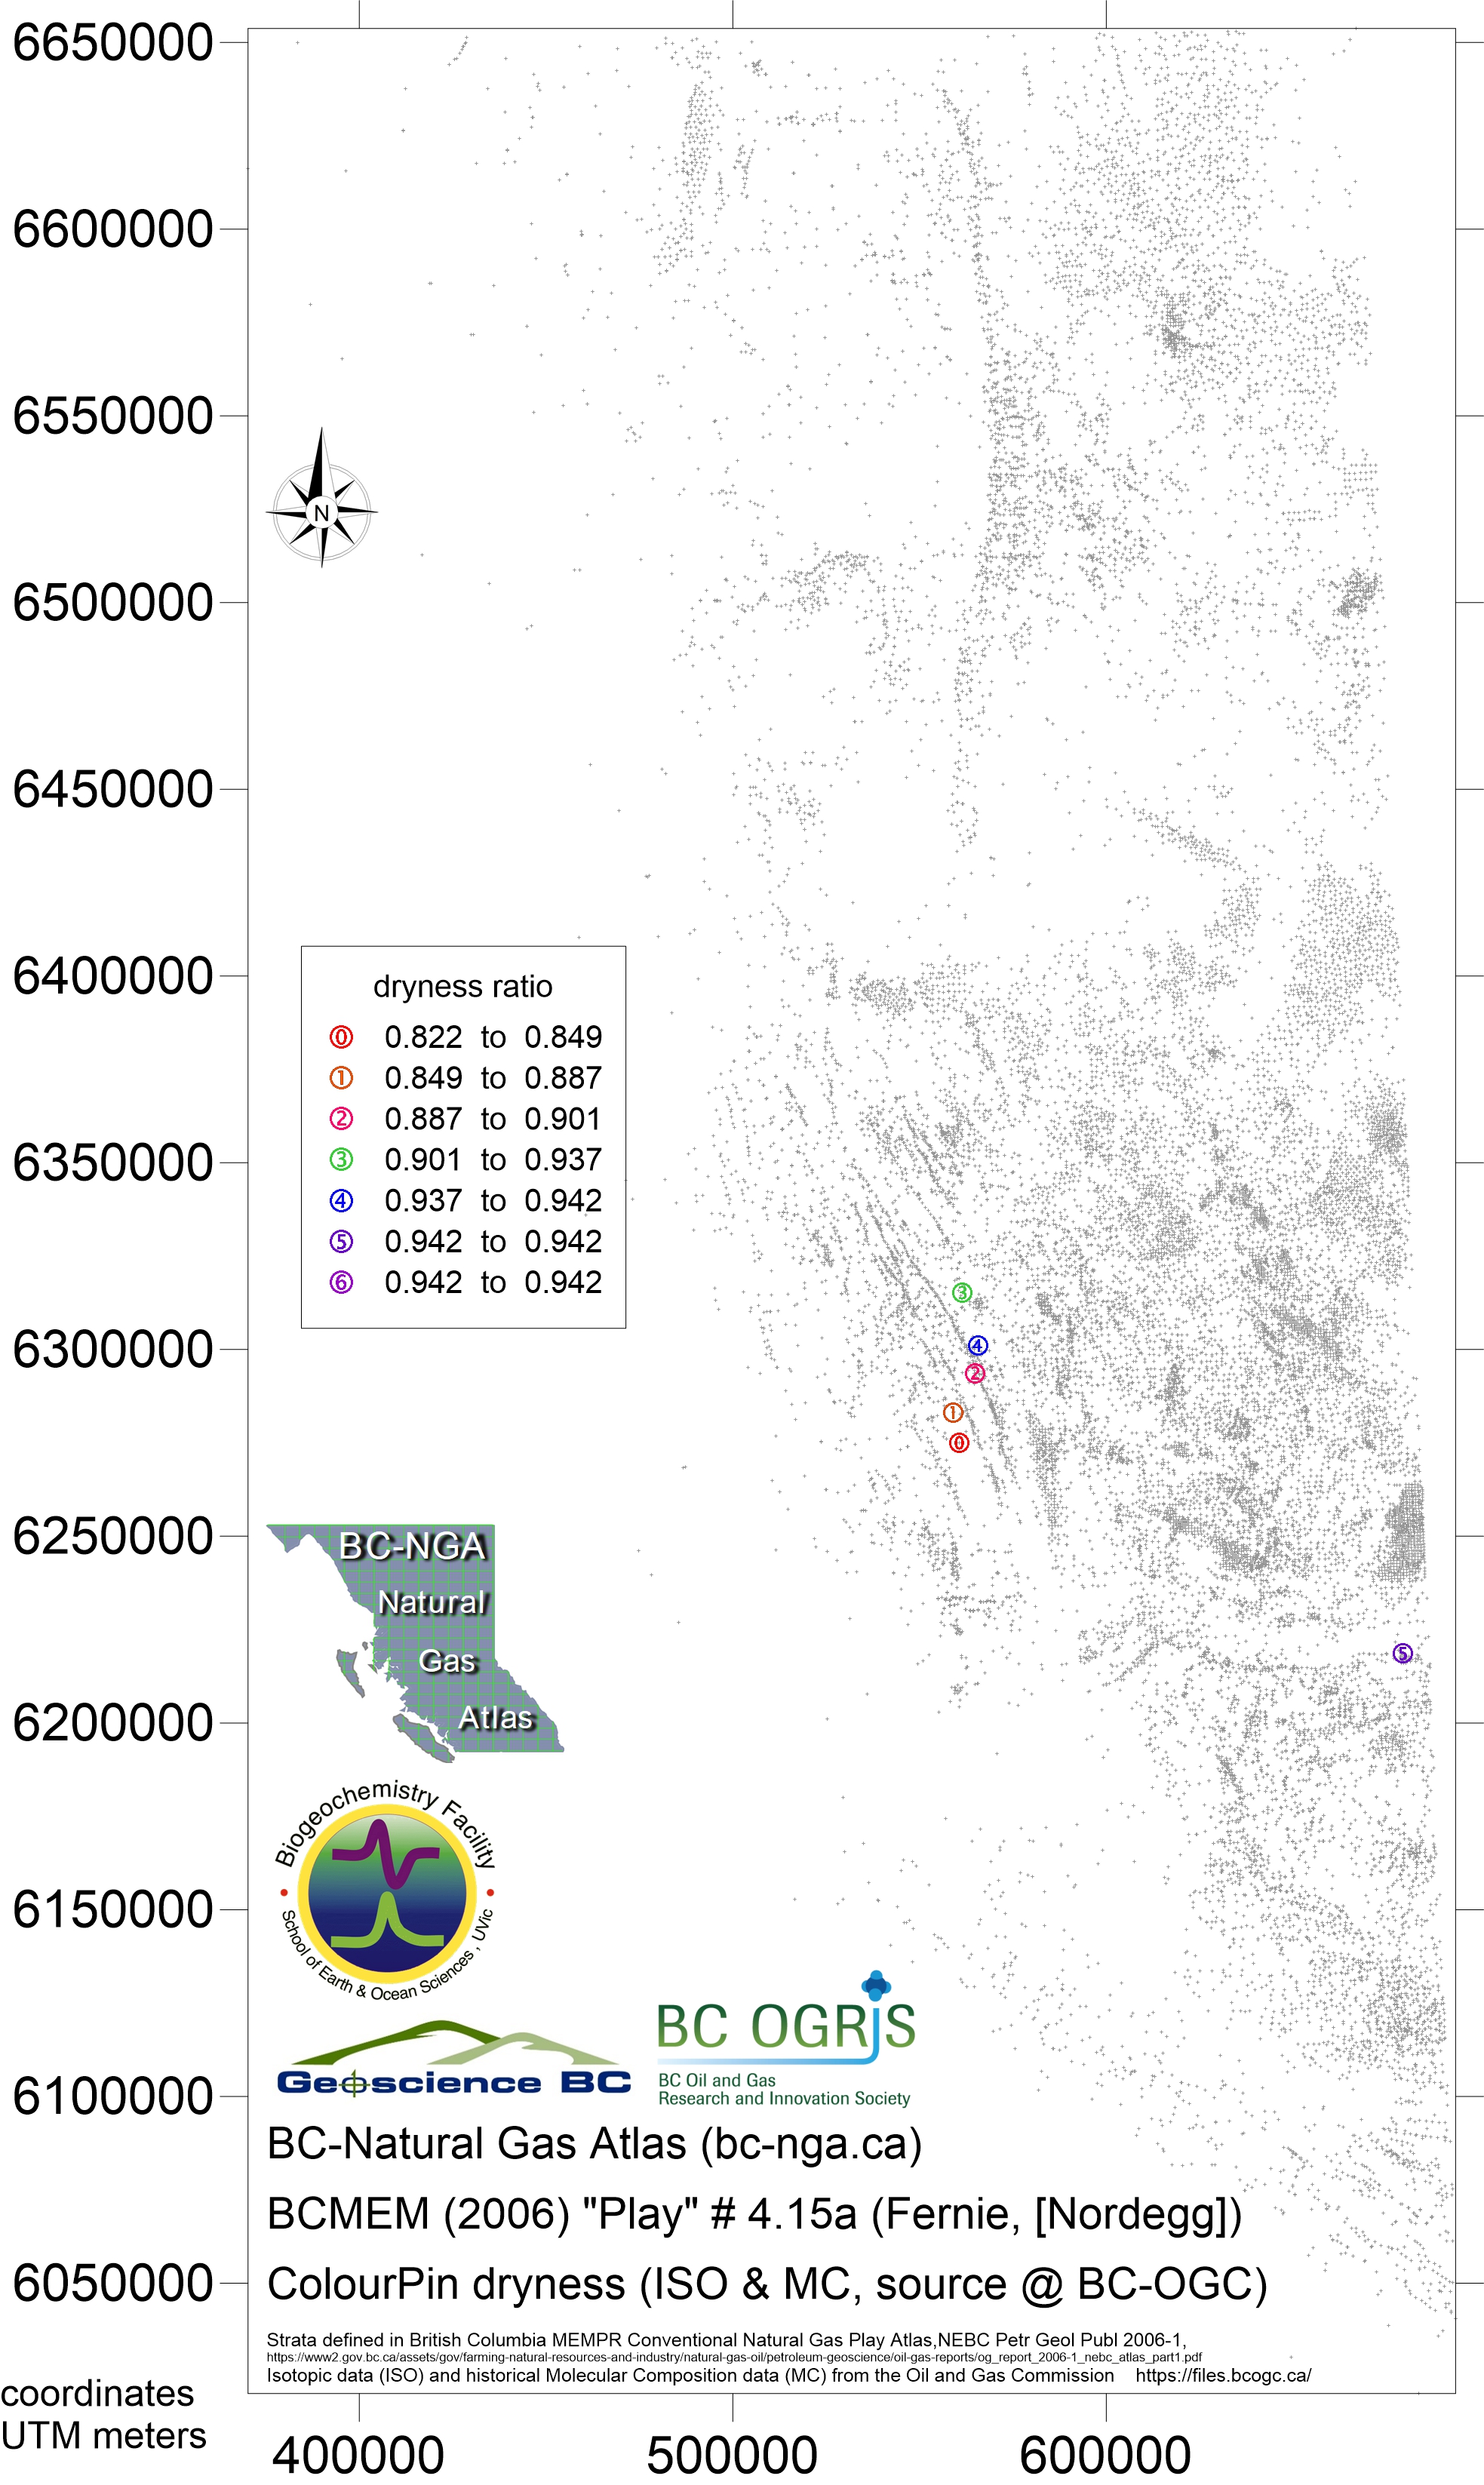
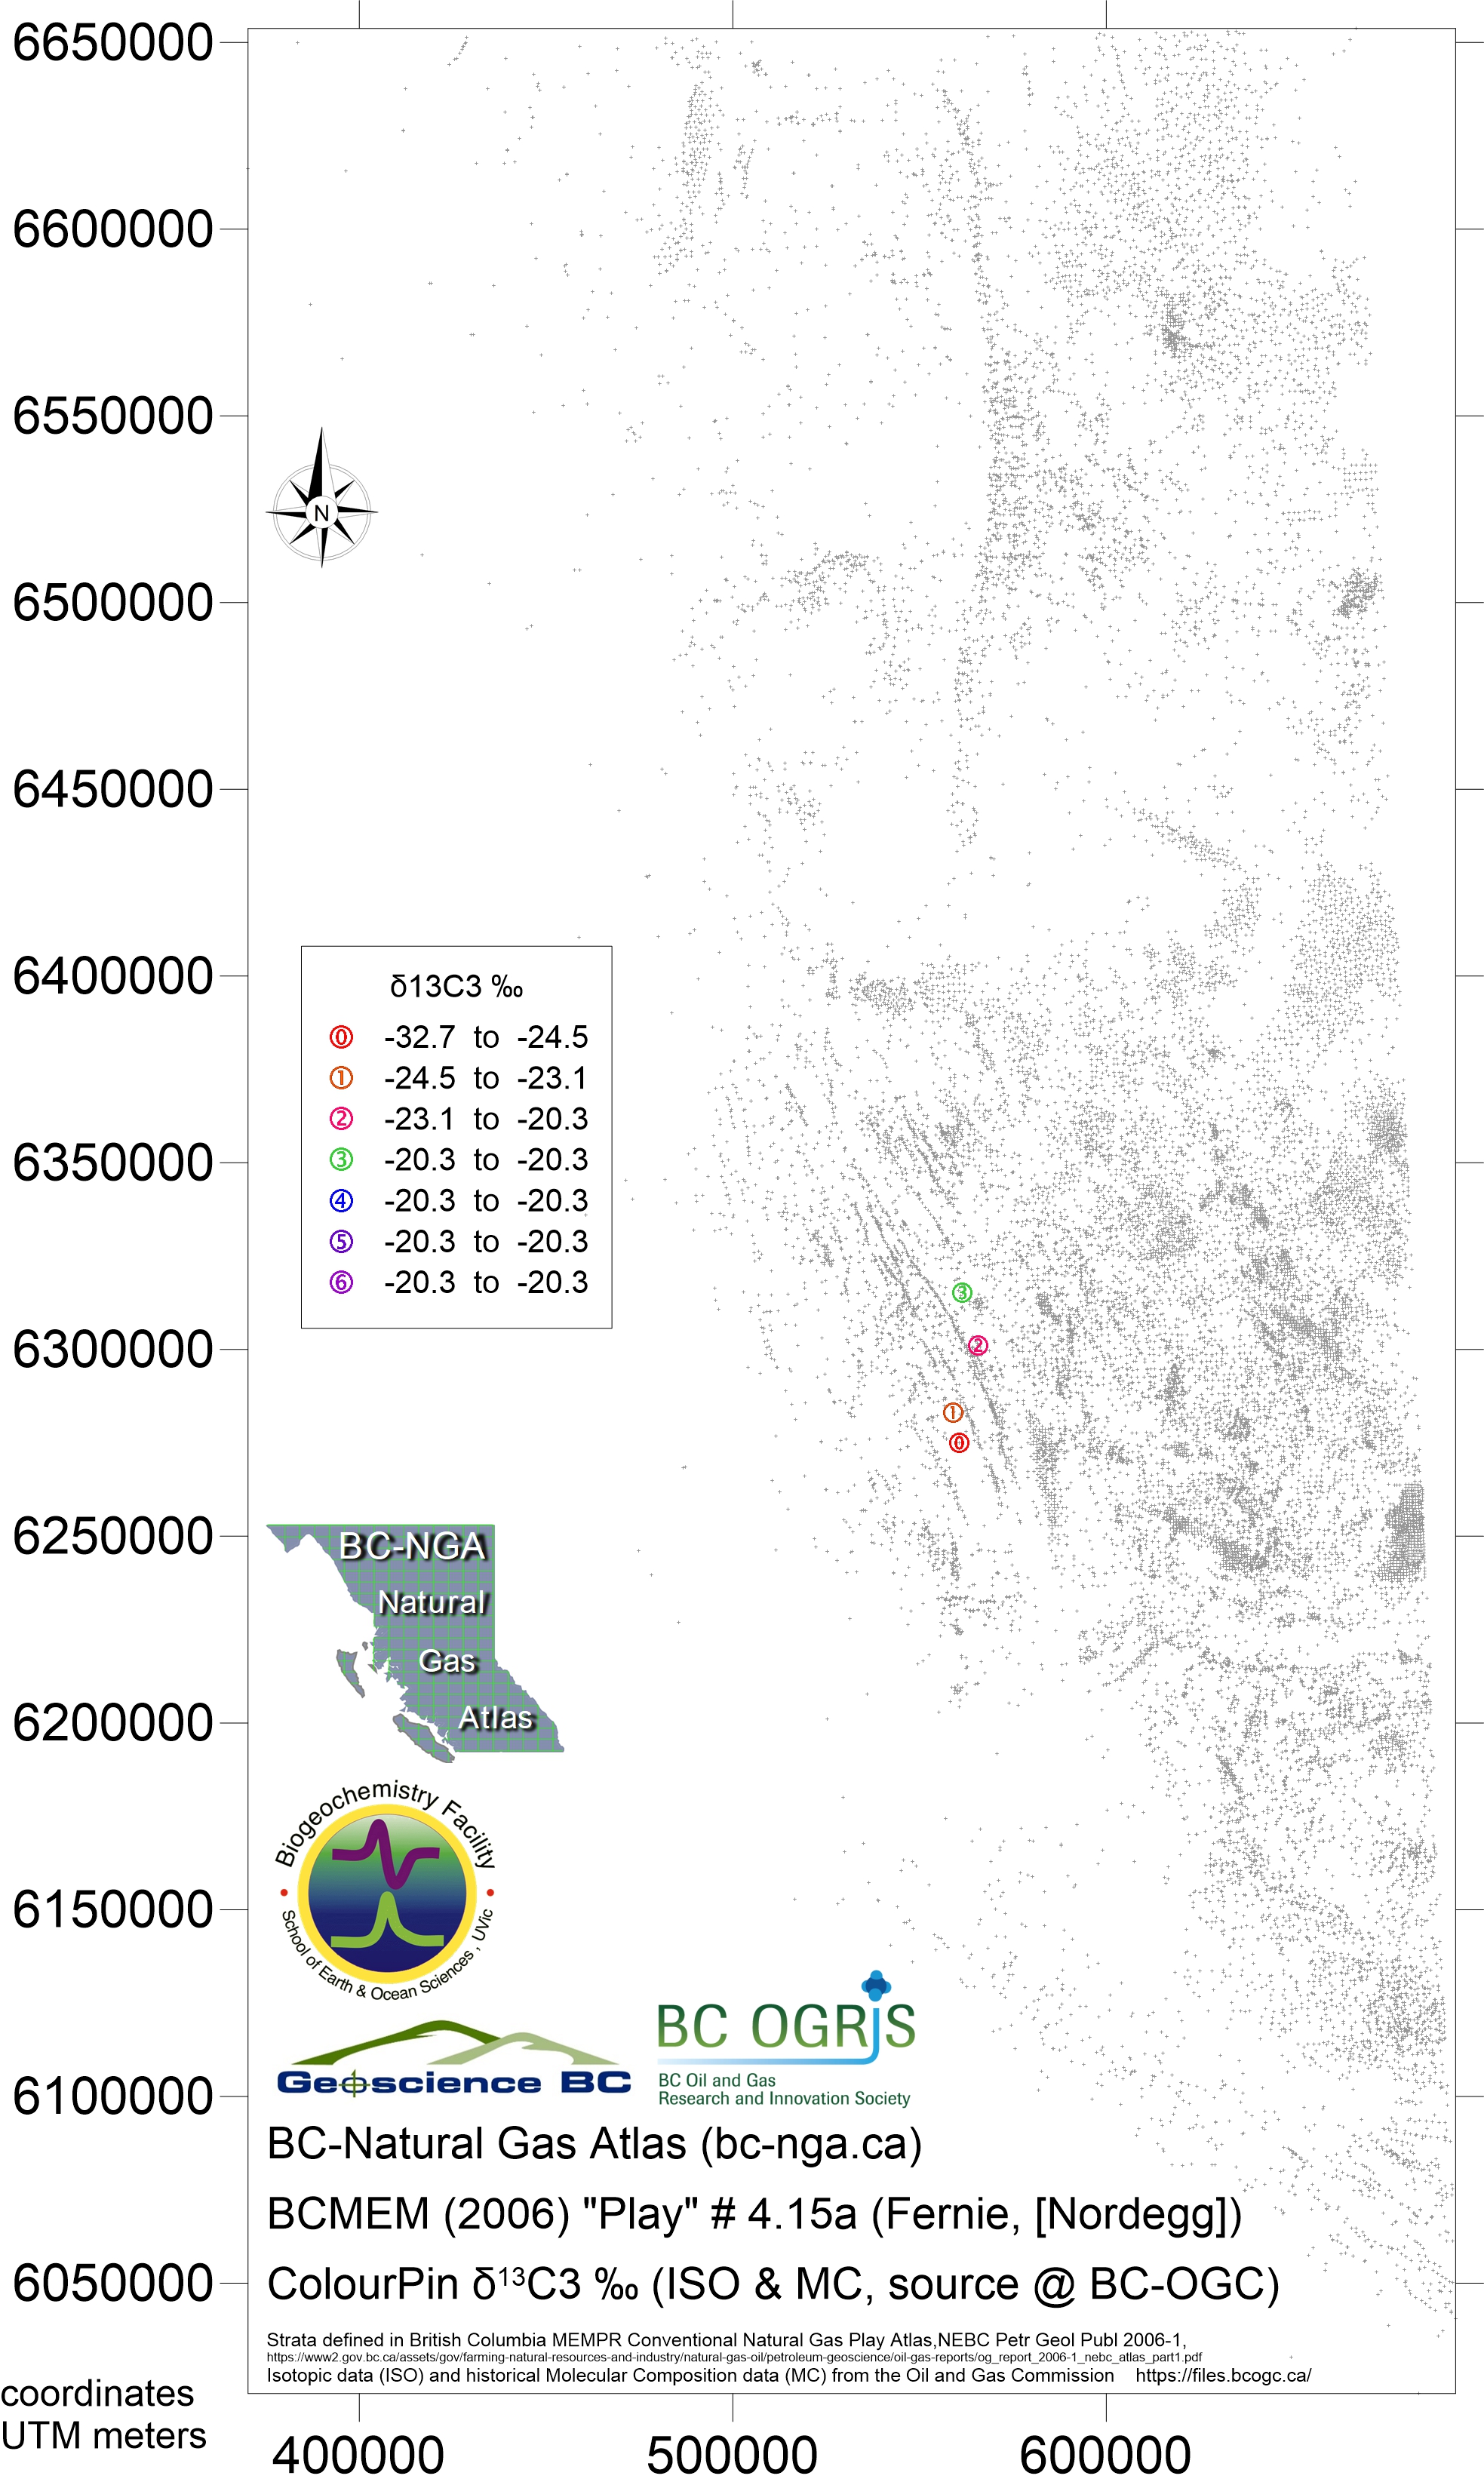
Play 4.15a Fernie Group and equivalents, Nordegg Formation
- Map123 Nov 2018 play 4.15a Fernie/Nordegg eqv Bernard ratio
- Map124 Nov 2018 play 4.15a Fernie/Nordegg eqv dryness ratio
- Map125 Nov 2018 play 4.15a Fernie/Nordegg eqv iC4nC4 ratio
- Map126 Nov 2018 play 4.15a Fernie/Nordegg eqv δ13CH4
- Map127 Nov 2018 play 4.15a Fernie/Nordegg eqv Cδ2H4
- Map128 Nov 2018 play 4.15a Fernie/Nordegg eqv δ13C2H6
- Map129 Nov 2018 play 4.15a Fernie/Nordegg eqv δ13C3H8
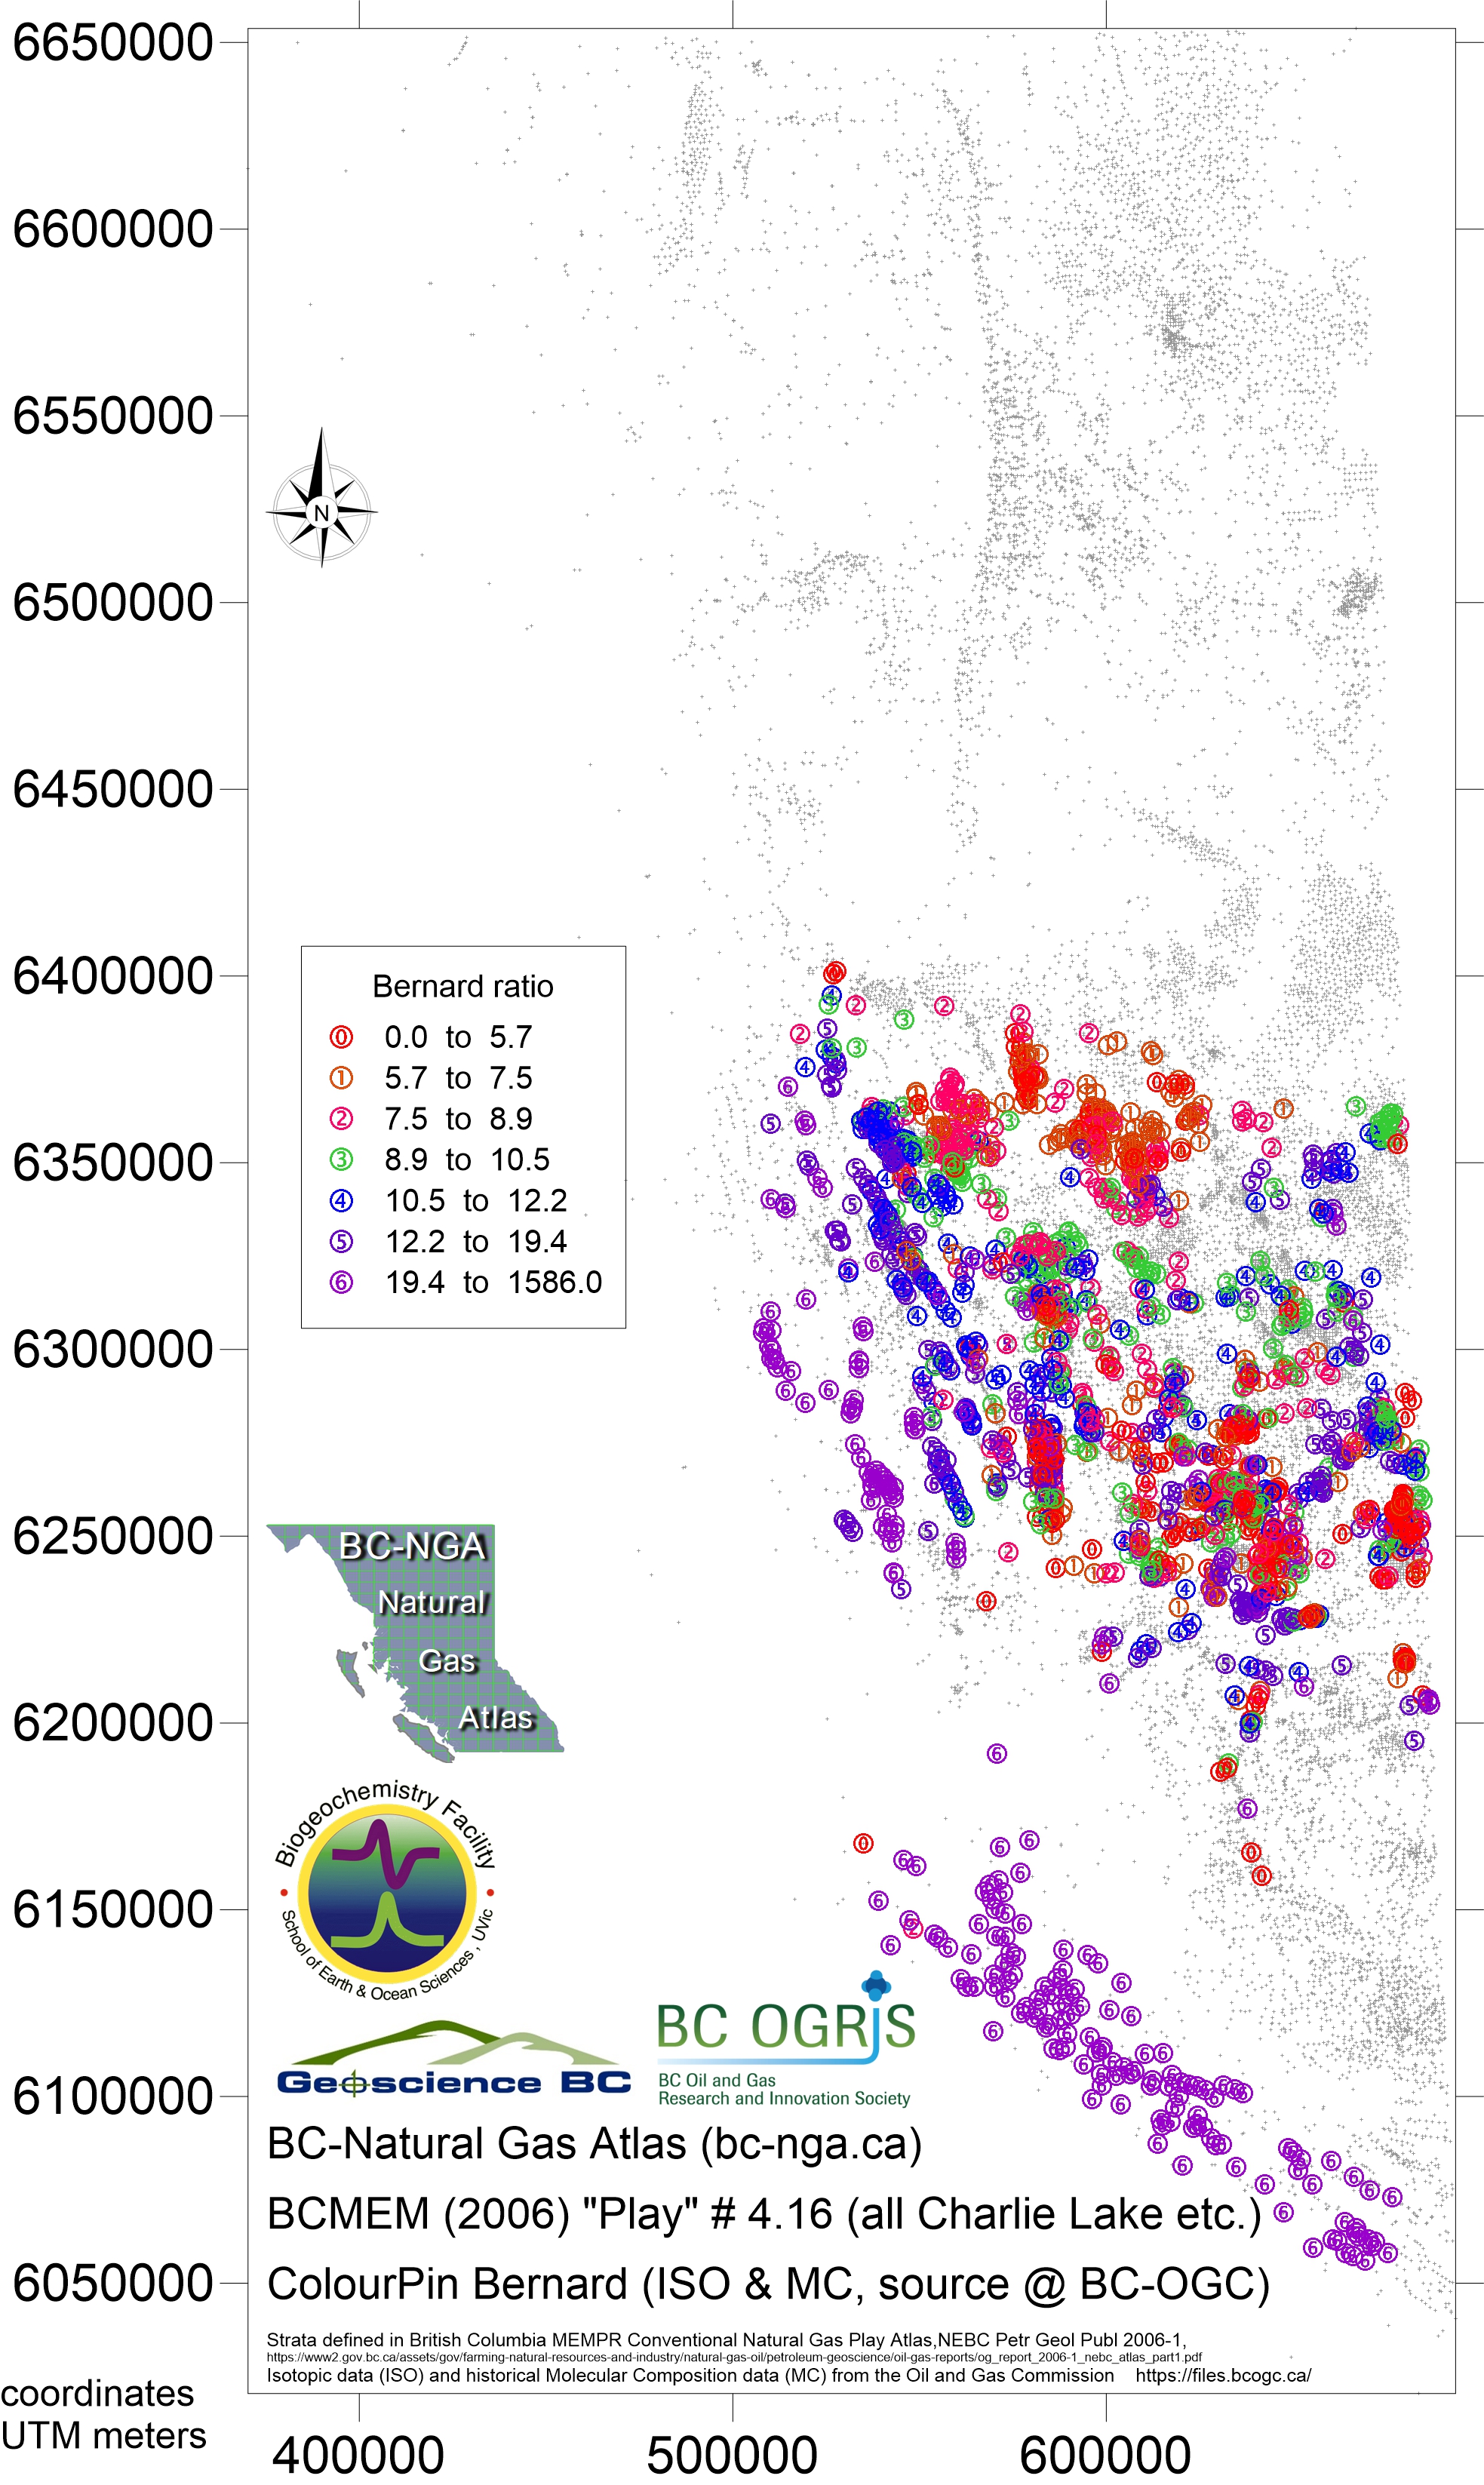
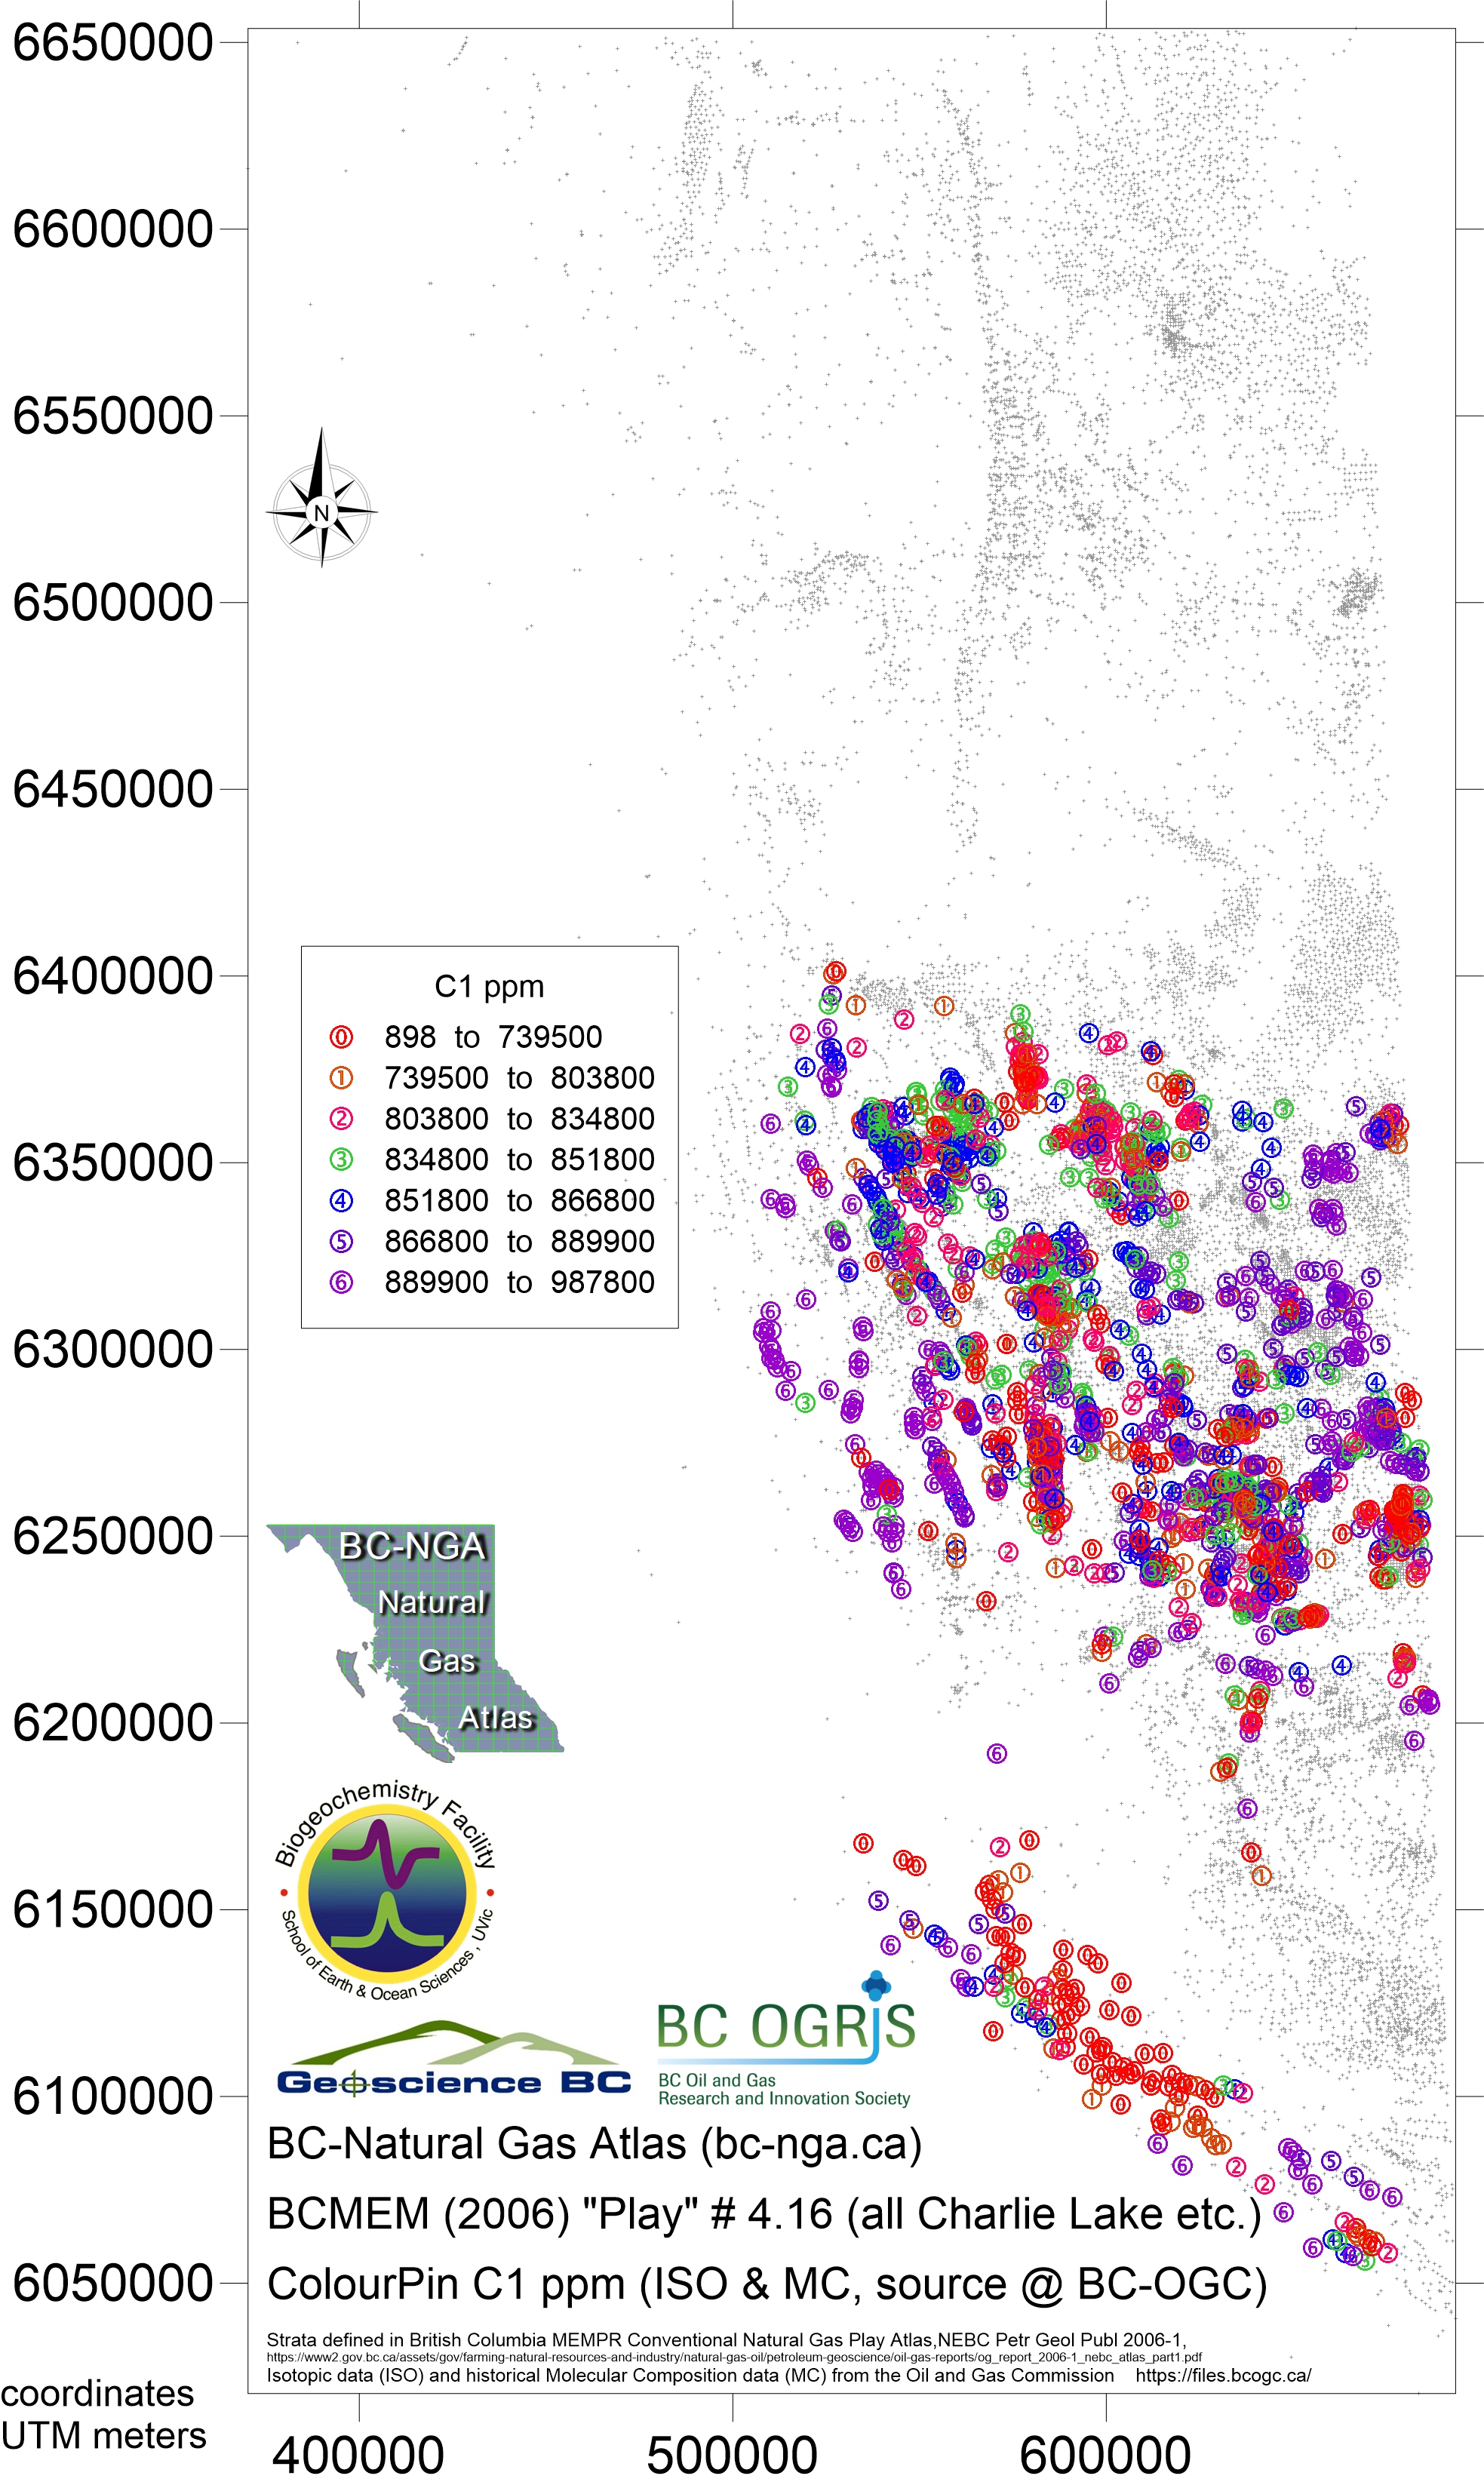
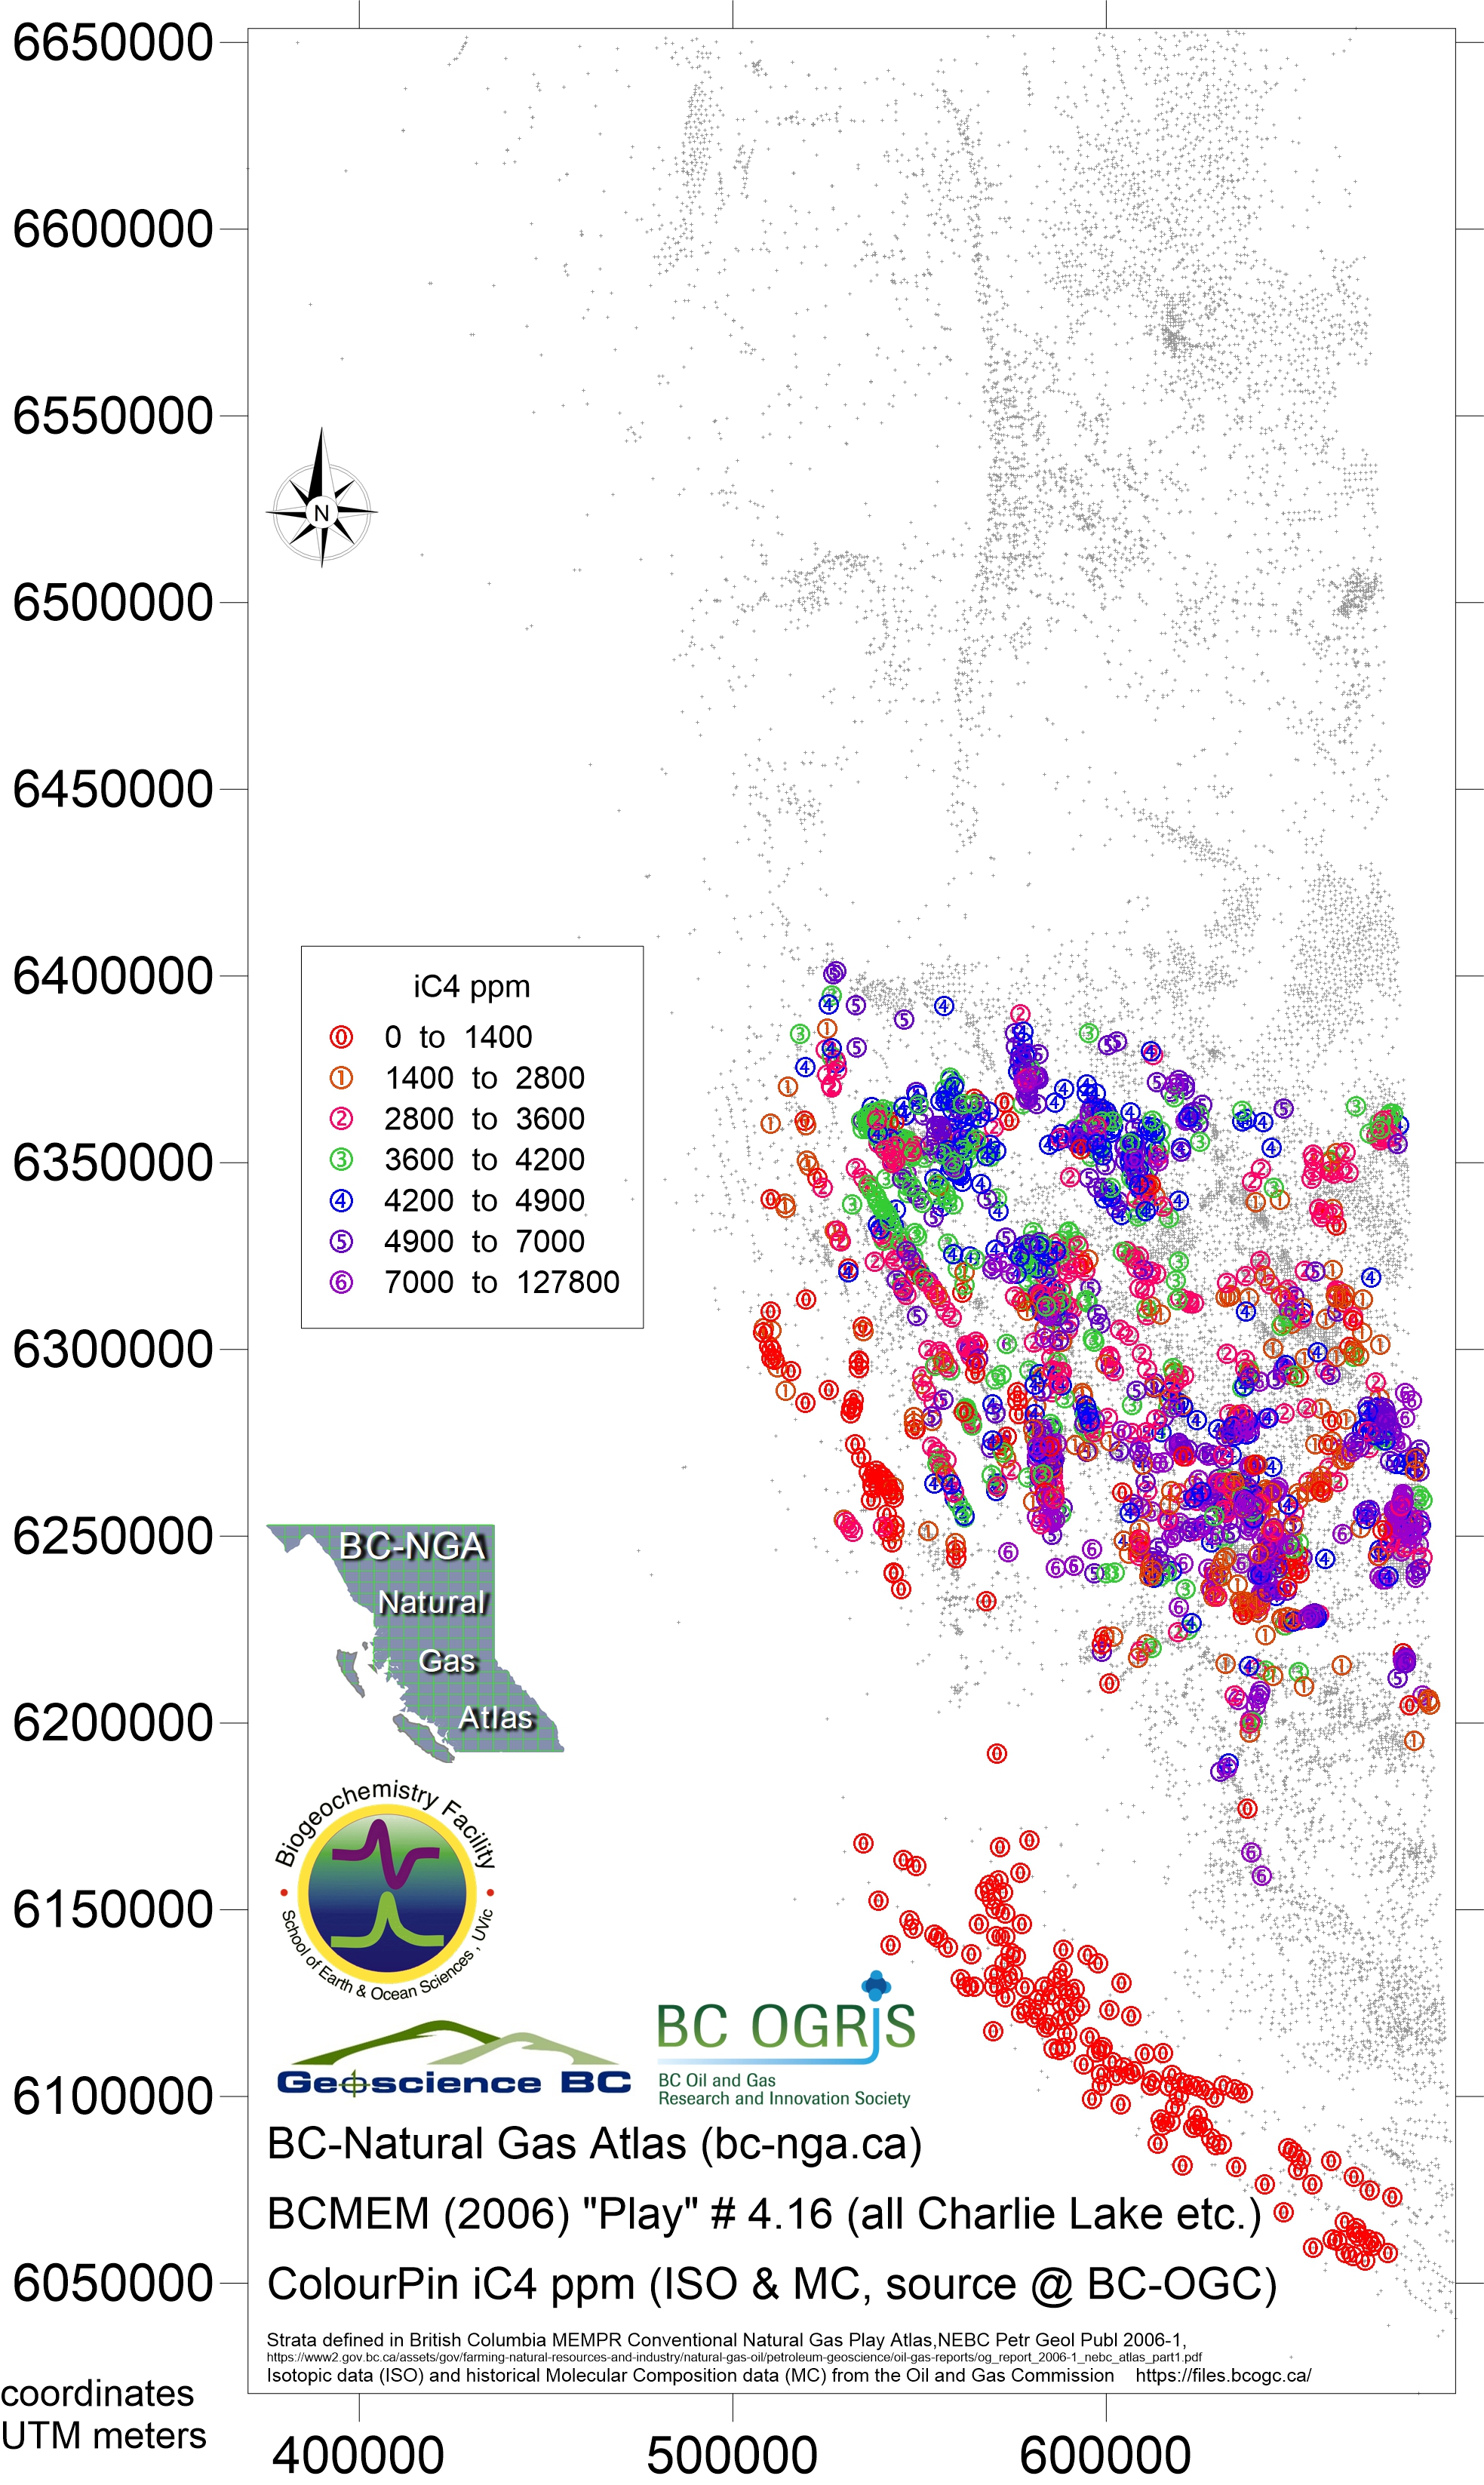
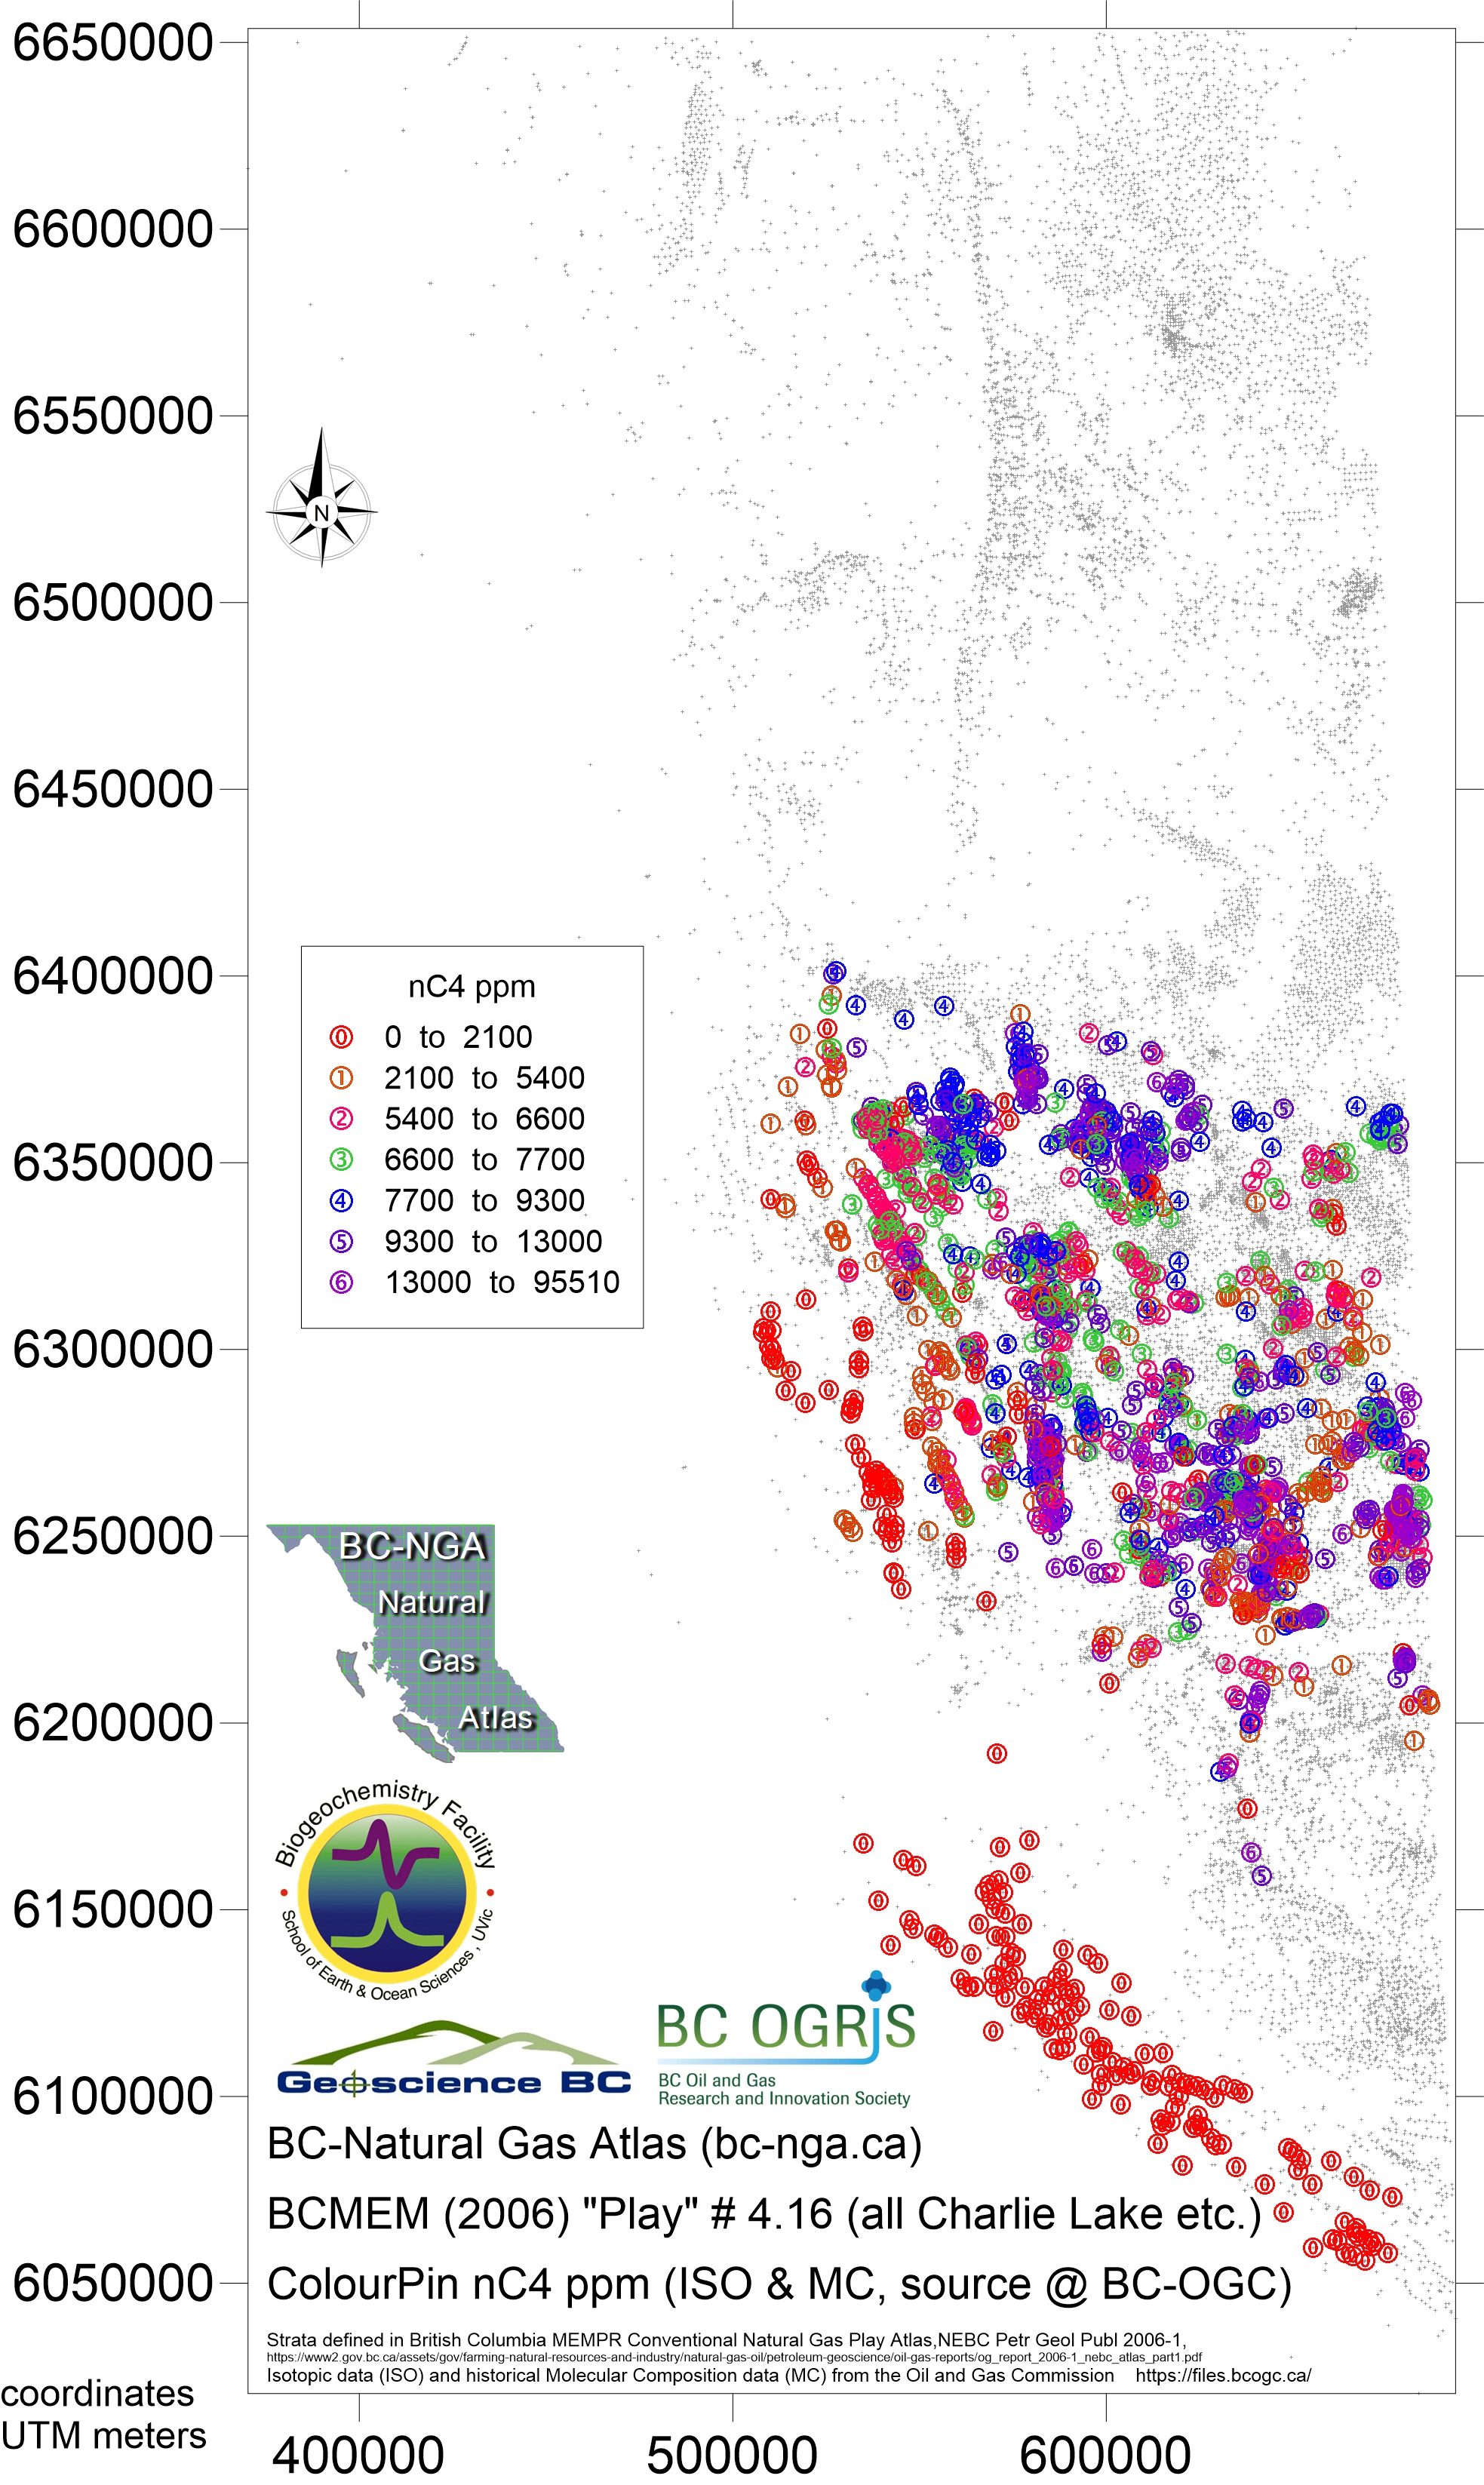
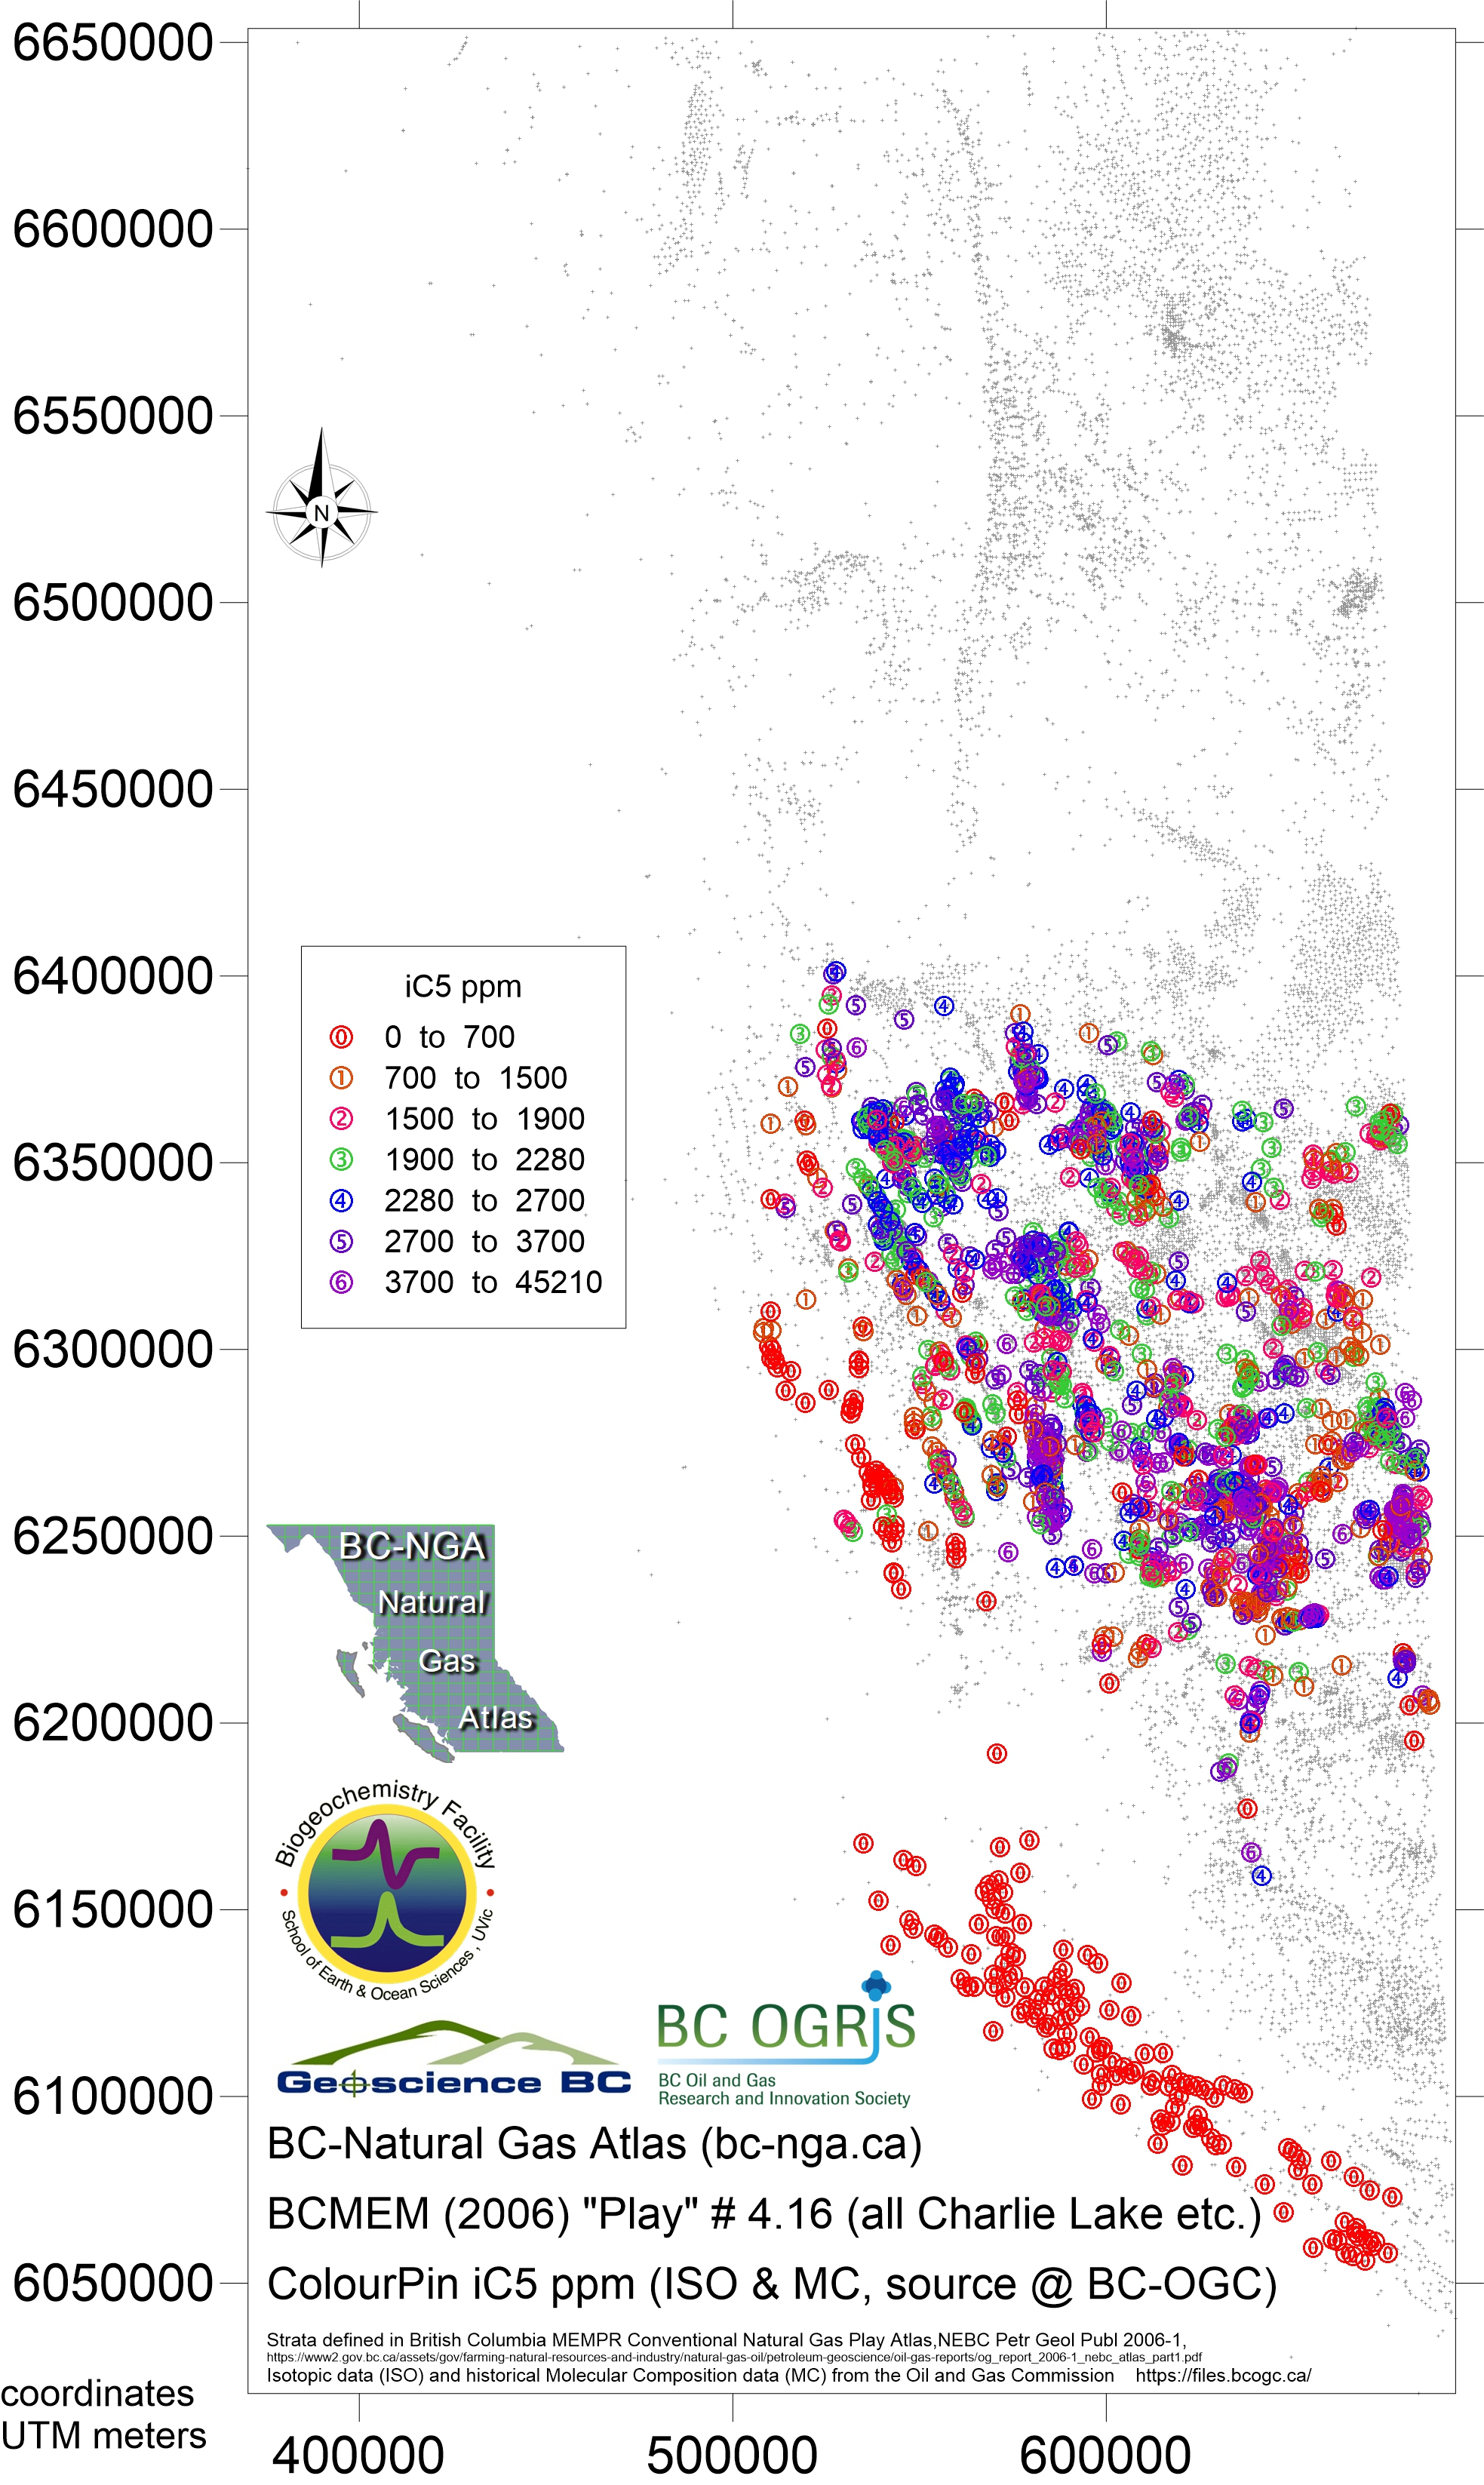
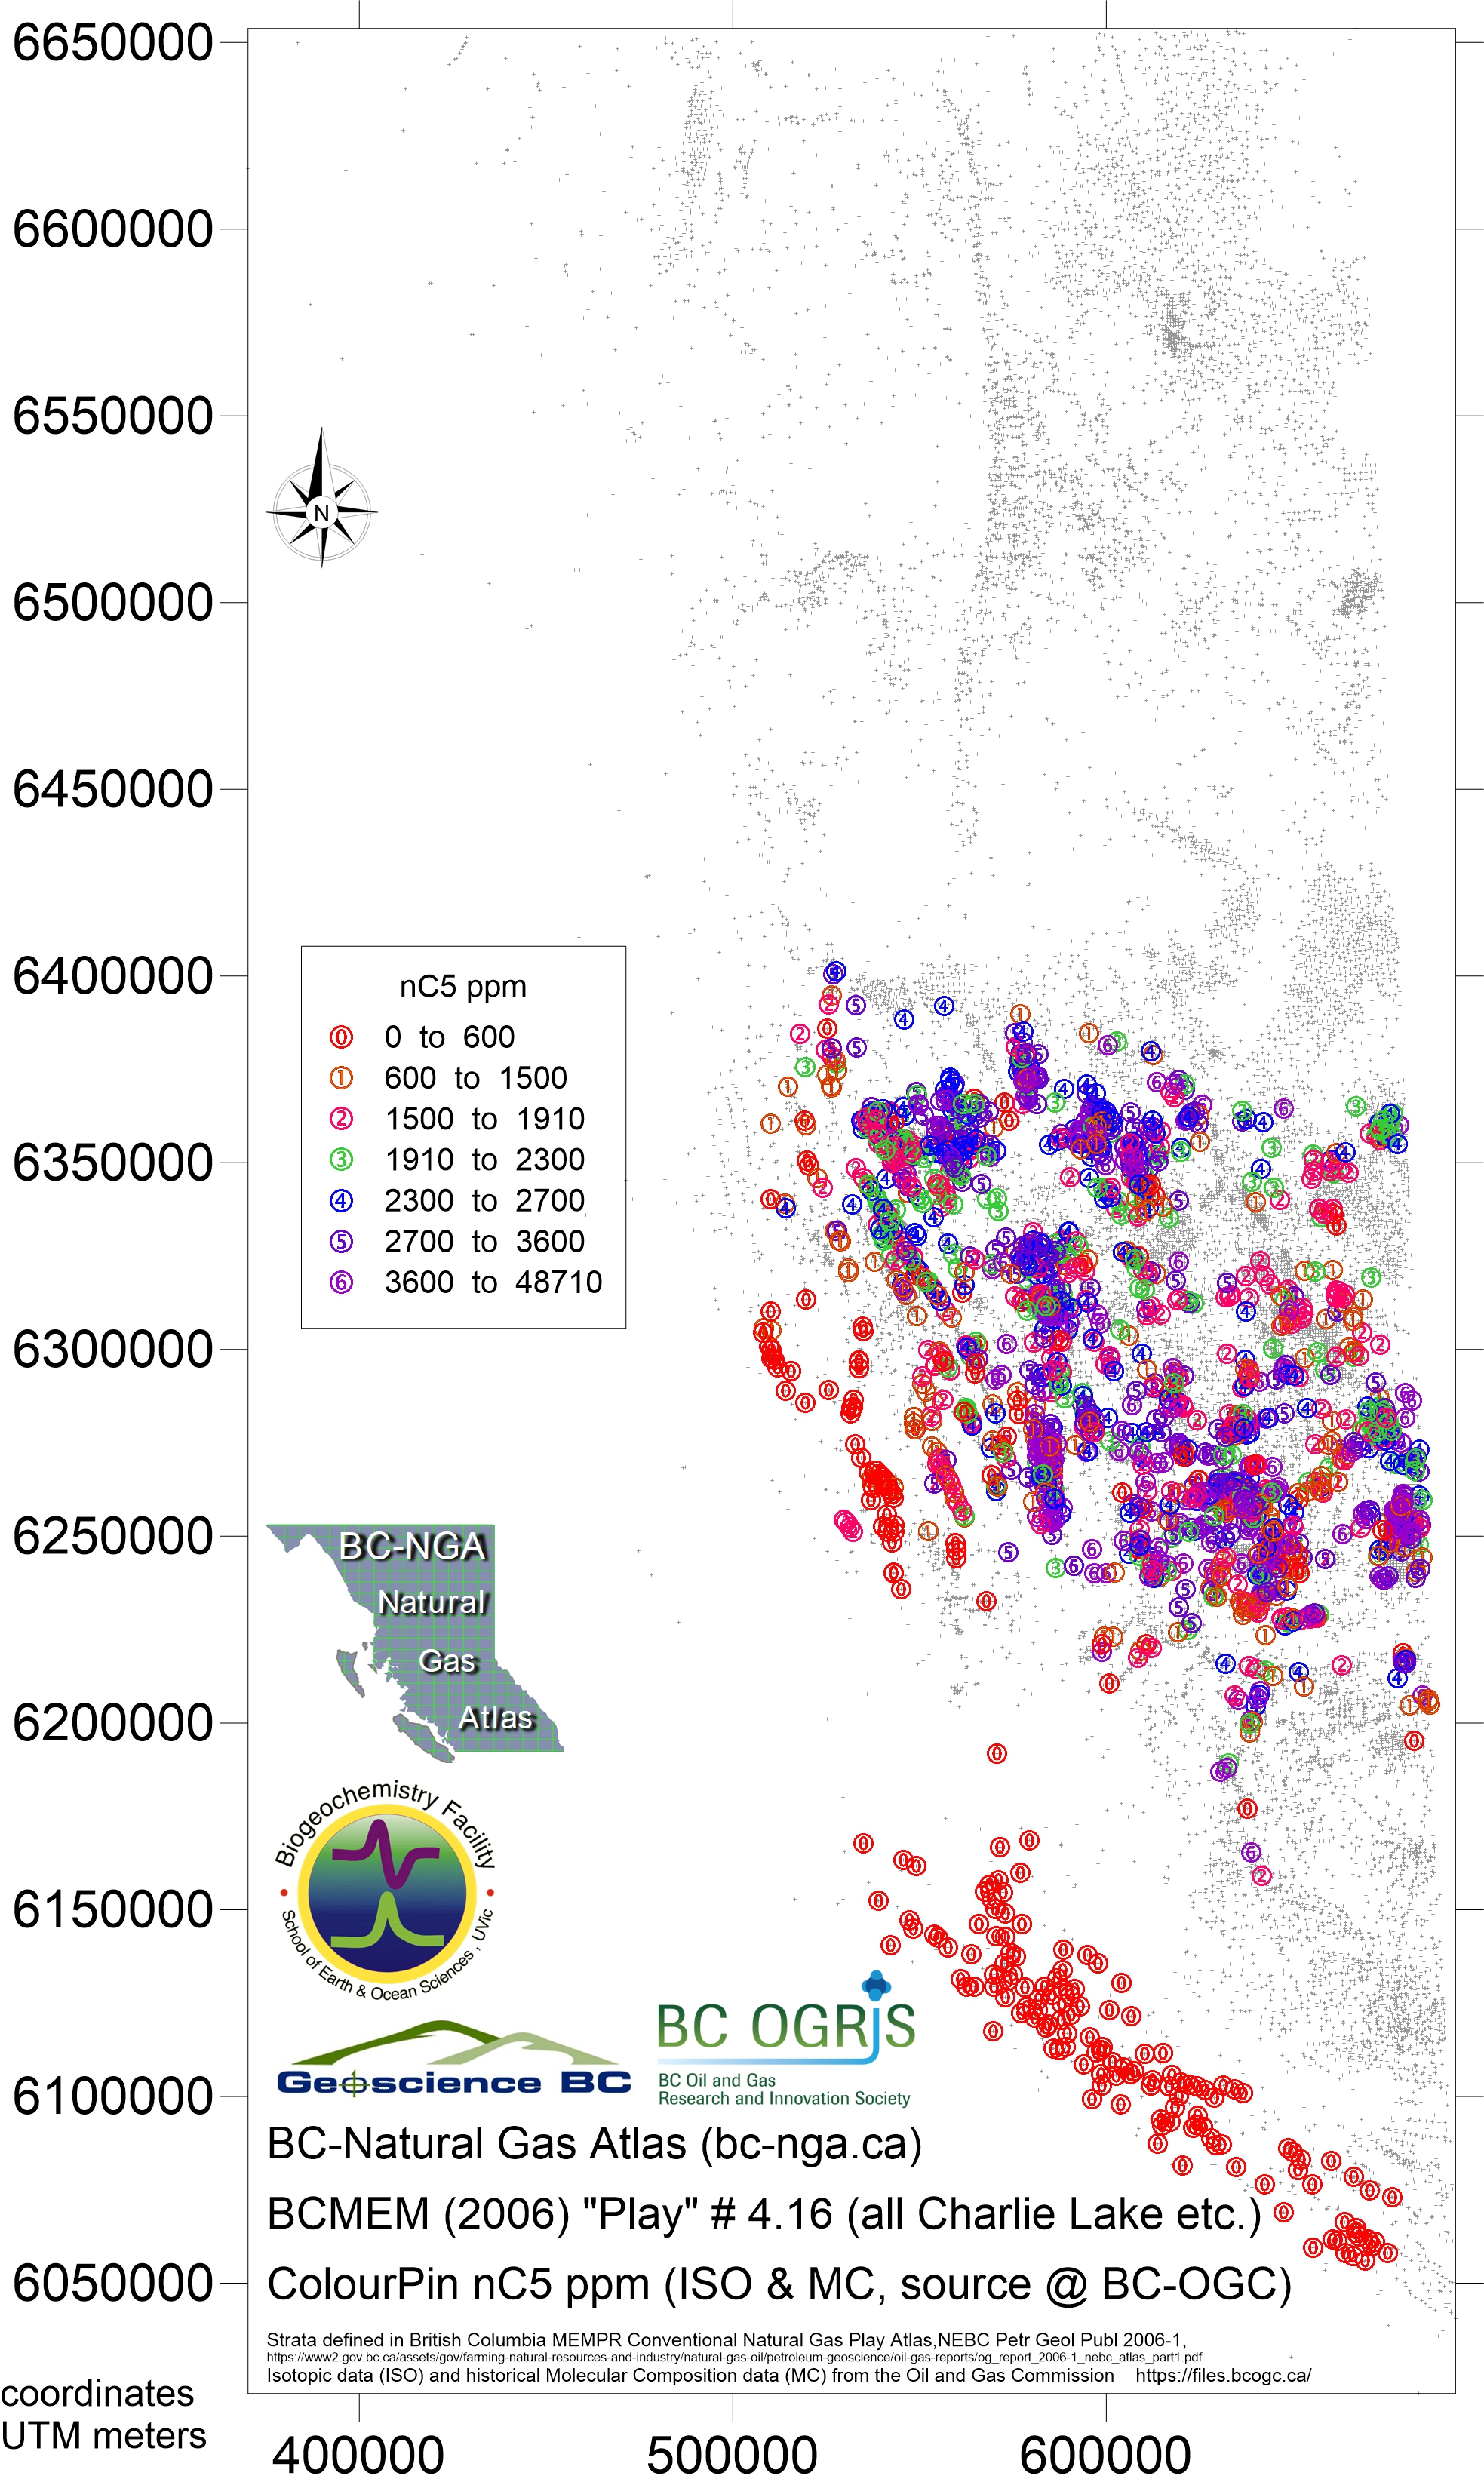
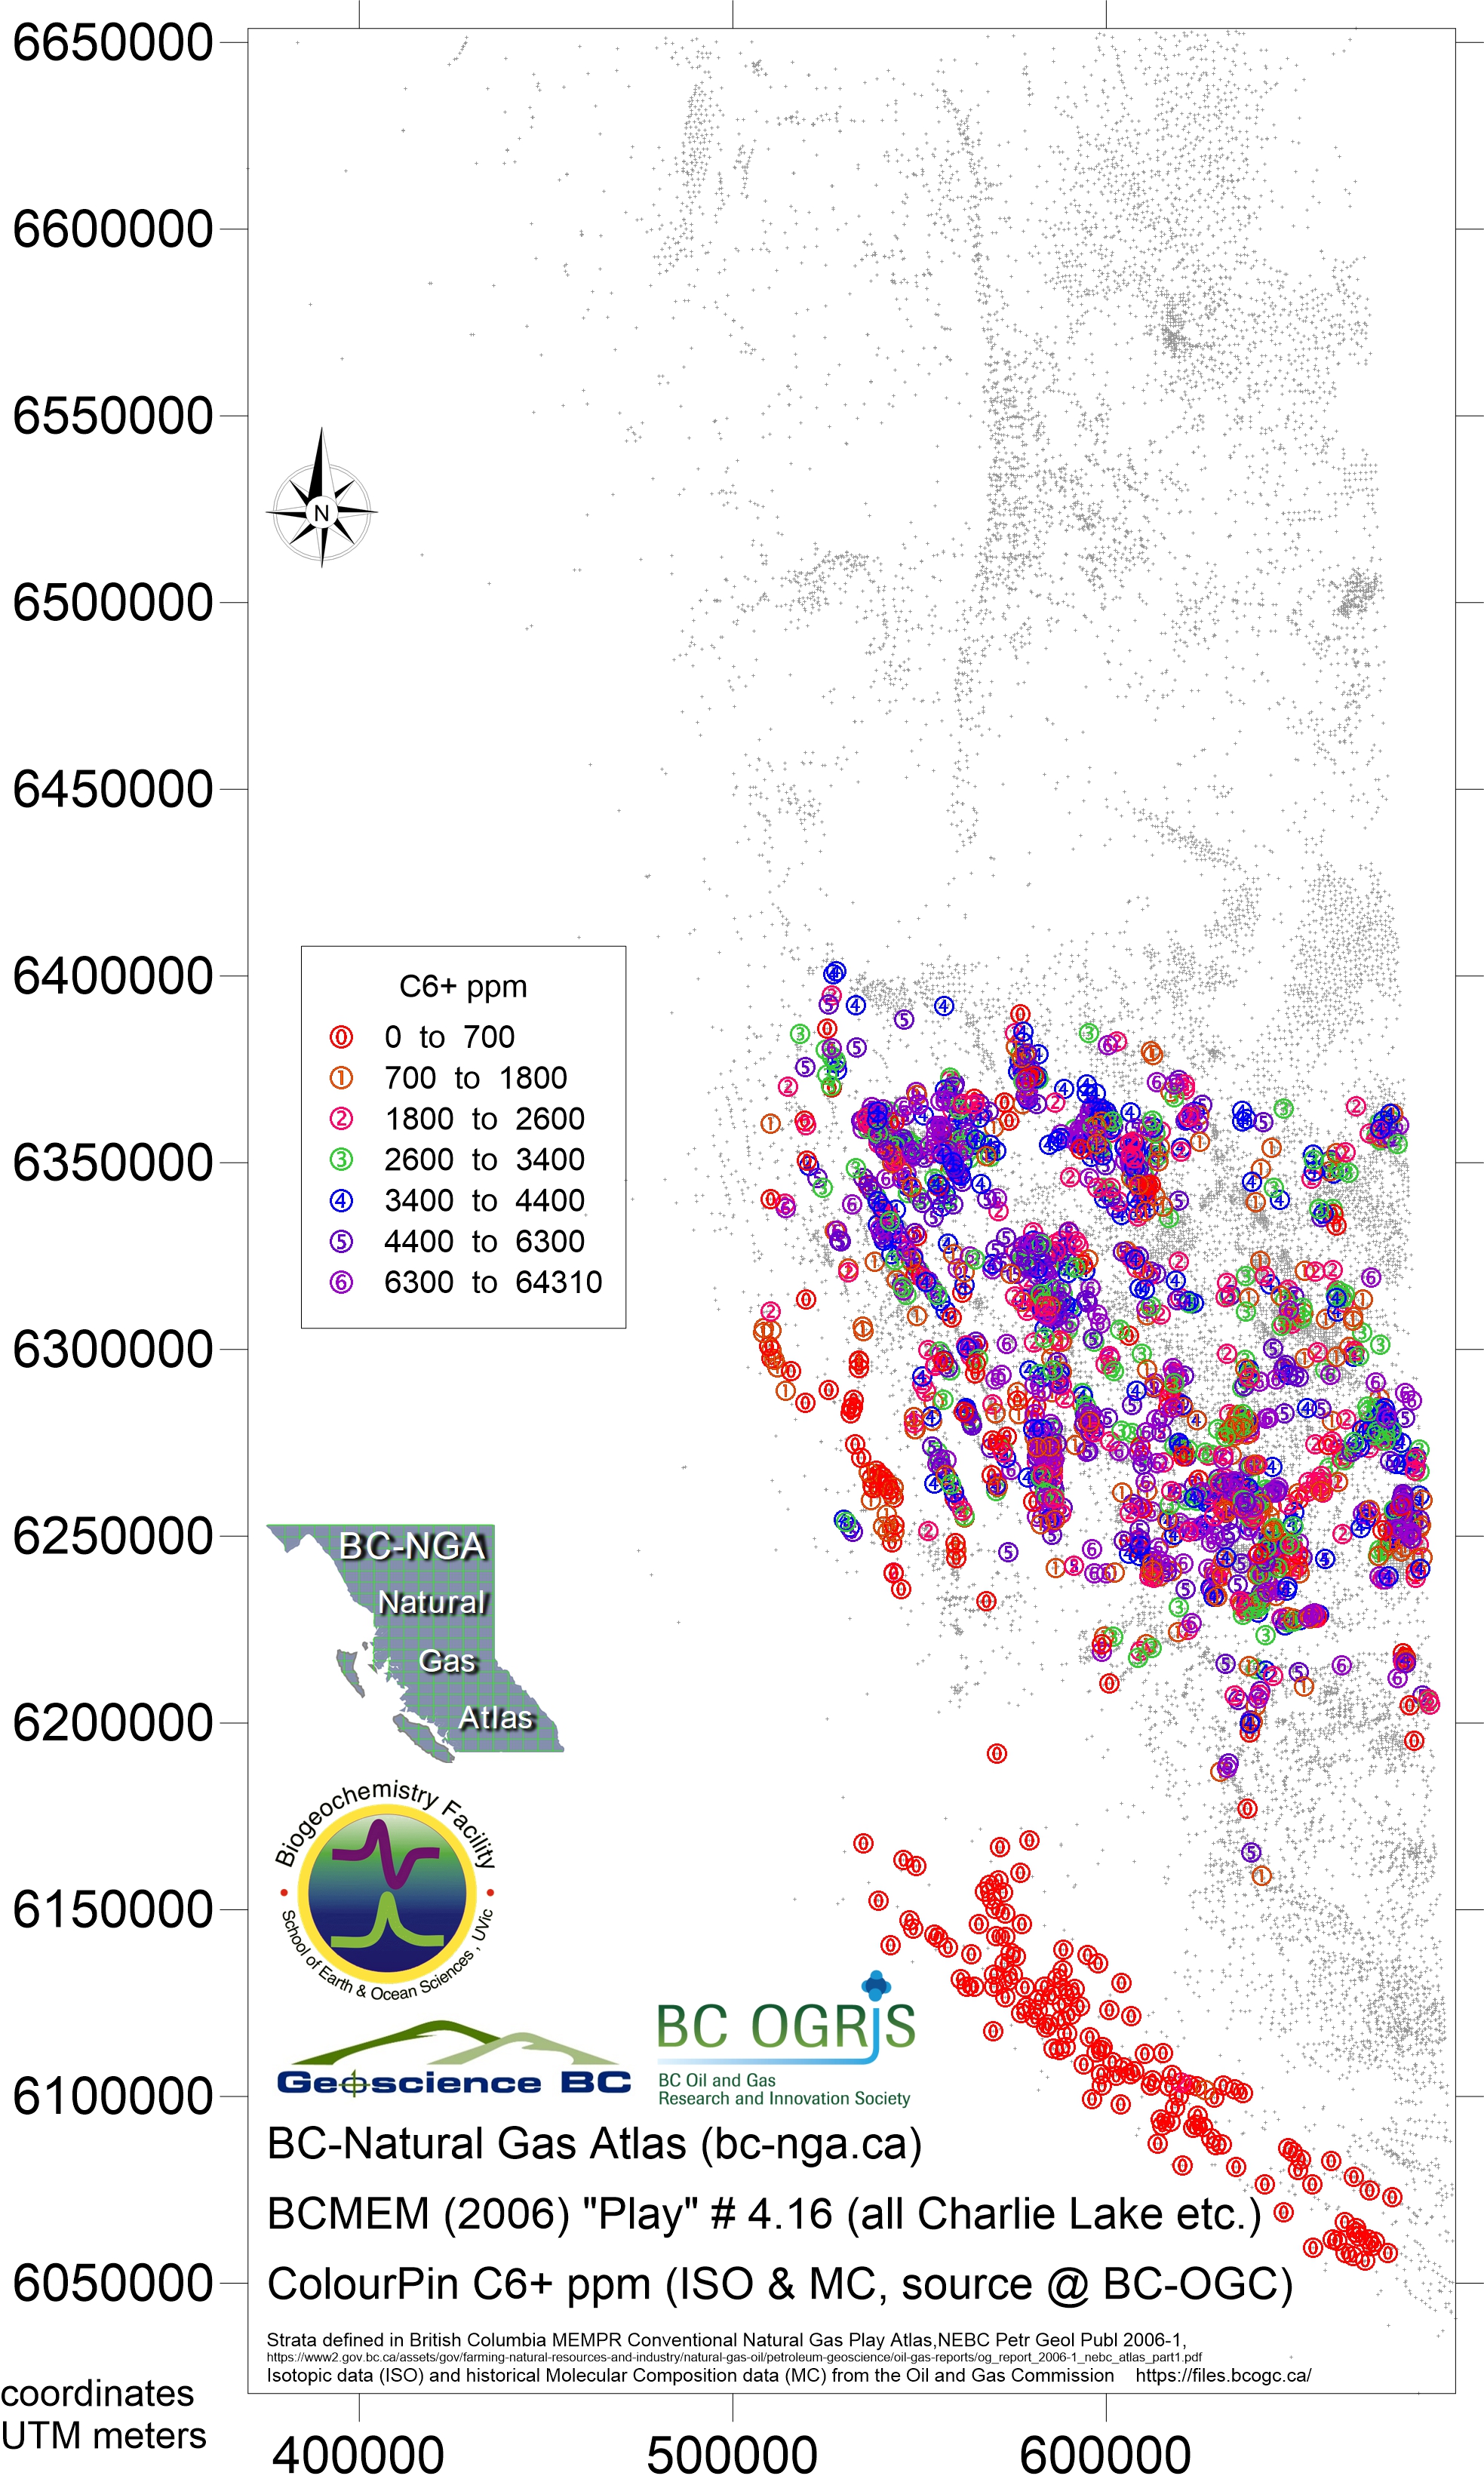
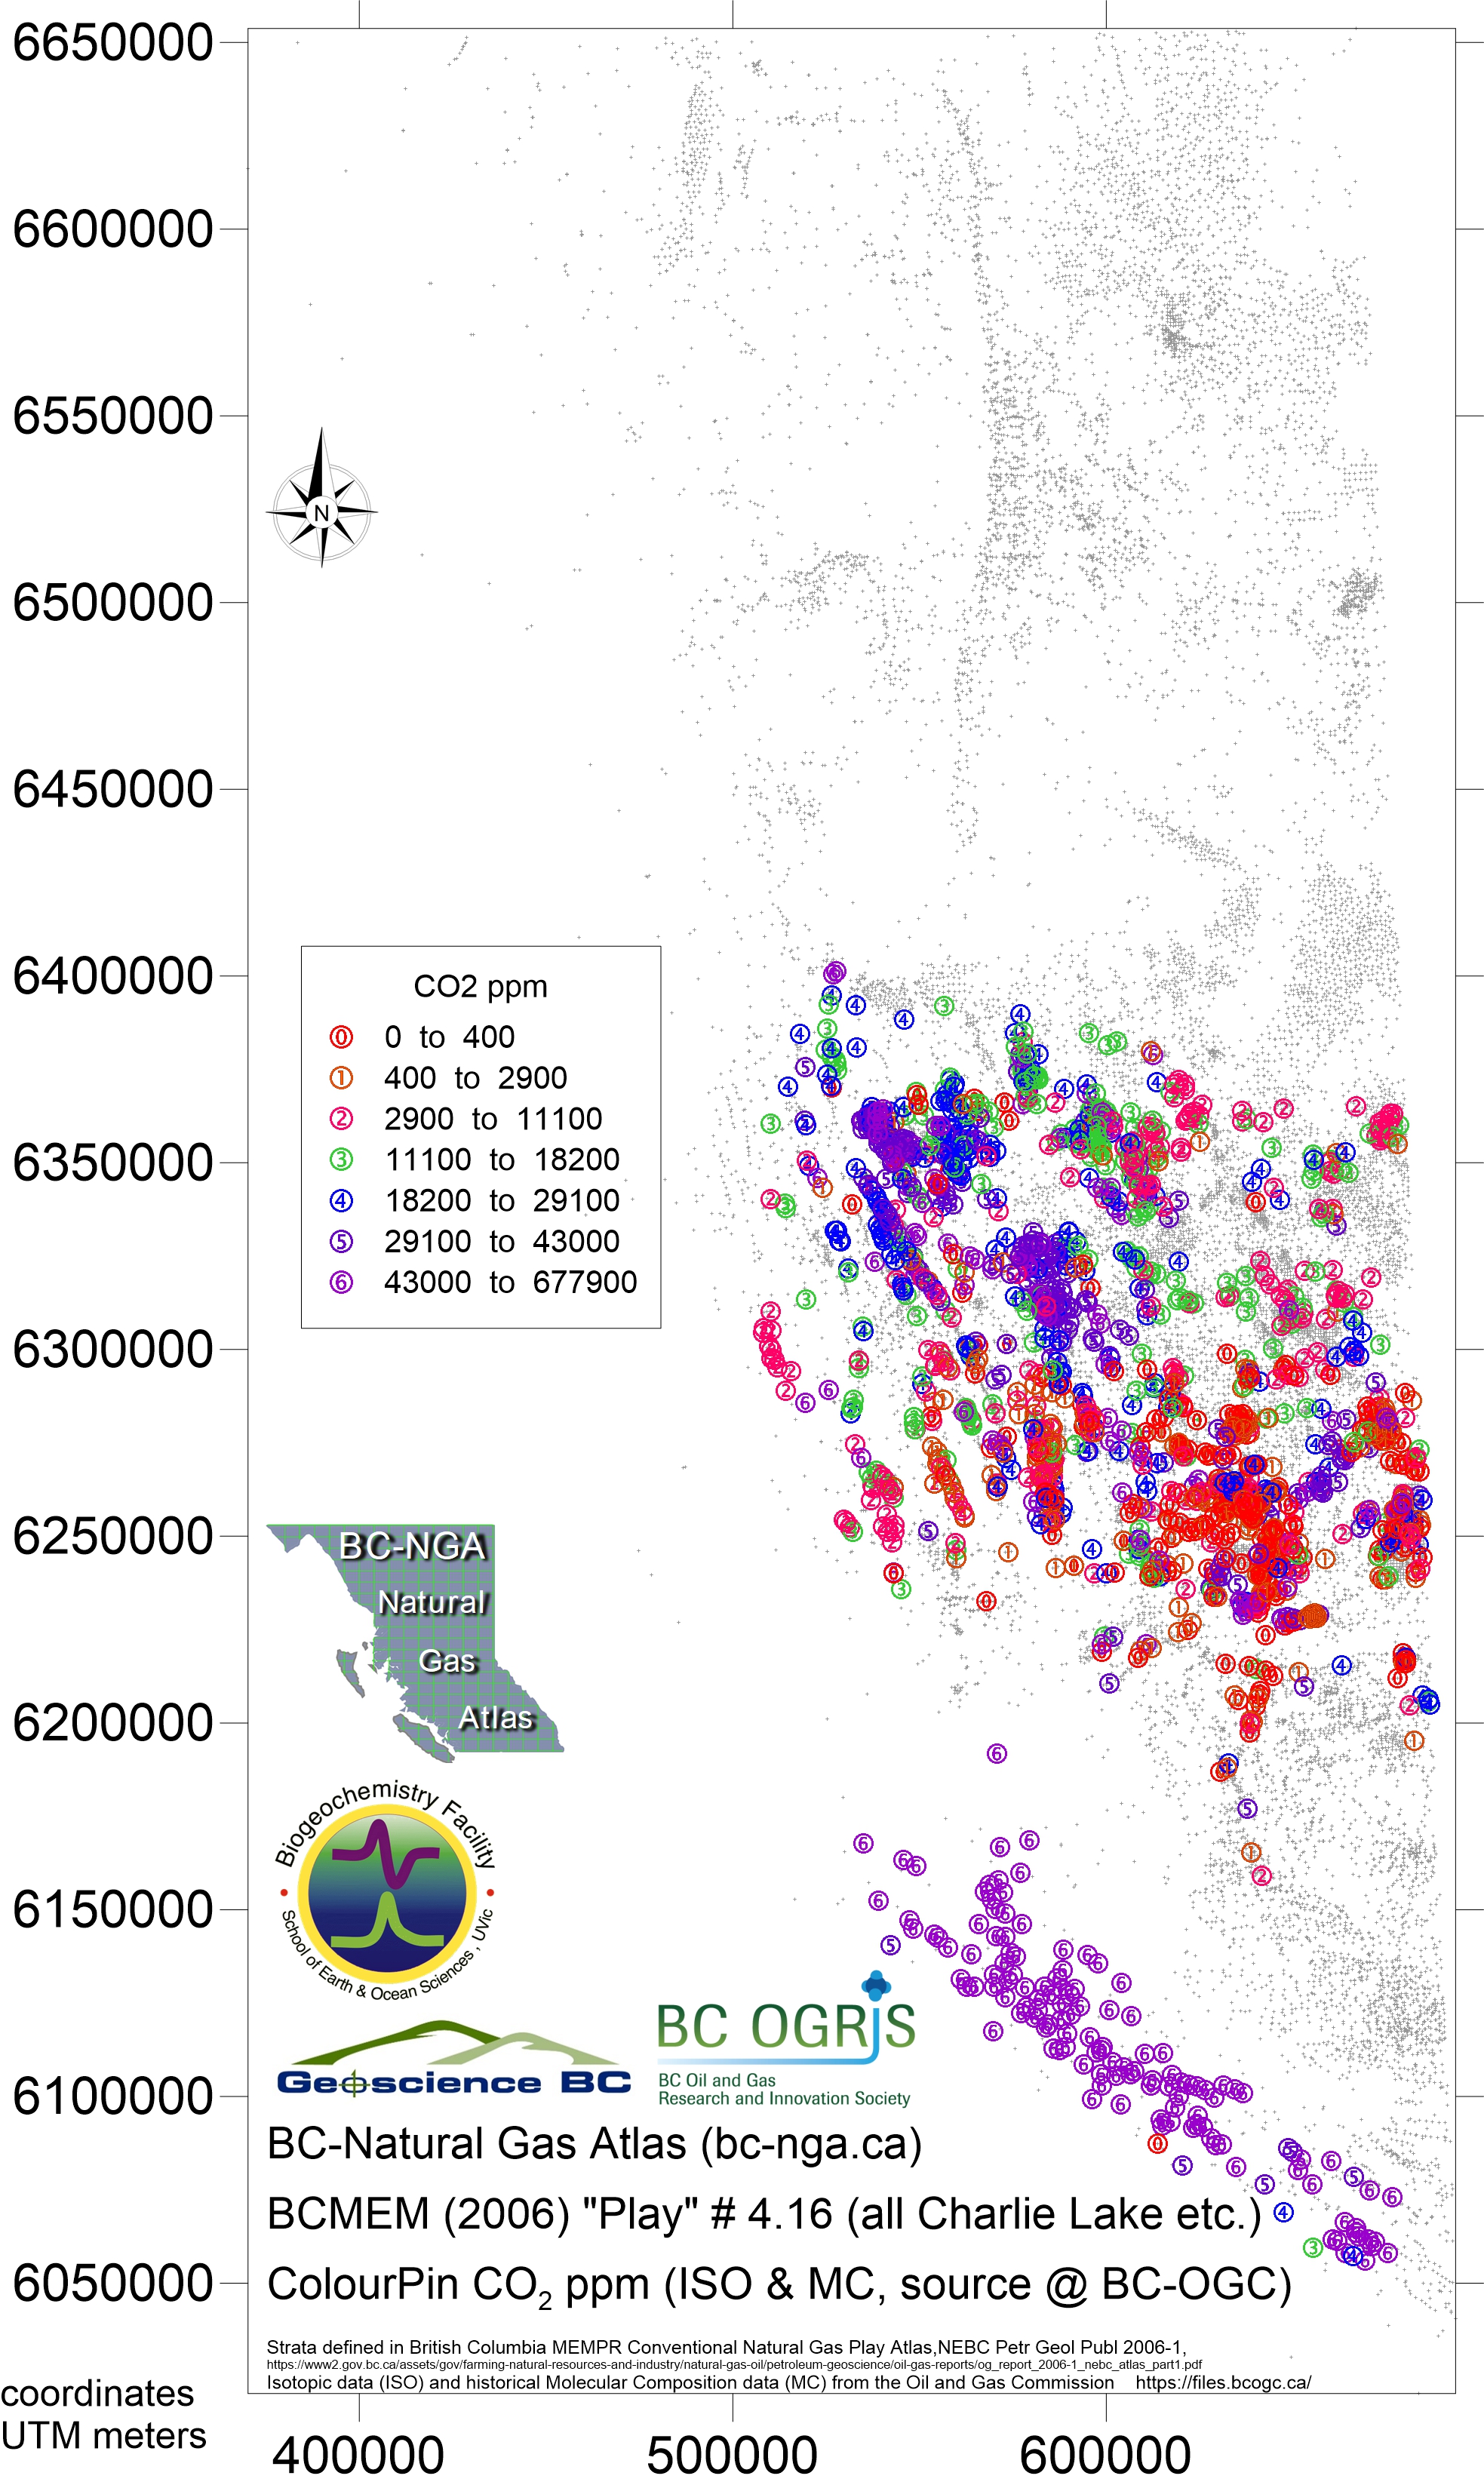
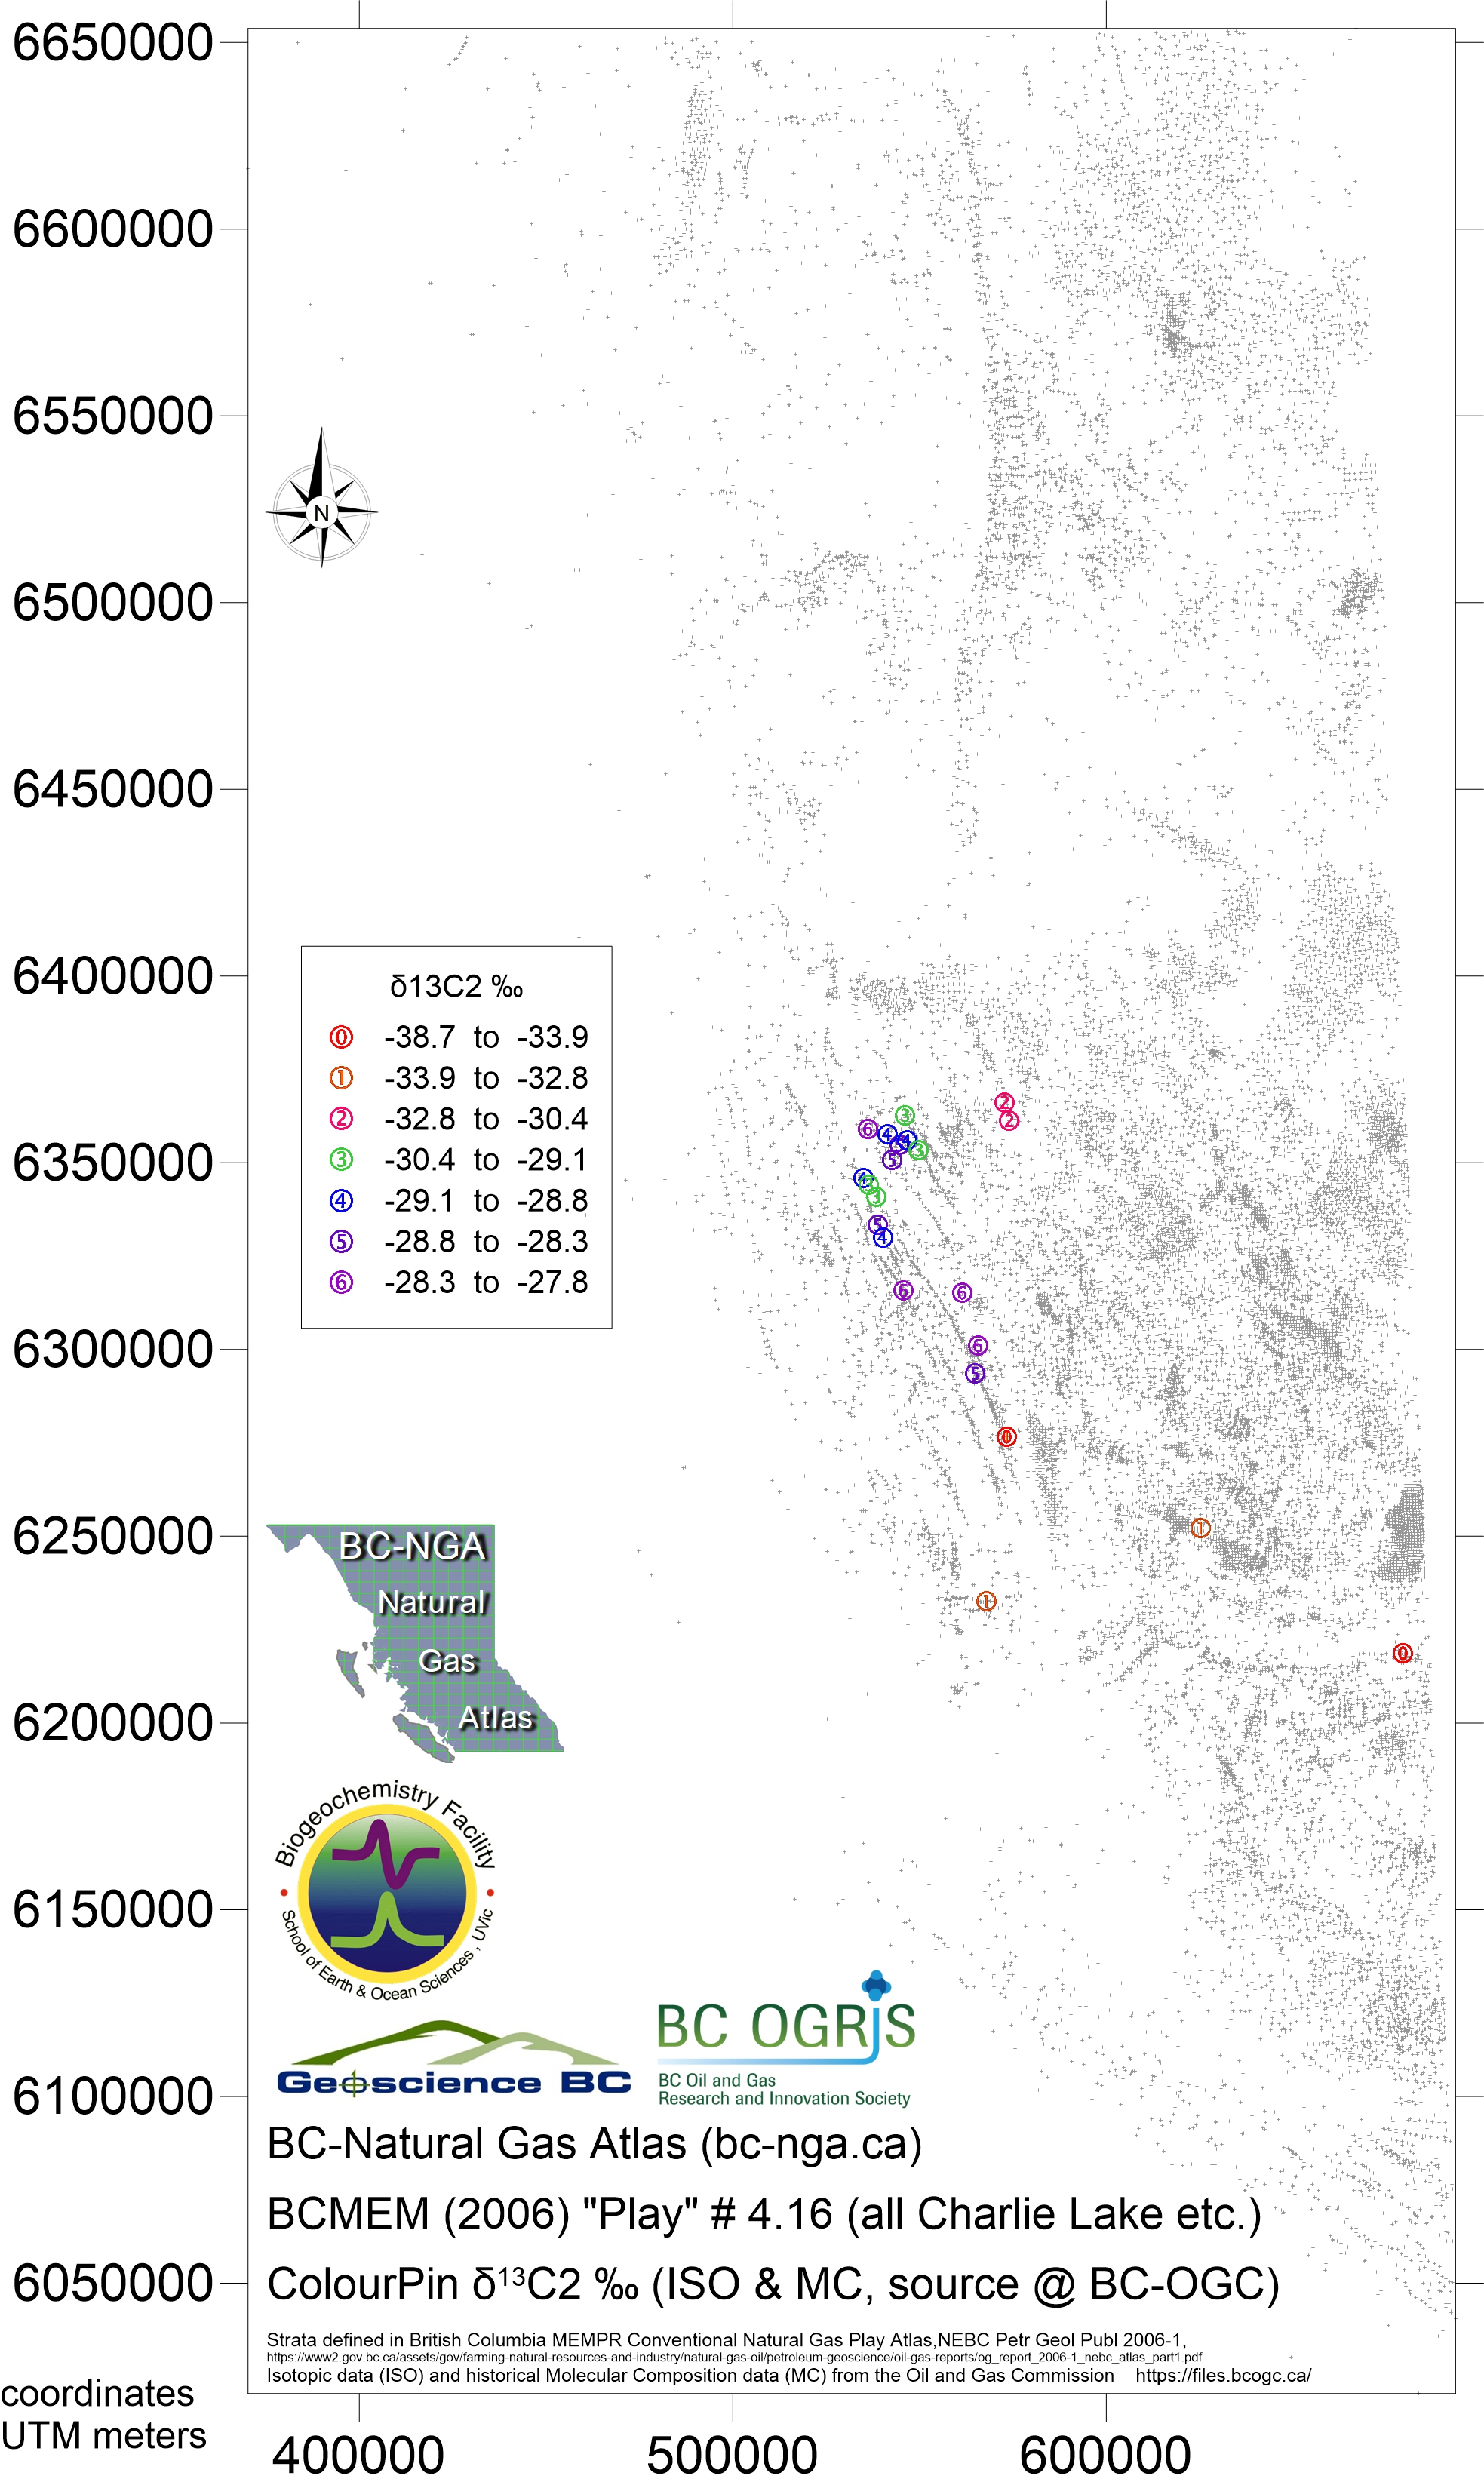
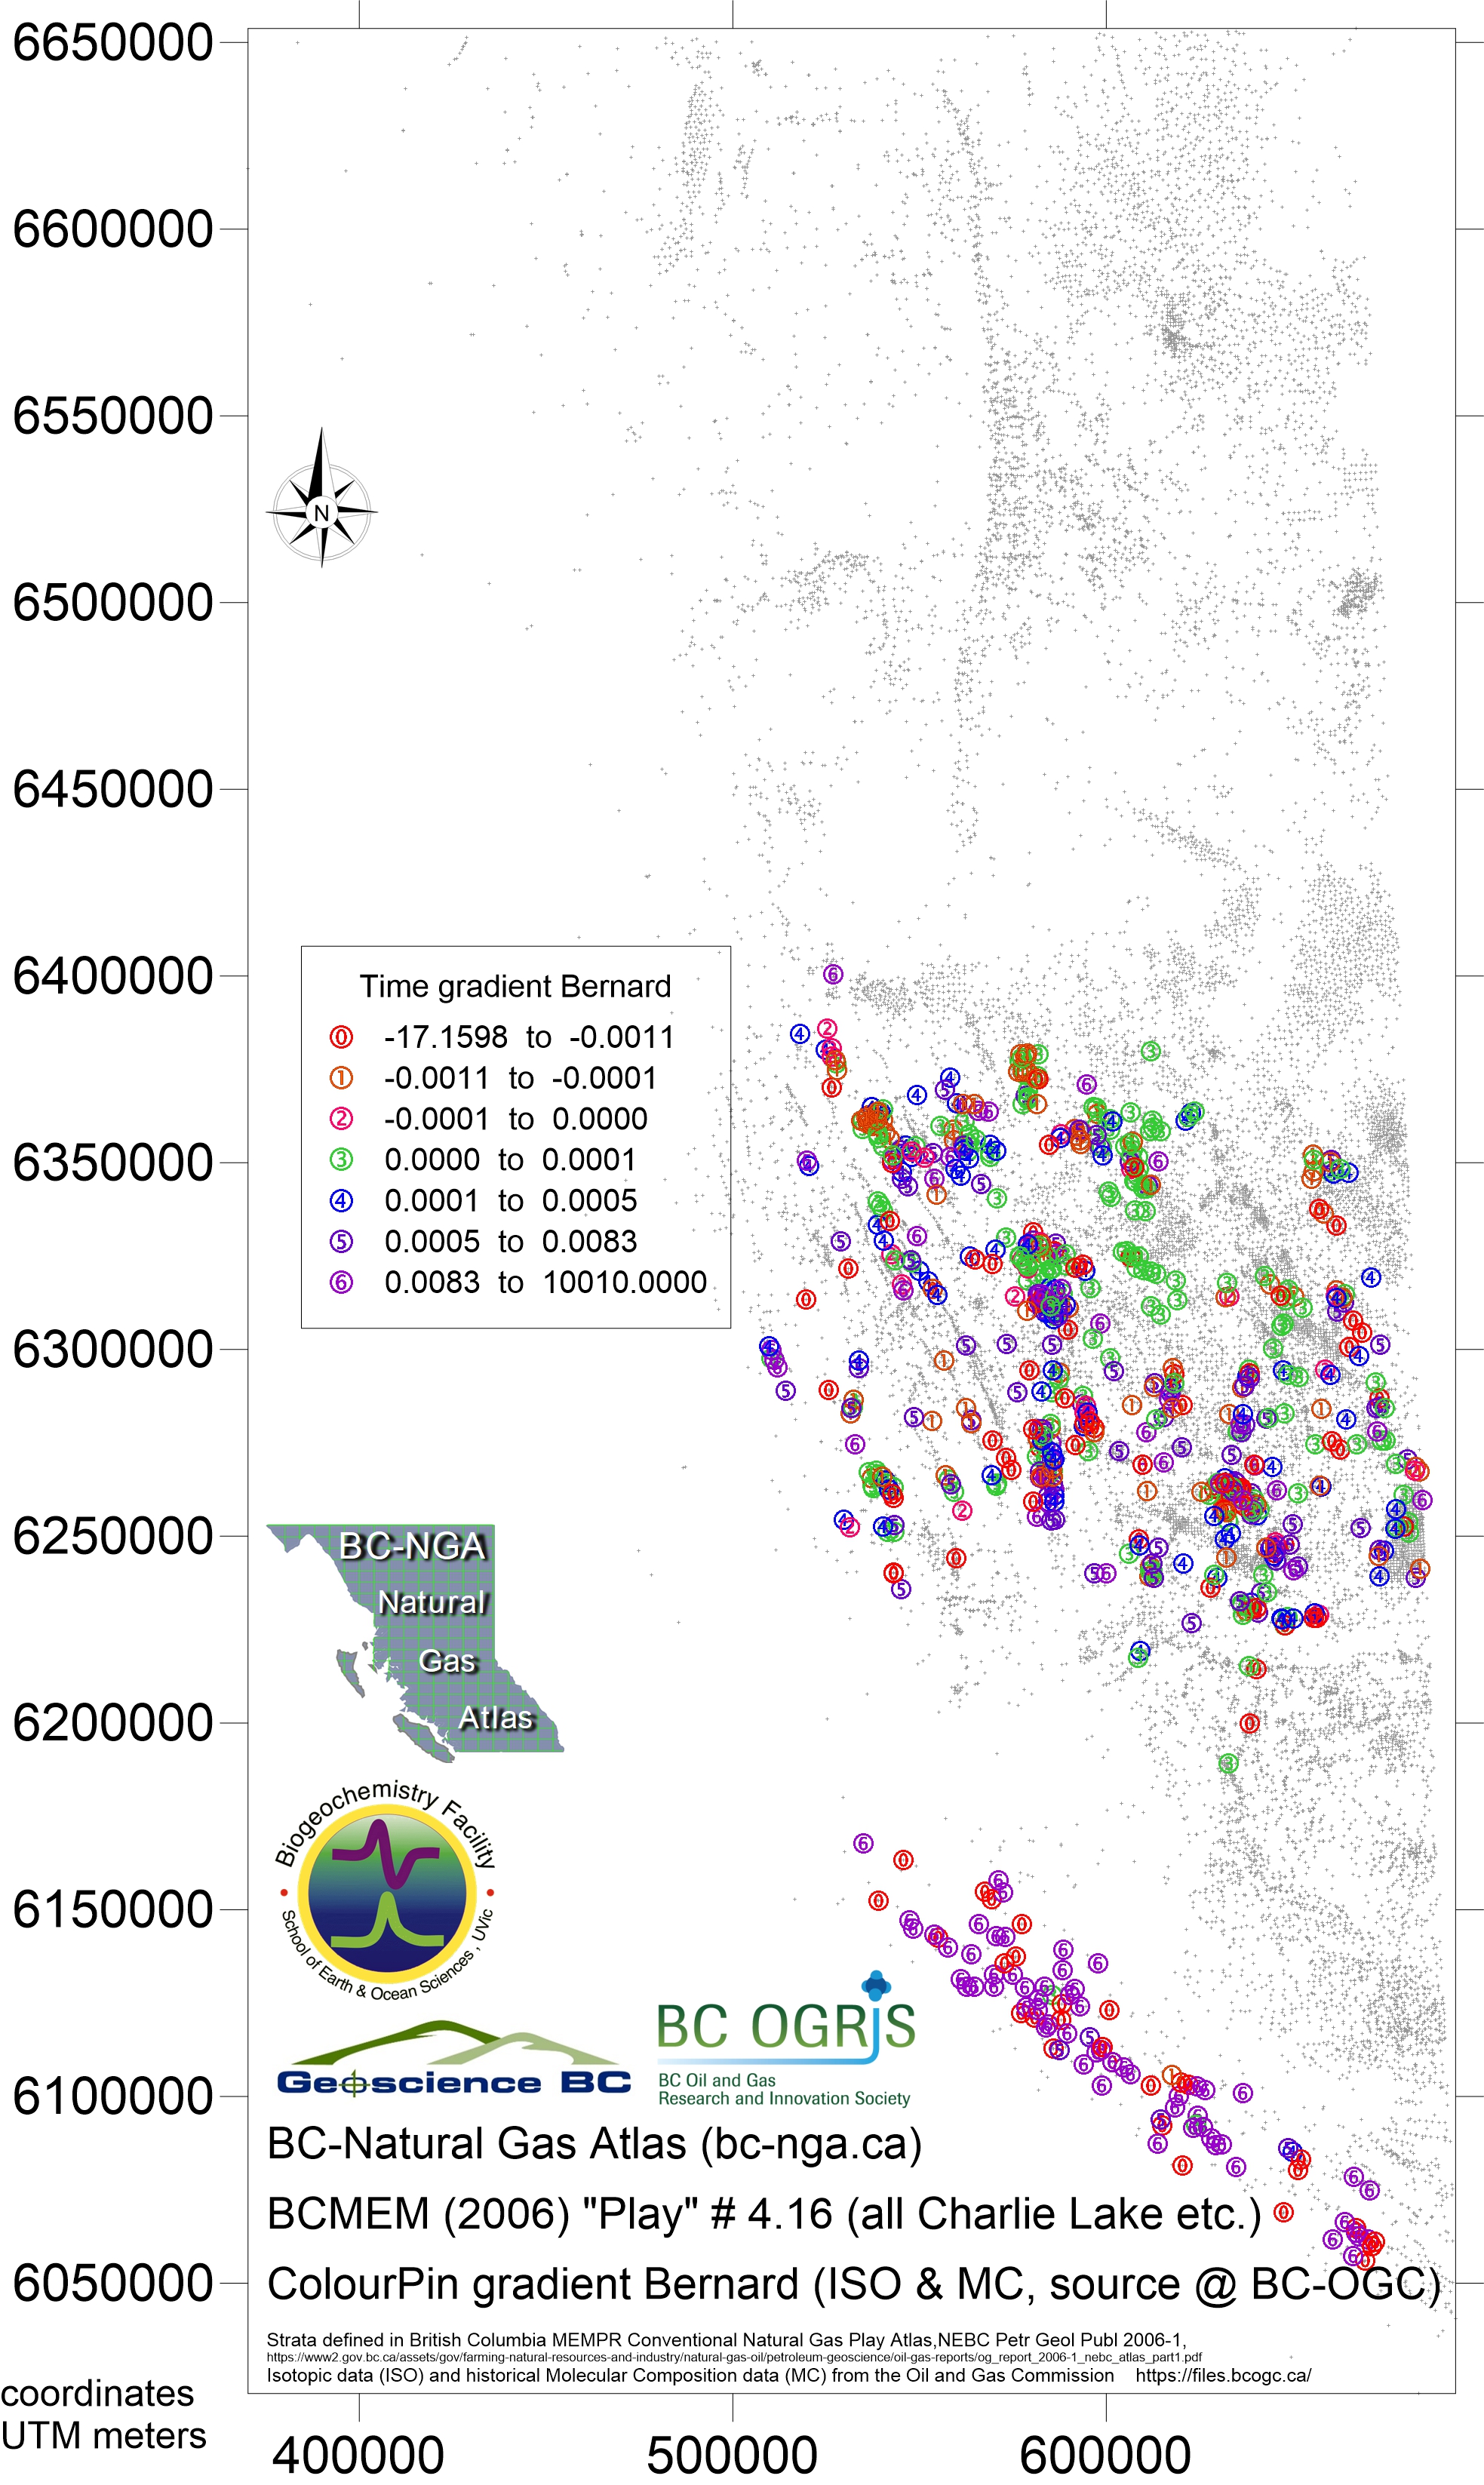
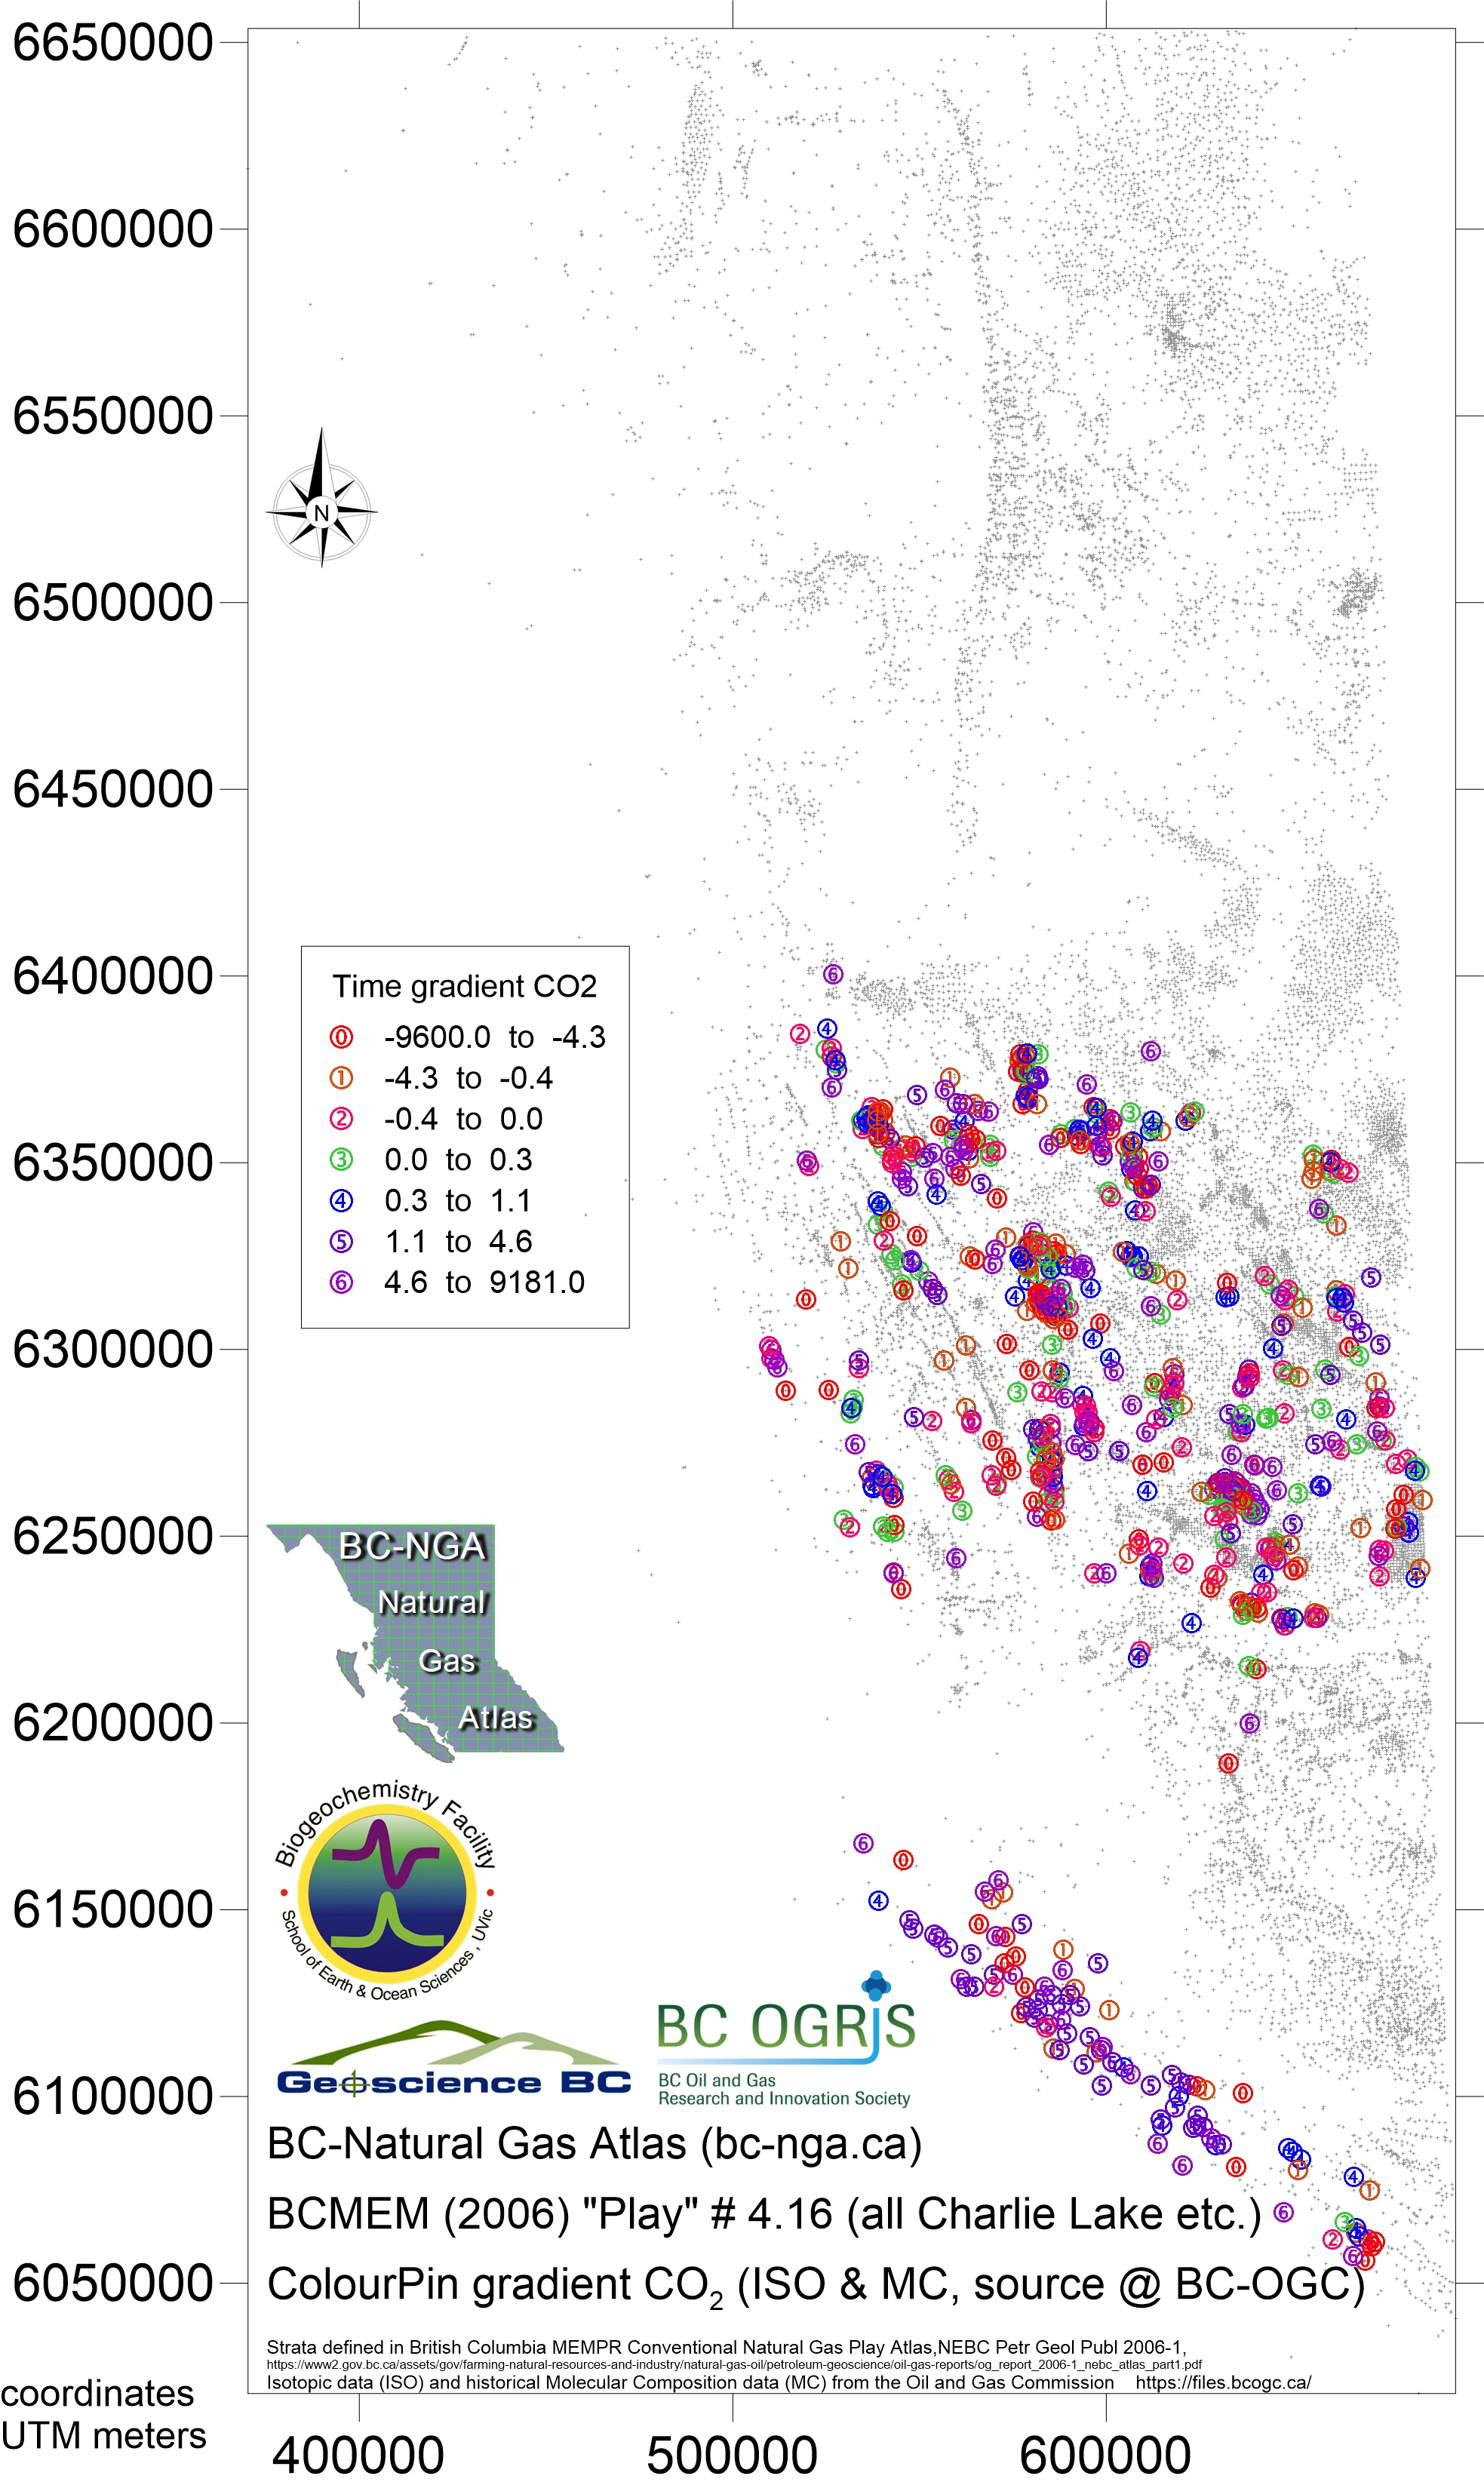
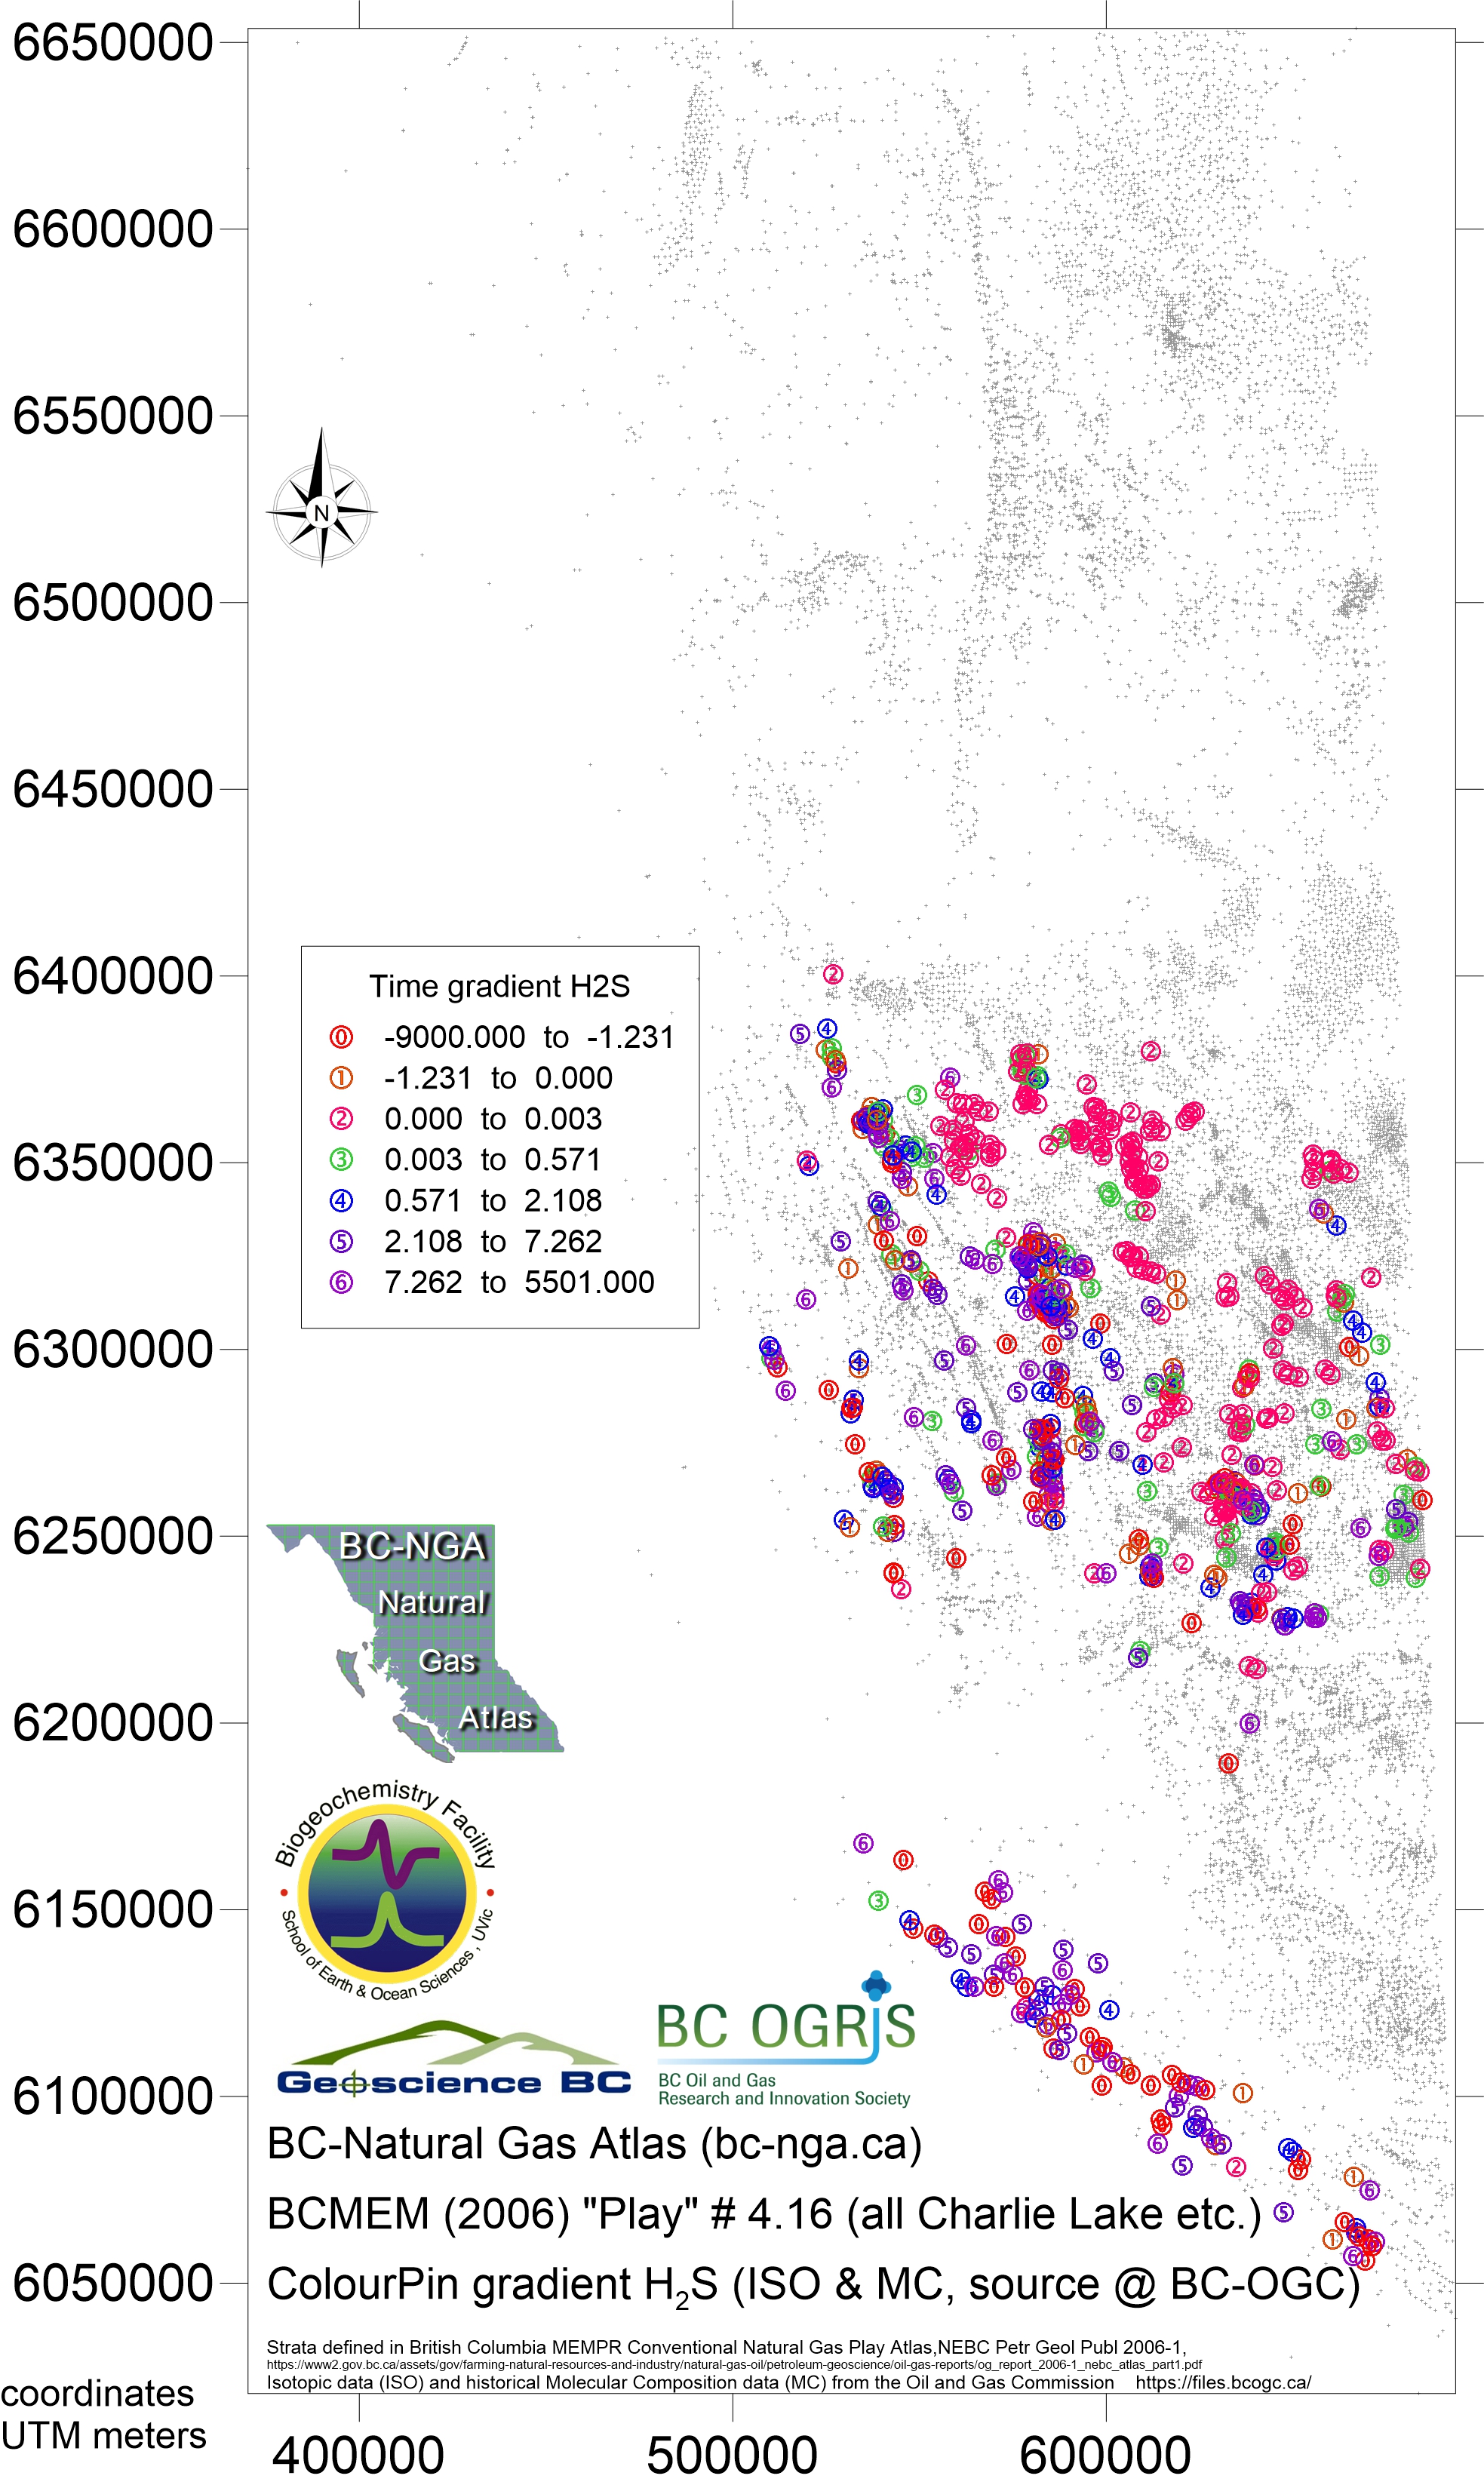
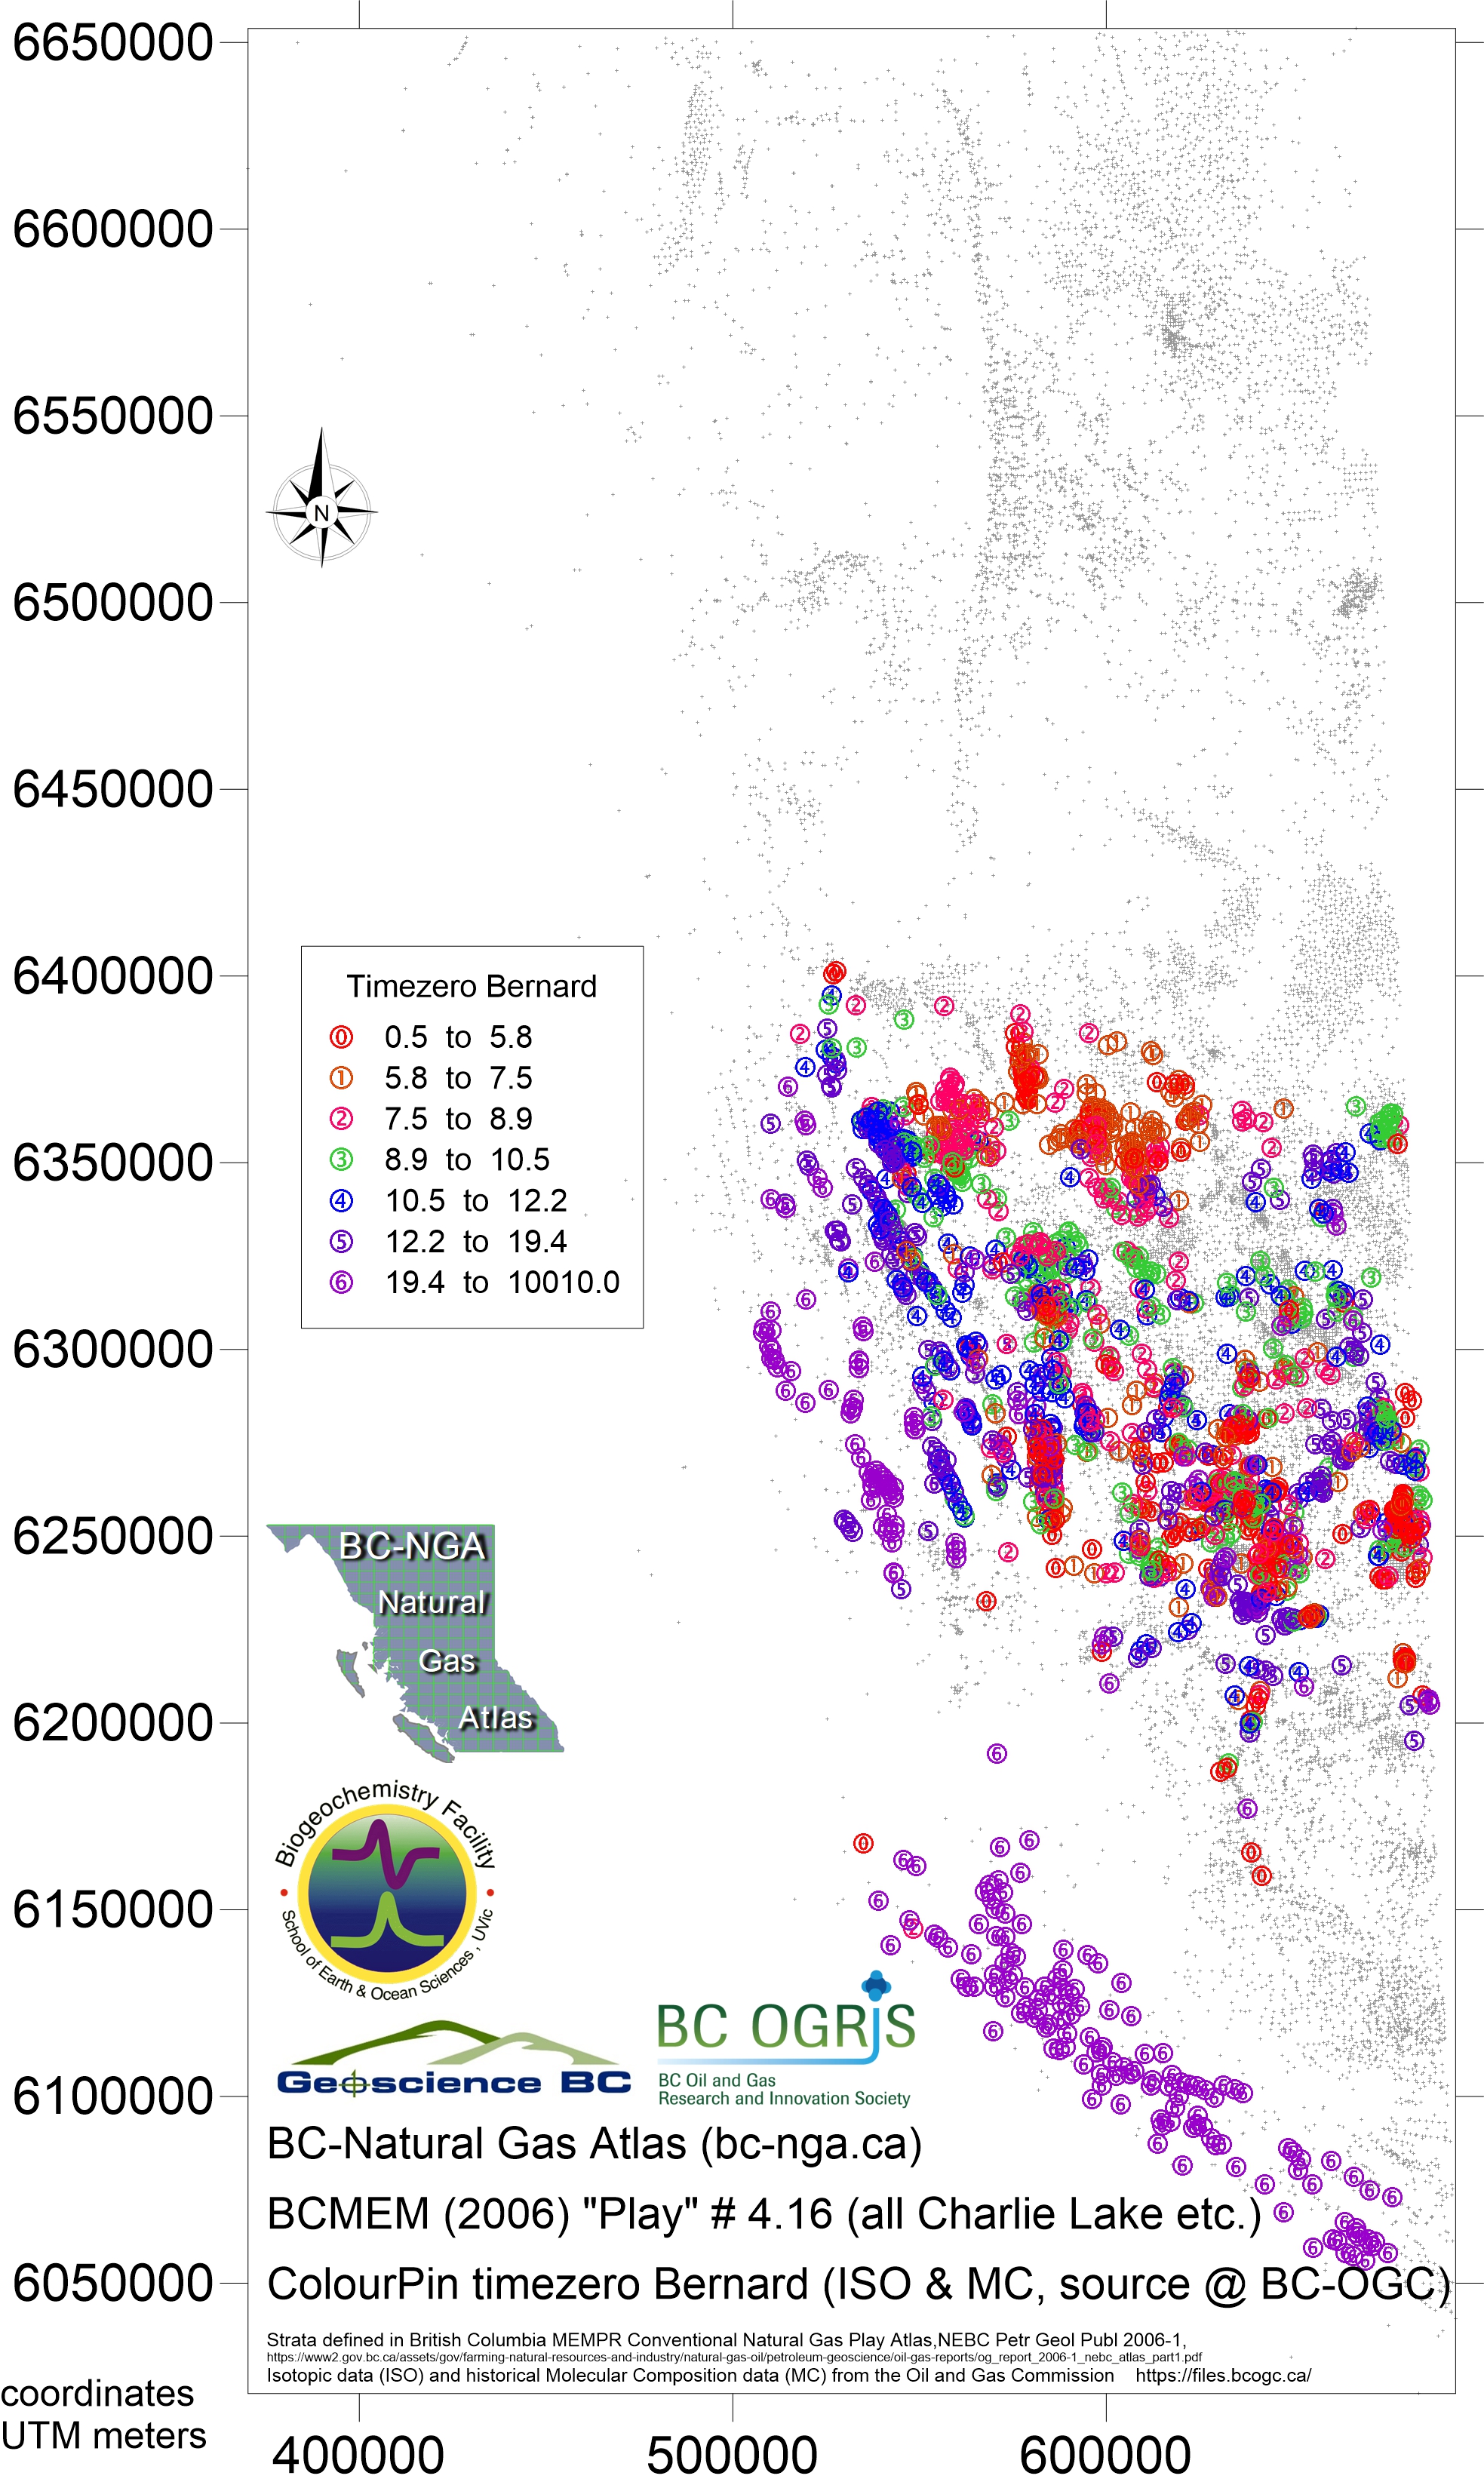
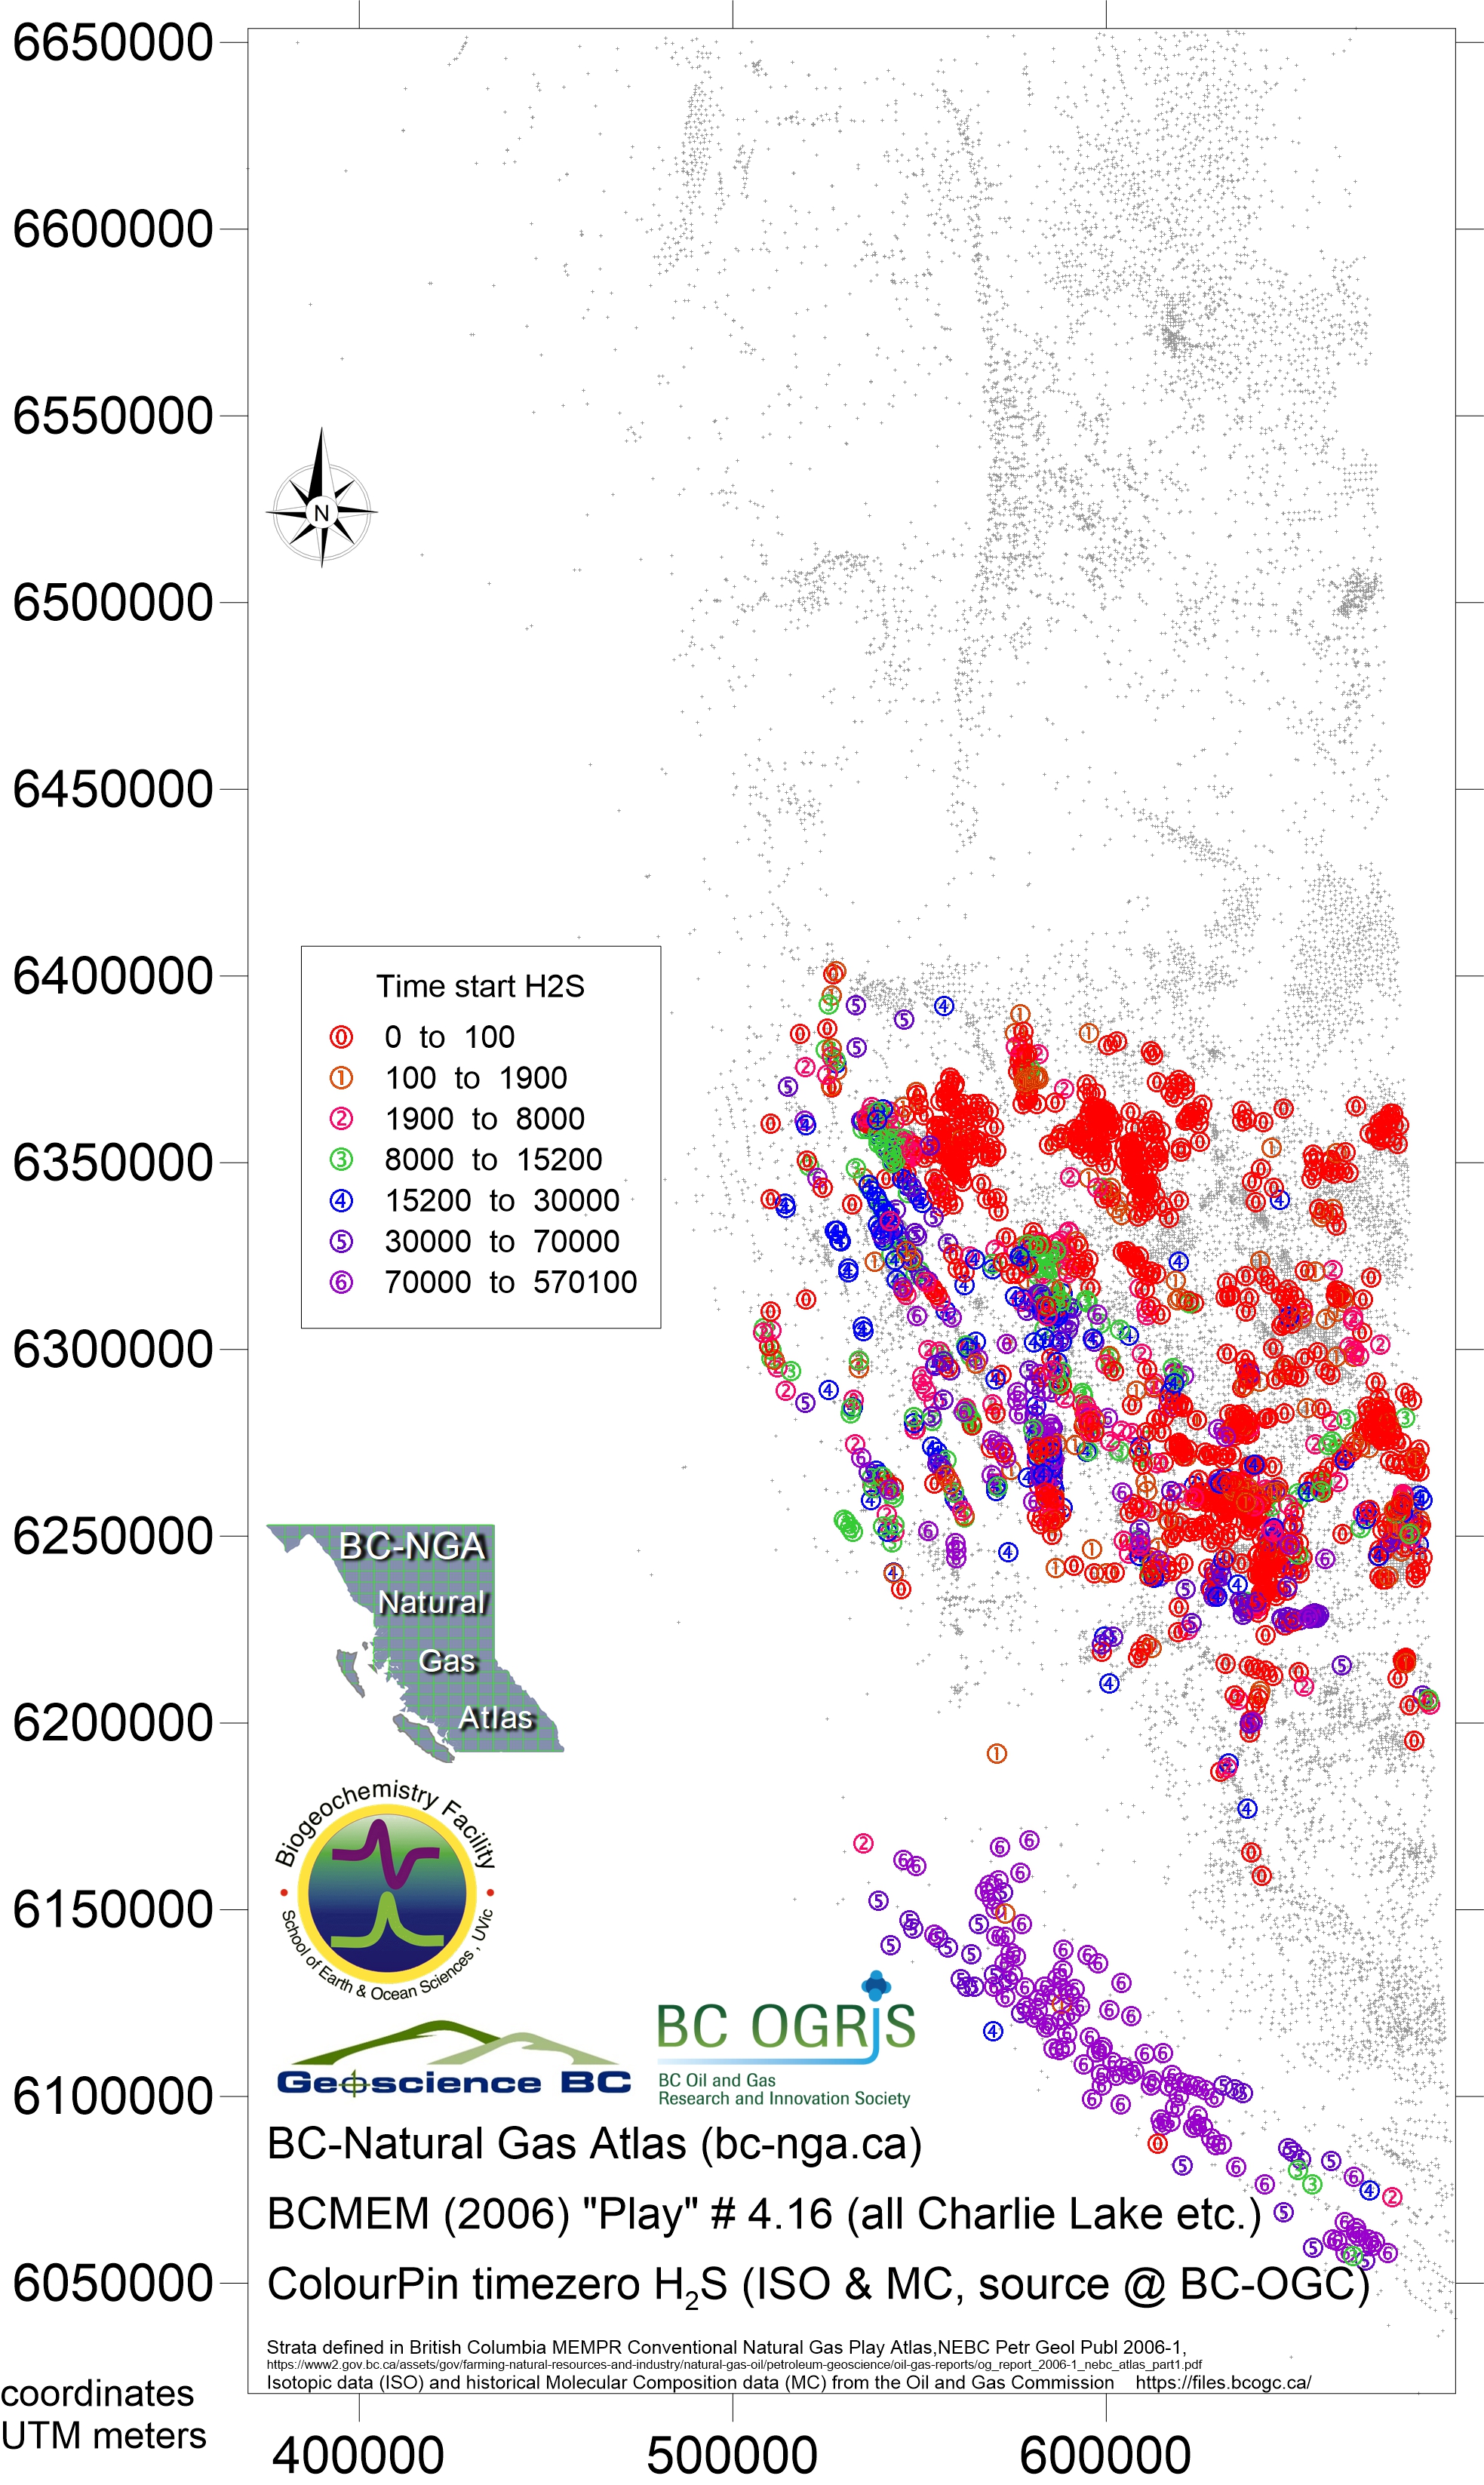
Play 4.16 Pardonet / Baldonnel / Charlie Lake Formations and equivalents
(many members grouped together)
- Map130 Nov 2018 play 4.16 Charlie/Baldonnel eqv Bernard ratio
- Map131 Nov 2018 play 4.16 Charlie/Baldonnel eqv dryness ratio
- Map132 Nov 2018 play 4.16 Charlie/Baldonnel eqv iC4nC4 ratio
- Map133 Nov 2018 play 4.16 Charlie/Baldonnel eqv ISO ratio
- Map134 Nov 2018 play 4.16 Charlie/Baldonnel eqv H2S ppm
- Map135 Nov 2018 play 4.16 Charlie/Baldonnel eqv CH4 ppm
- Map136 Nov 2018 play 4.16 Charlie/Baldonnel eqv C2H6 ppm
- Map137 Nov 2018 play 4.16 Charlie/Baldonnel eqv C3H8 ppm
- Map138 Nov 2018 play 4.16 Charlie/Baldonnel eqv iC4H10 ppm
- Map139 Nov 2018 play 4.16 Charlie/Baldonnel eqv nC4H10 ppm
- Map140 Nov 2018 play 4.16 Charlie/Baldonnel eqv iC5H12 ppm
- Map141 Nov 2018 play 4.16 Charlie/Baldonnel eqv nC5H12 ppm
- Map142 Nov 2018 play 4.16 Charlie/Baldonnel eqv C6H14 plus ppm
- Map143 Nov 2018 play 4.16 Charlie/Baldonnel eqv CO2 ppm
- Map144 Nov 2018 play 4.16 Charlie/Baldonnel eqv δ13CH4
- Map145 Nov 2018 play 4.16 Charlie/Baldonnel eqv Cδ2H4
- Map146 Nov 2018 play 4.16 Charlie/Baldonnel eqv δ13C2H6
- Map147 Nov 2018 play 4.16 Charlie/Baldonnel eqv δ13C3H8
- Map148 Nov 2018 play 4.16 Charlie/Baldonnel eqv time series gradient Bernard ratio
- Map149 Nov 2018 play 4.16 Charlie/Baldonnel eqv time series gradient CO2
- Map150 Nov 2018 play 4.16 Charlie/Baldonnel eqv time series gradient H2S
- Map151 Nov 2018 play 4.16 Charlie/Baldonnel eqv time series start point Bernard ratio
- Map152 Nov 2018 play 4.16 Charlie/Baldonnel eqv time series start point CO2
- Map153 Nov 2018 play 4.16 Charlie/Baldonnel eqv time series start point H2S
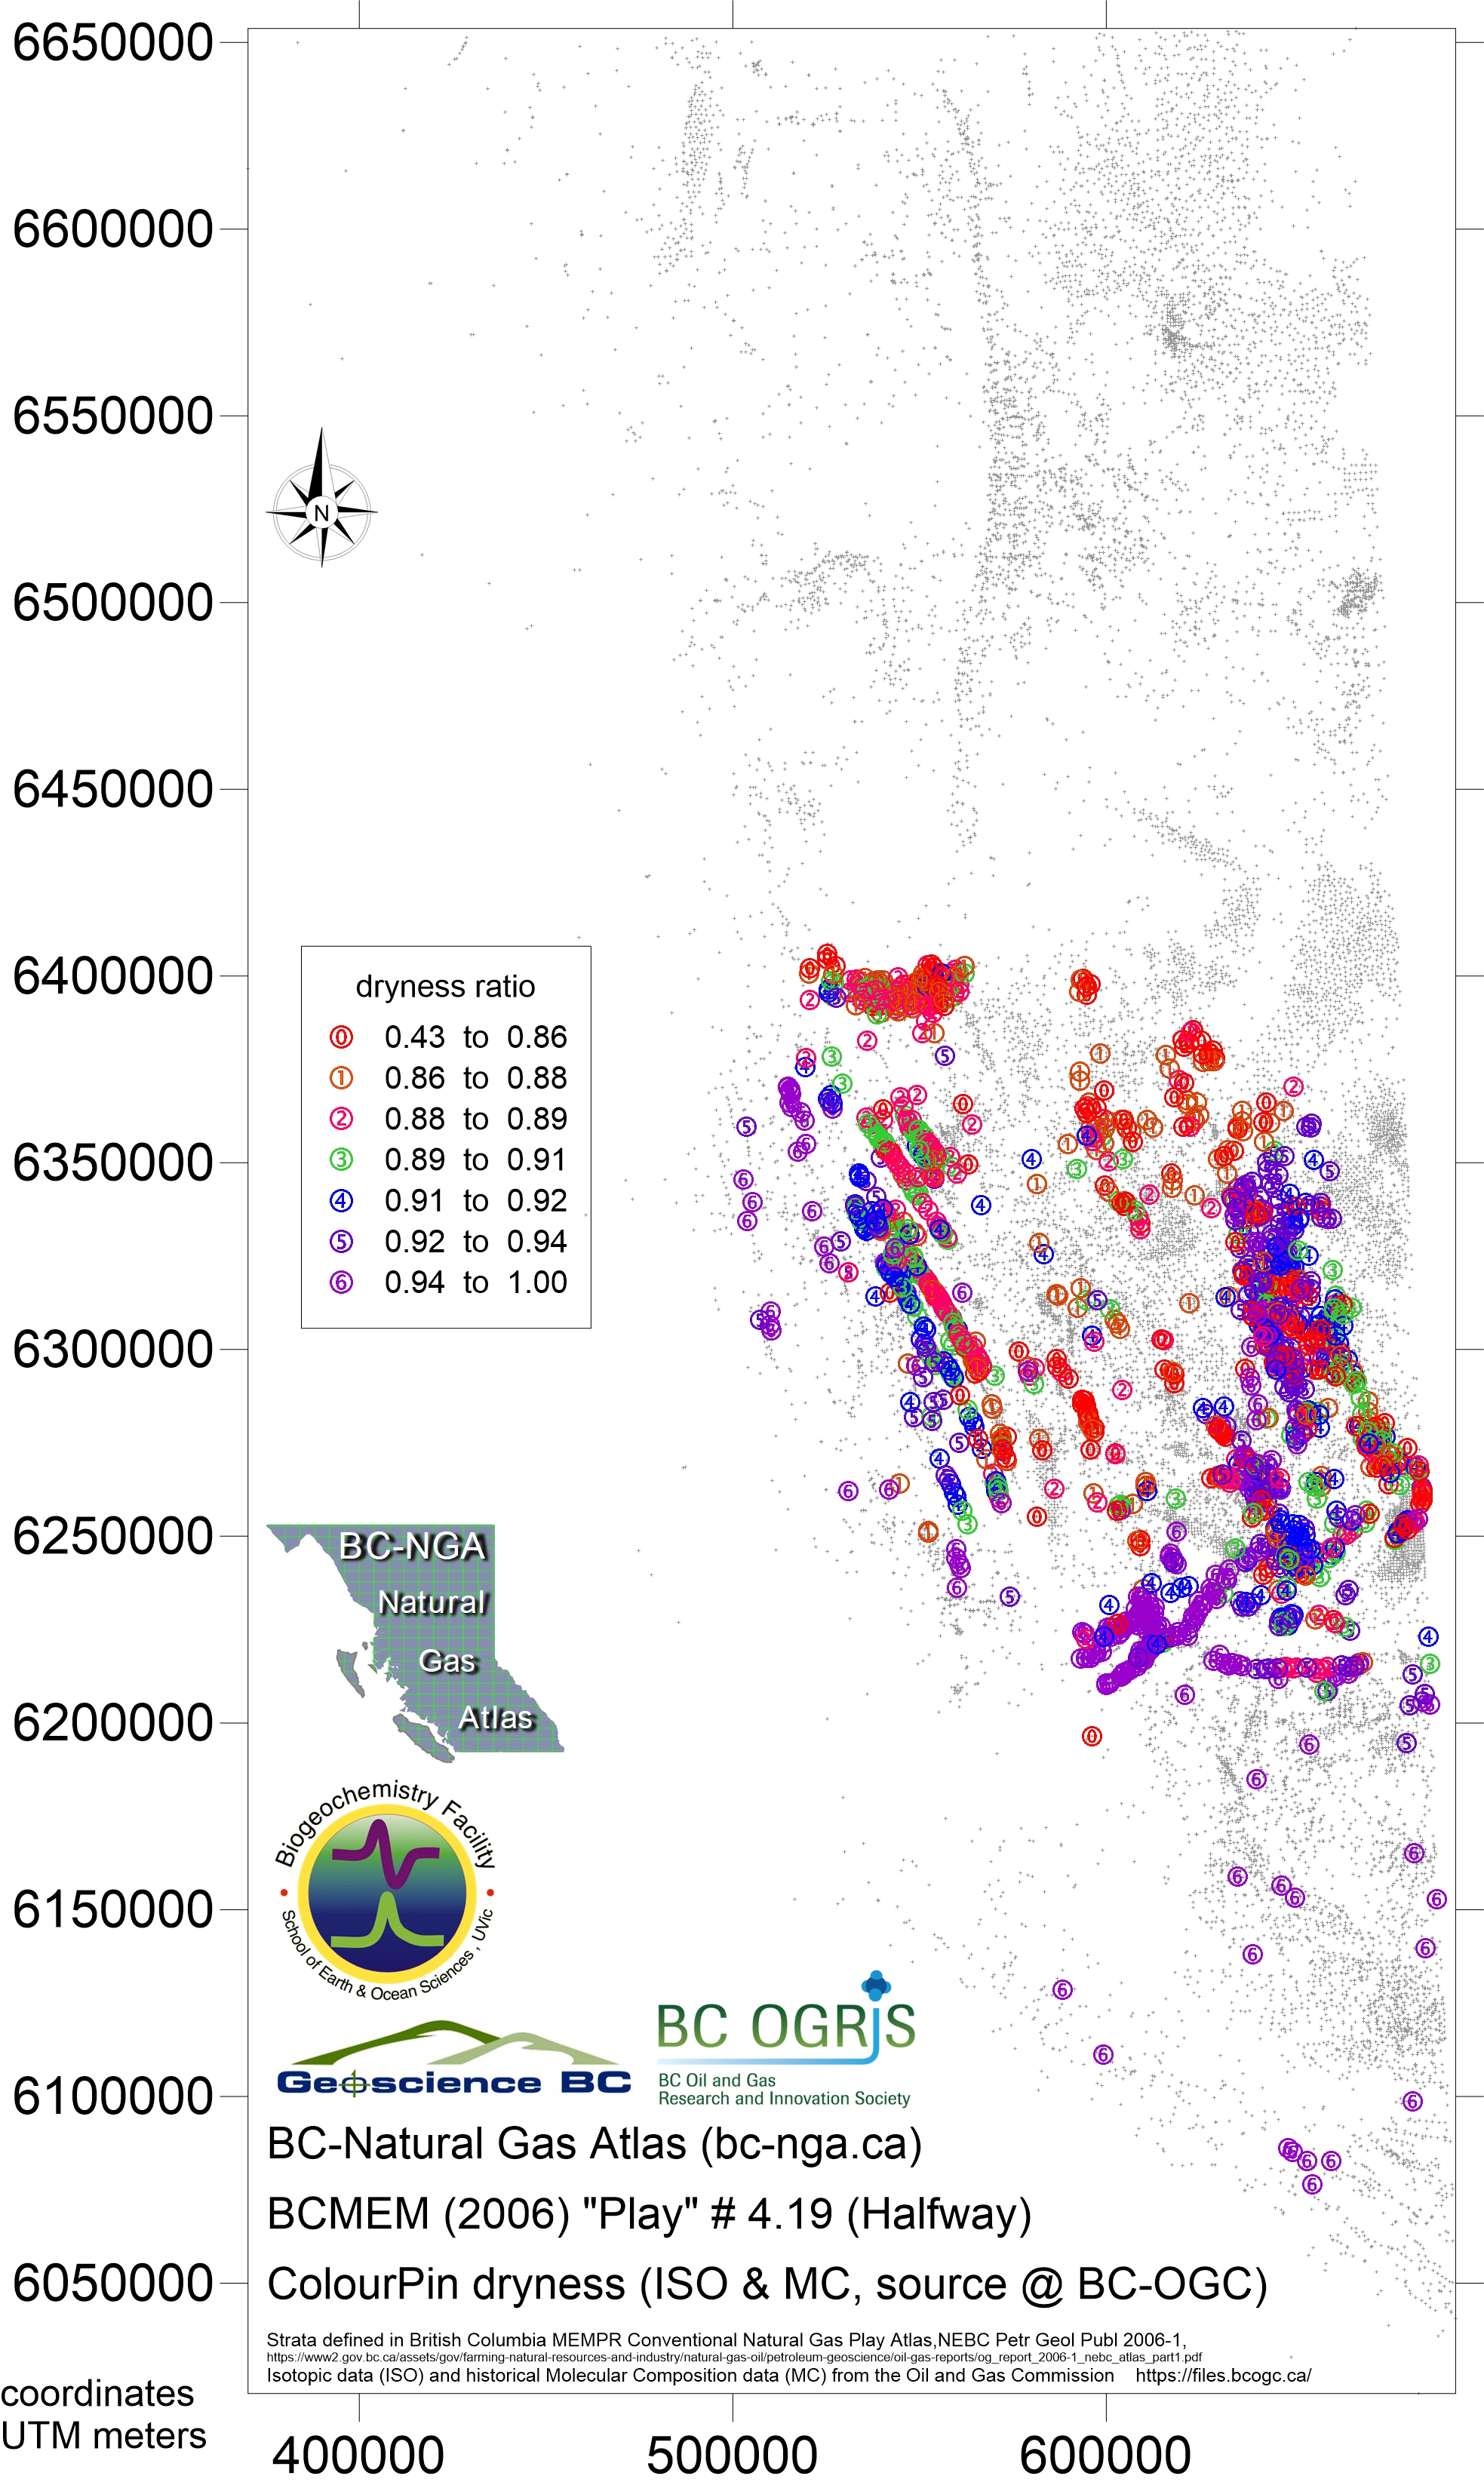
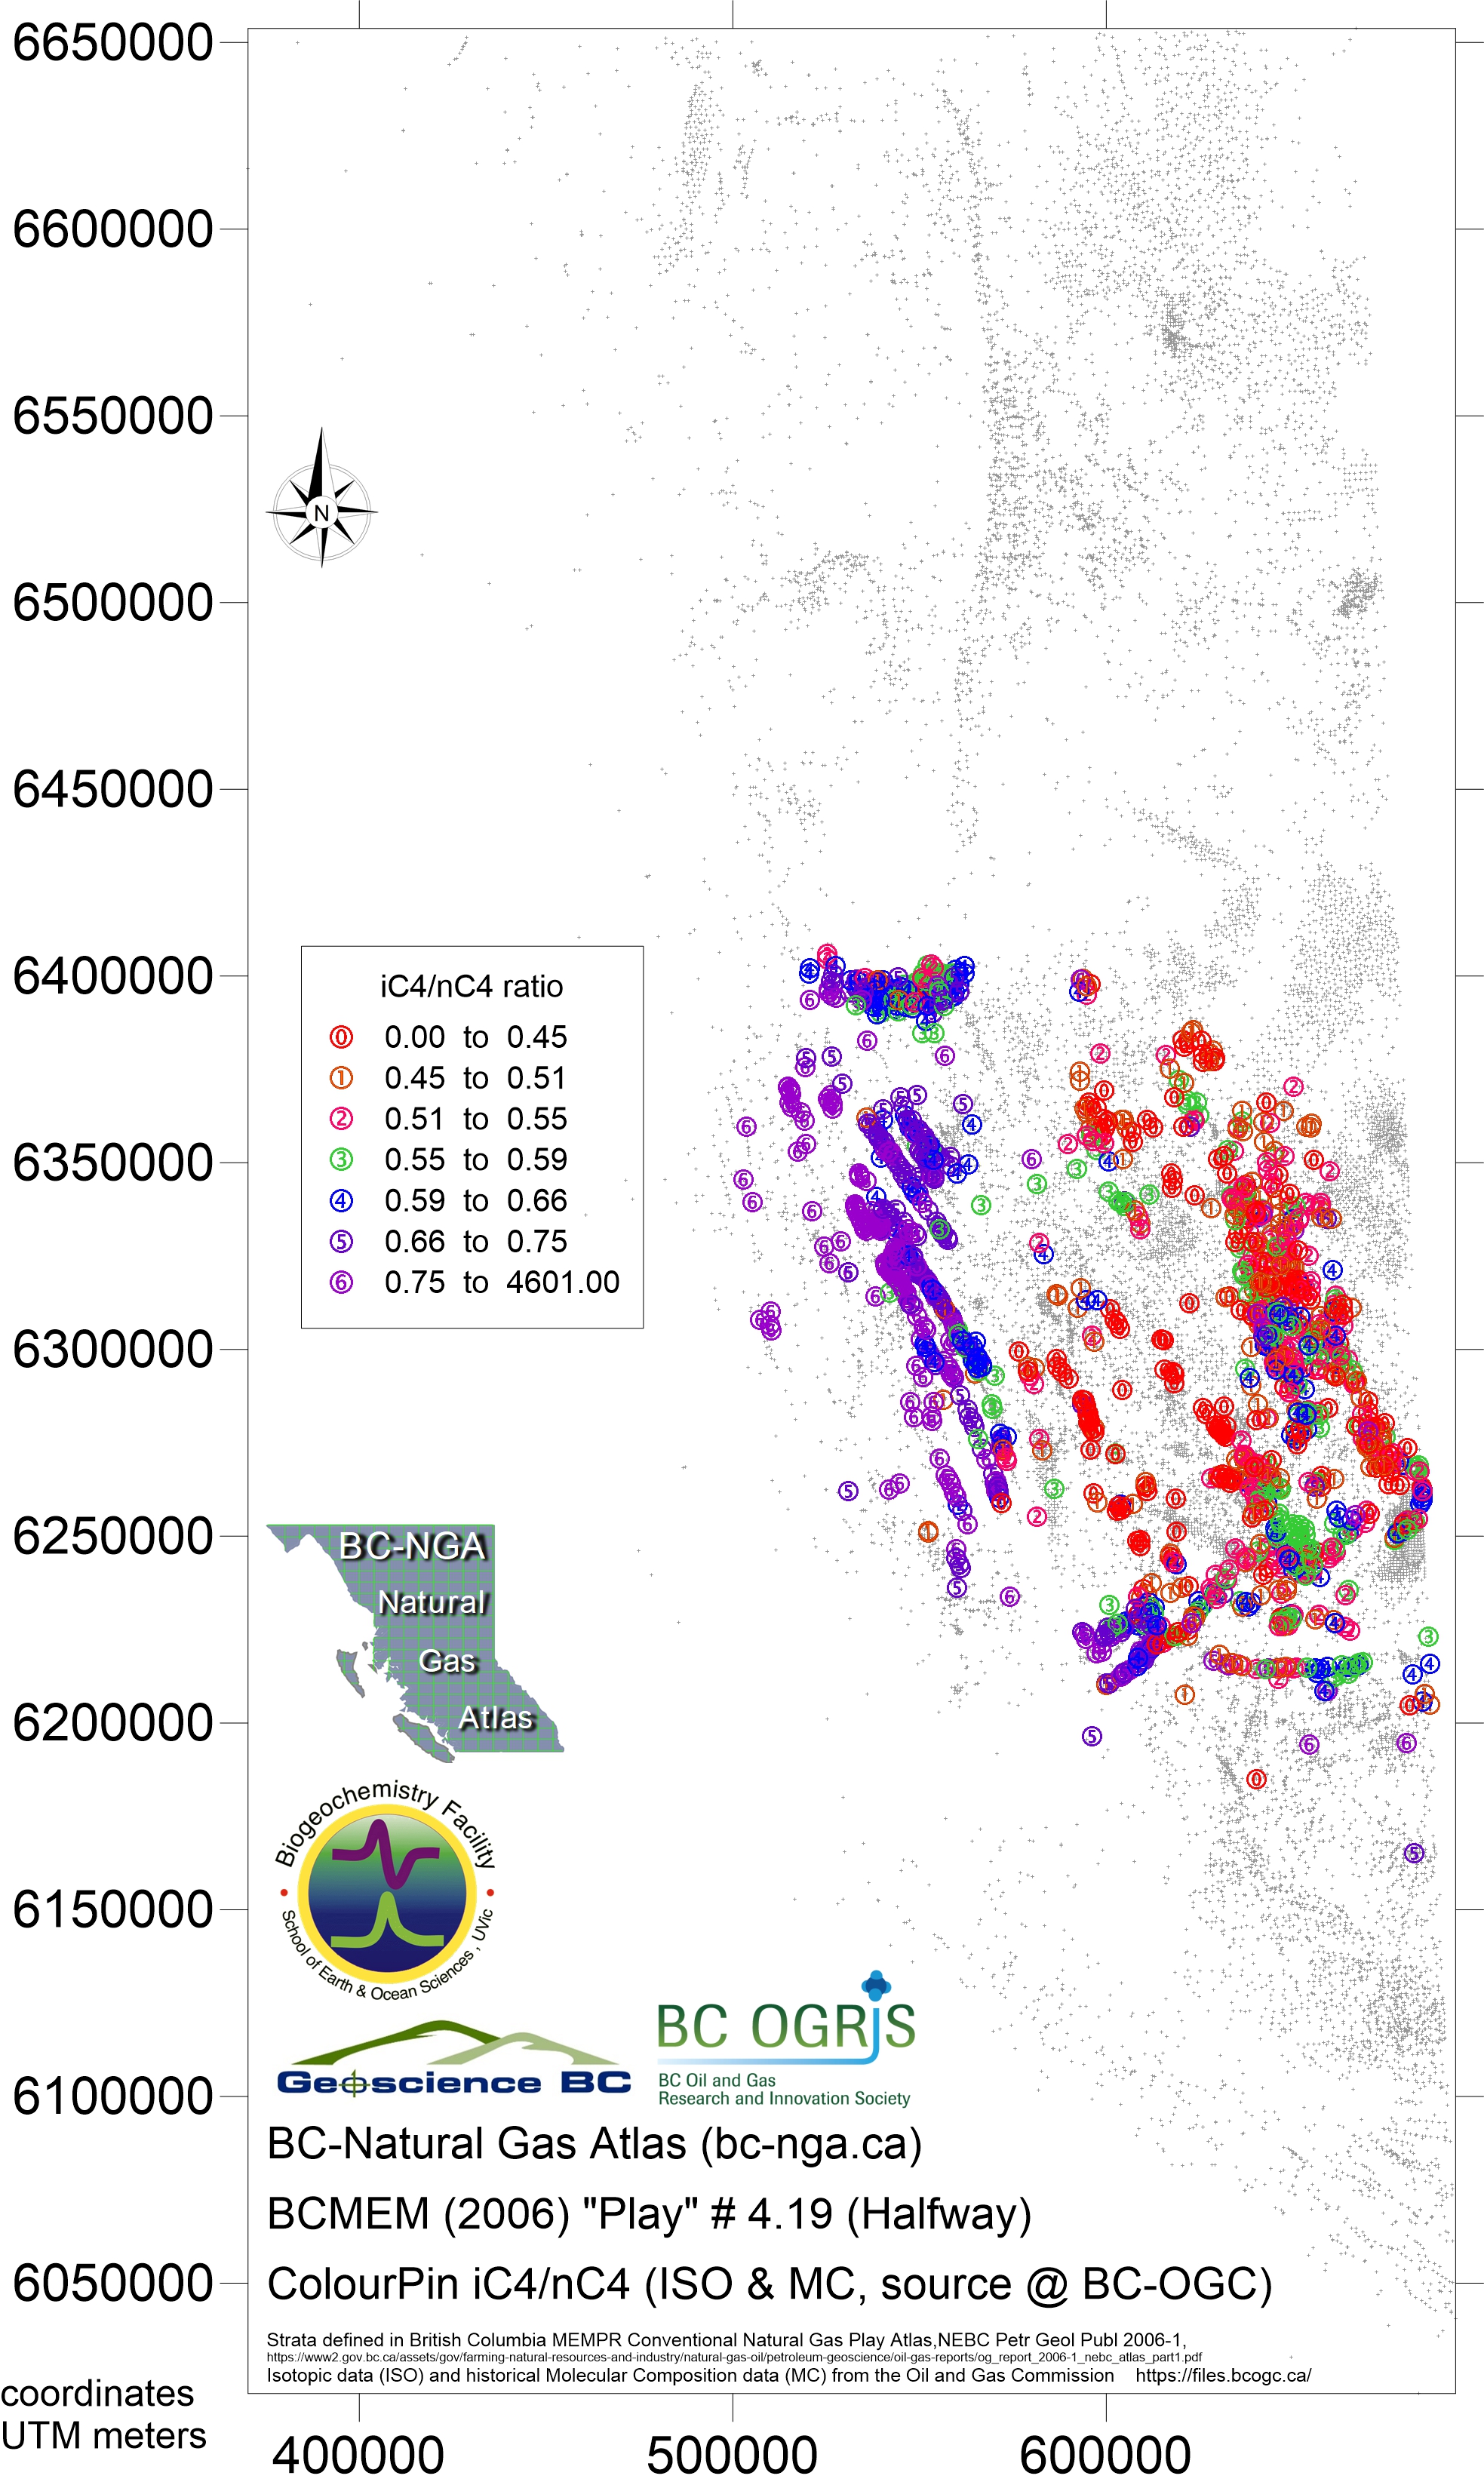
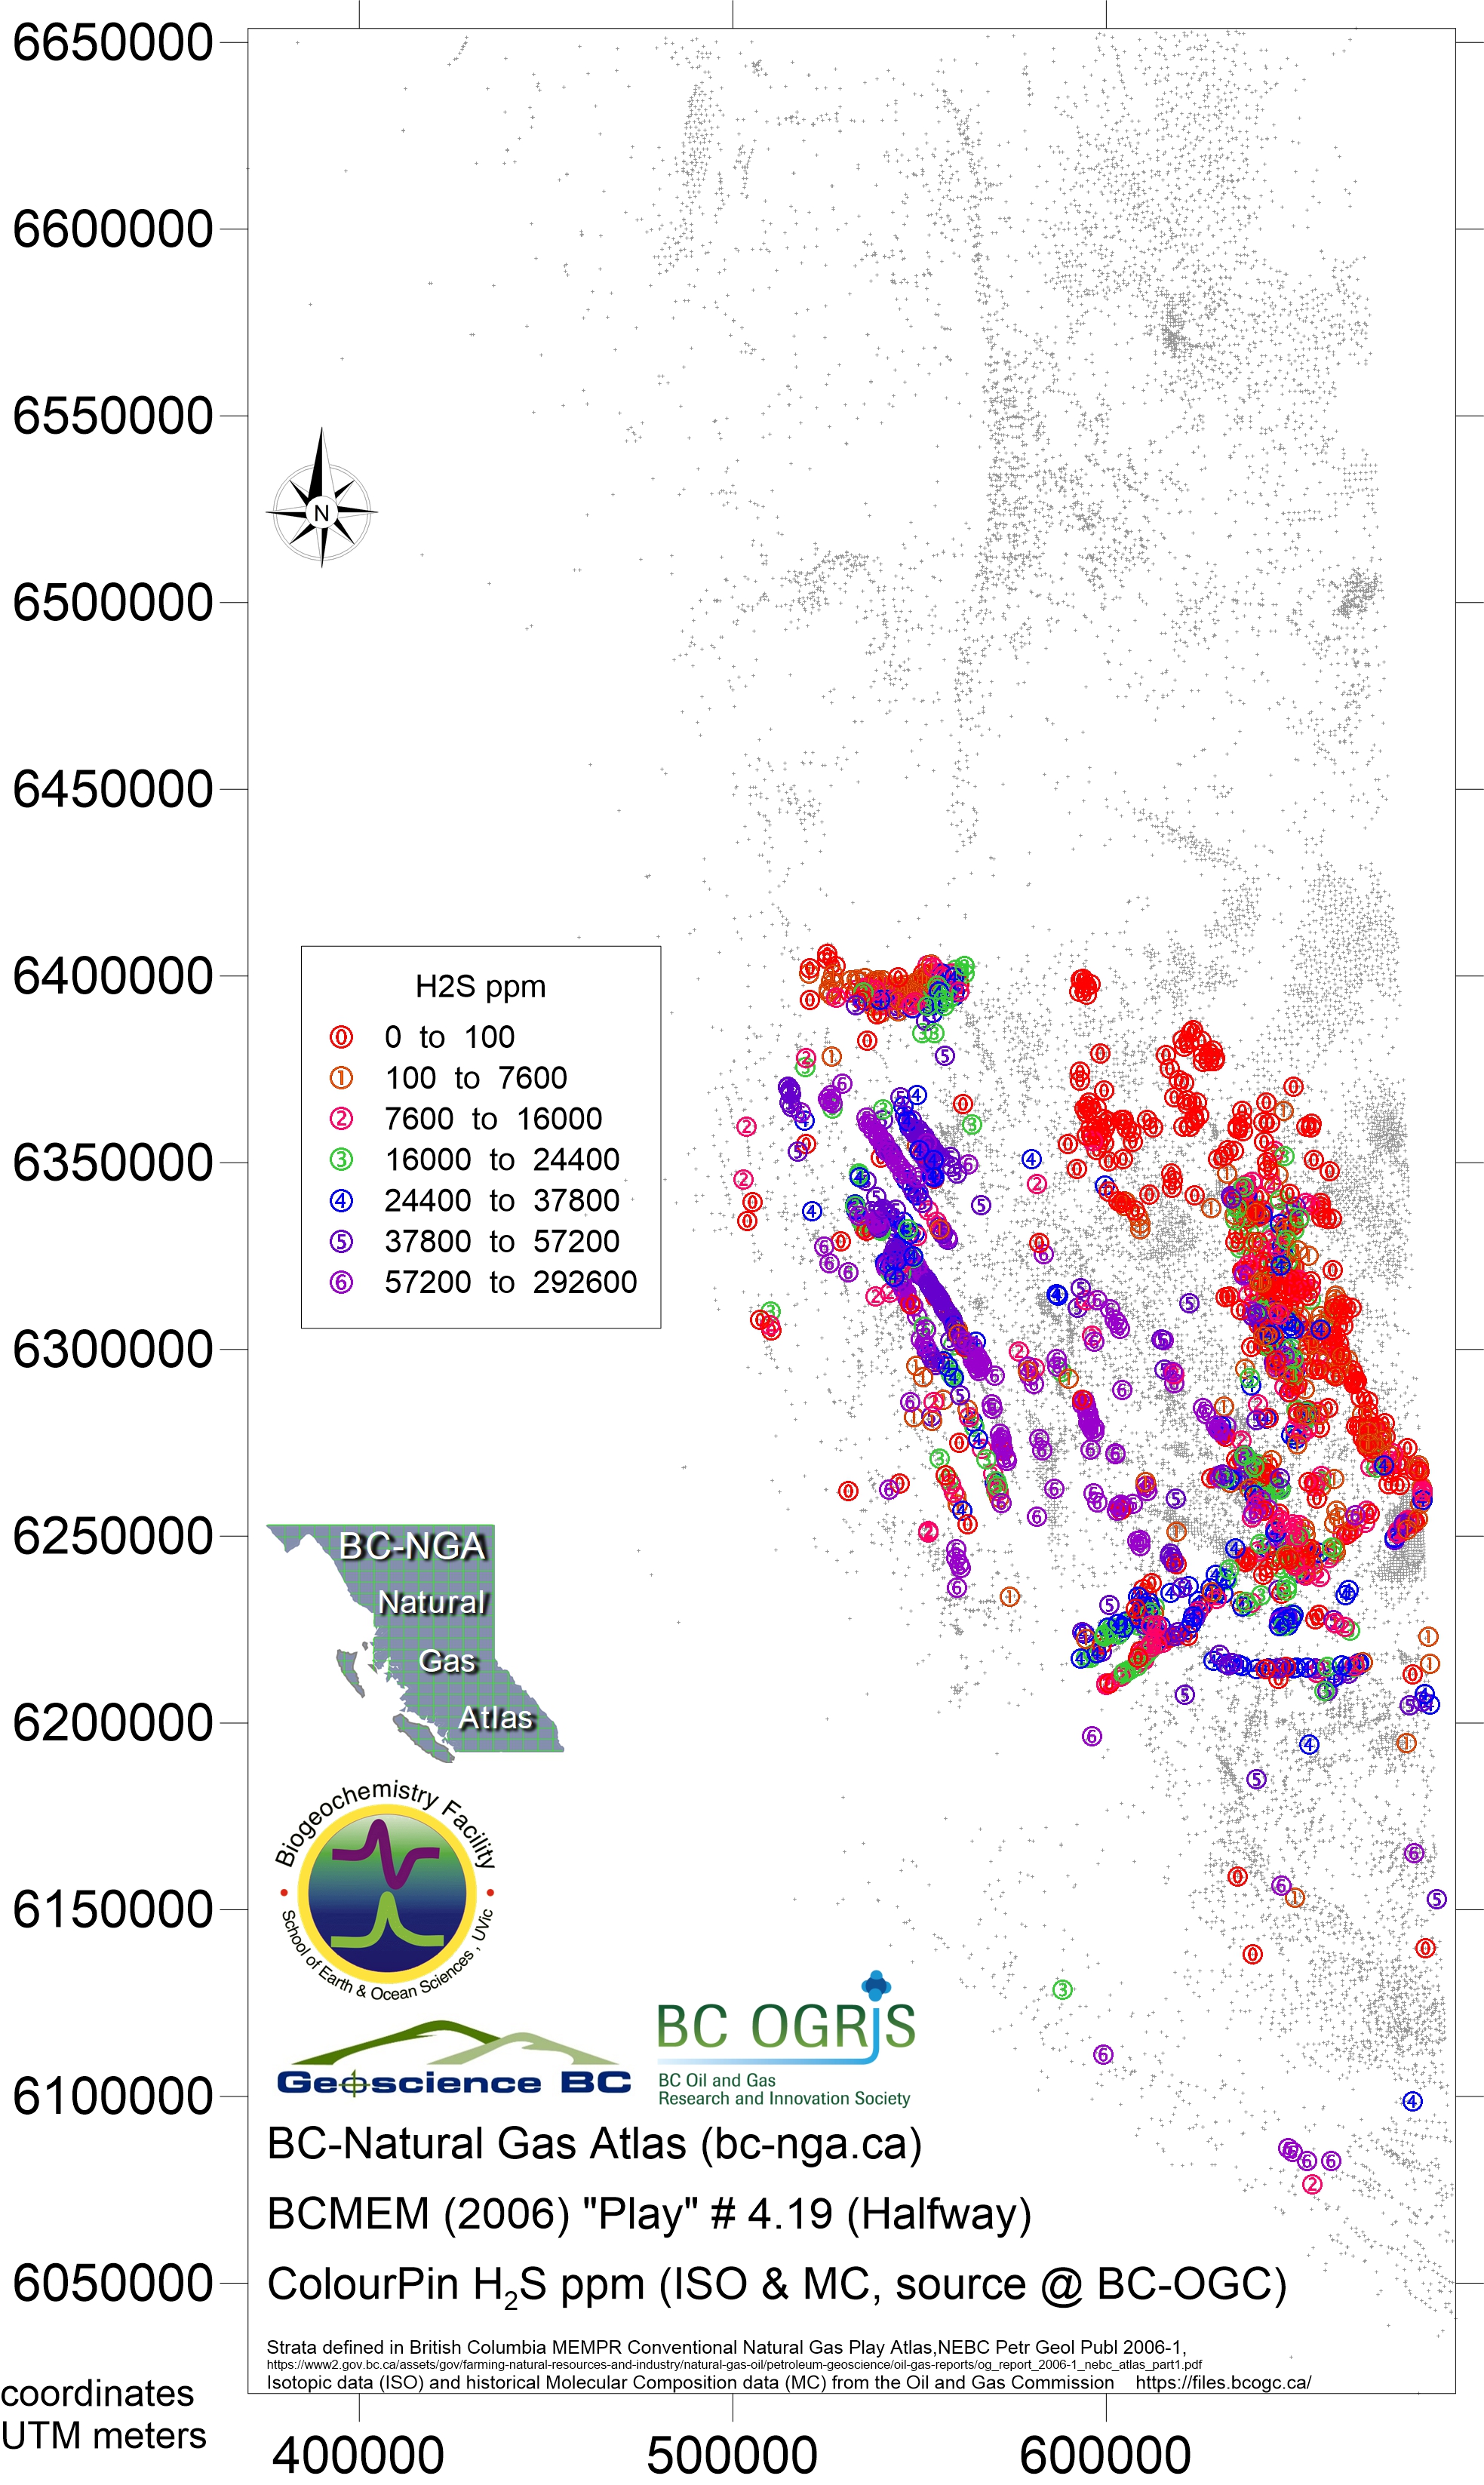
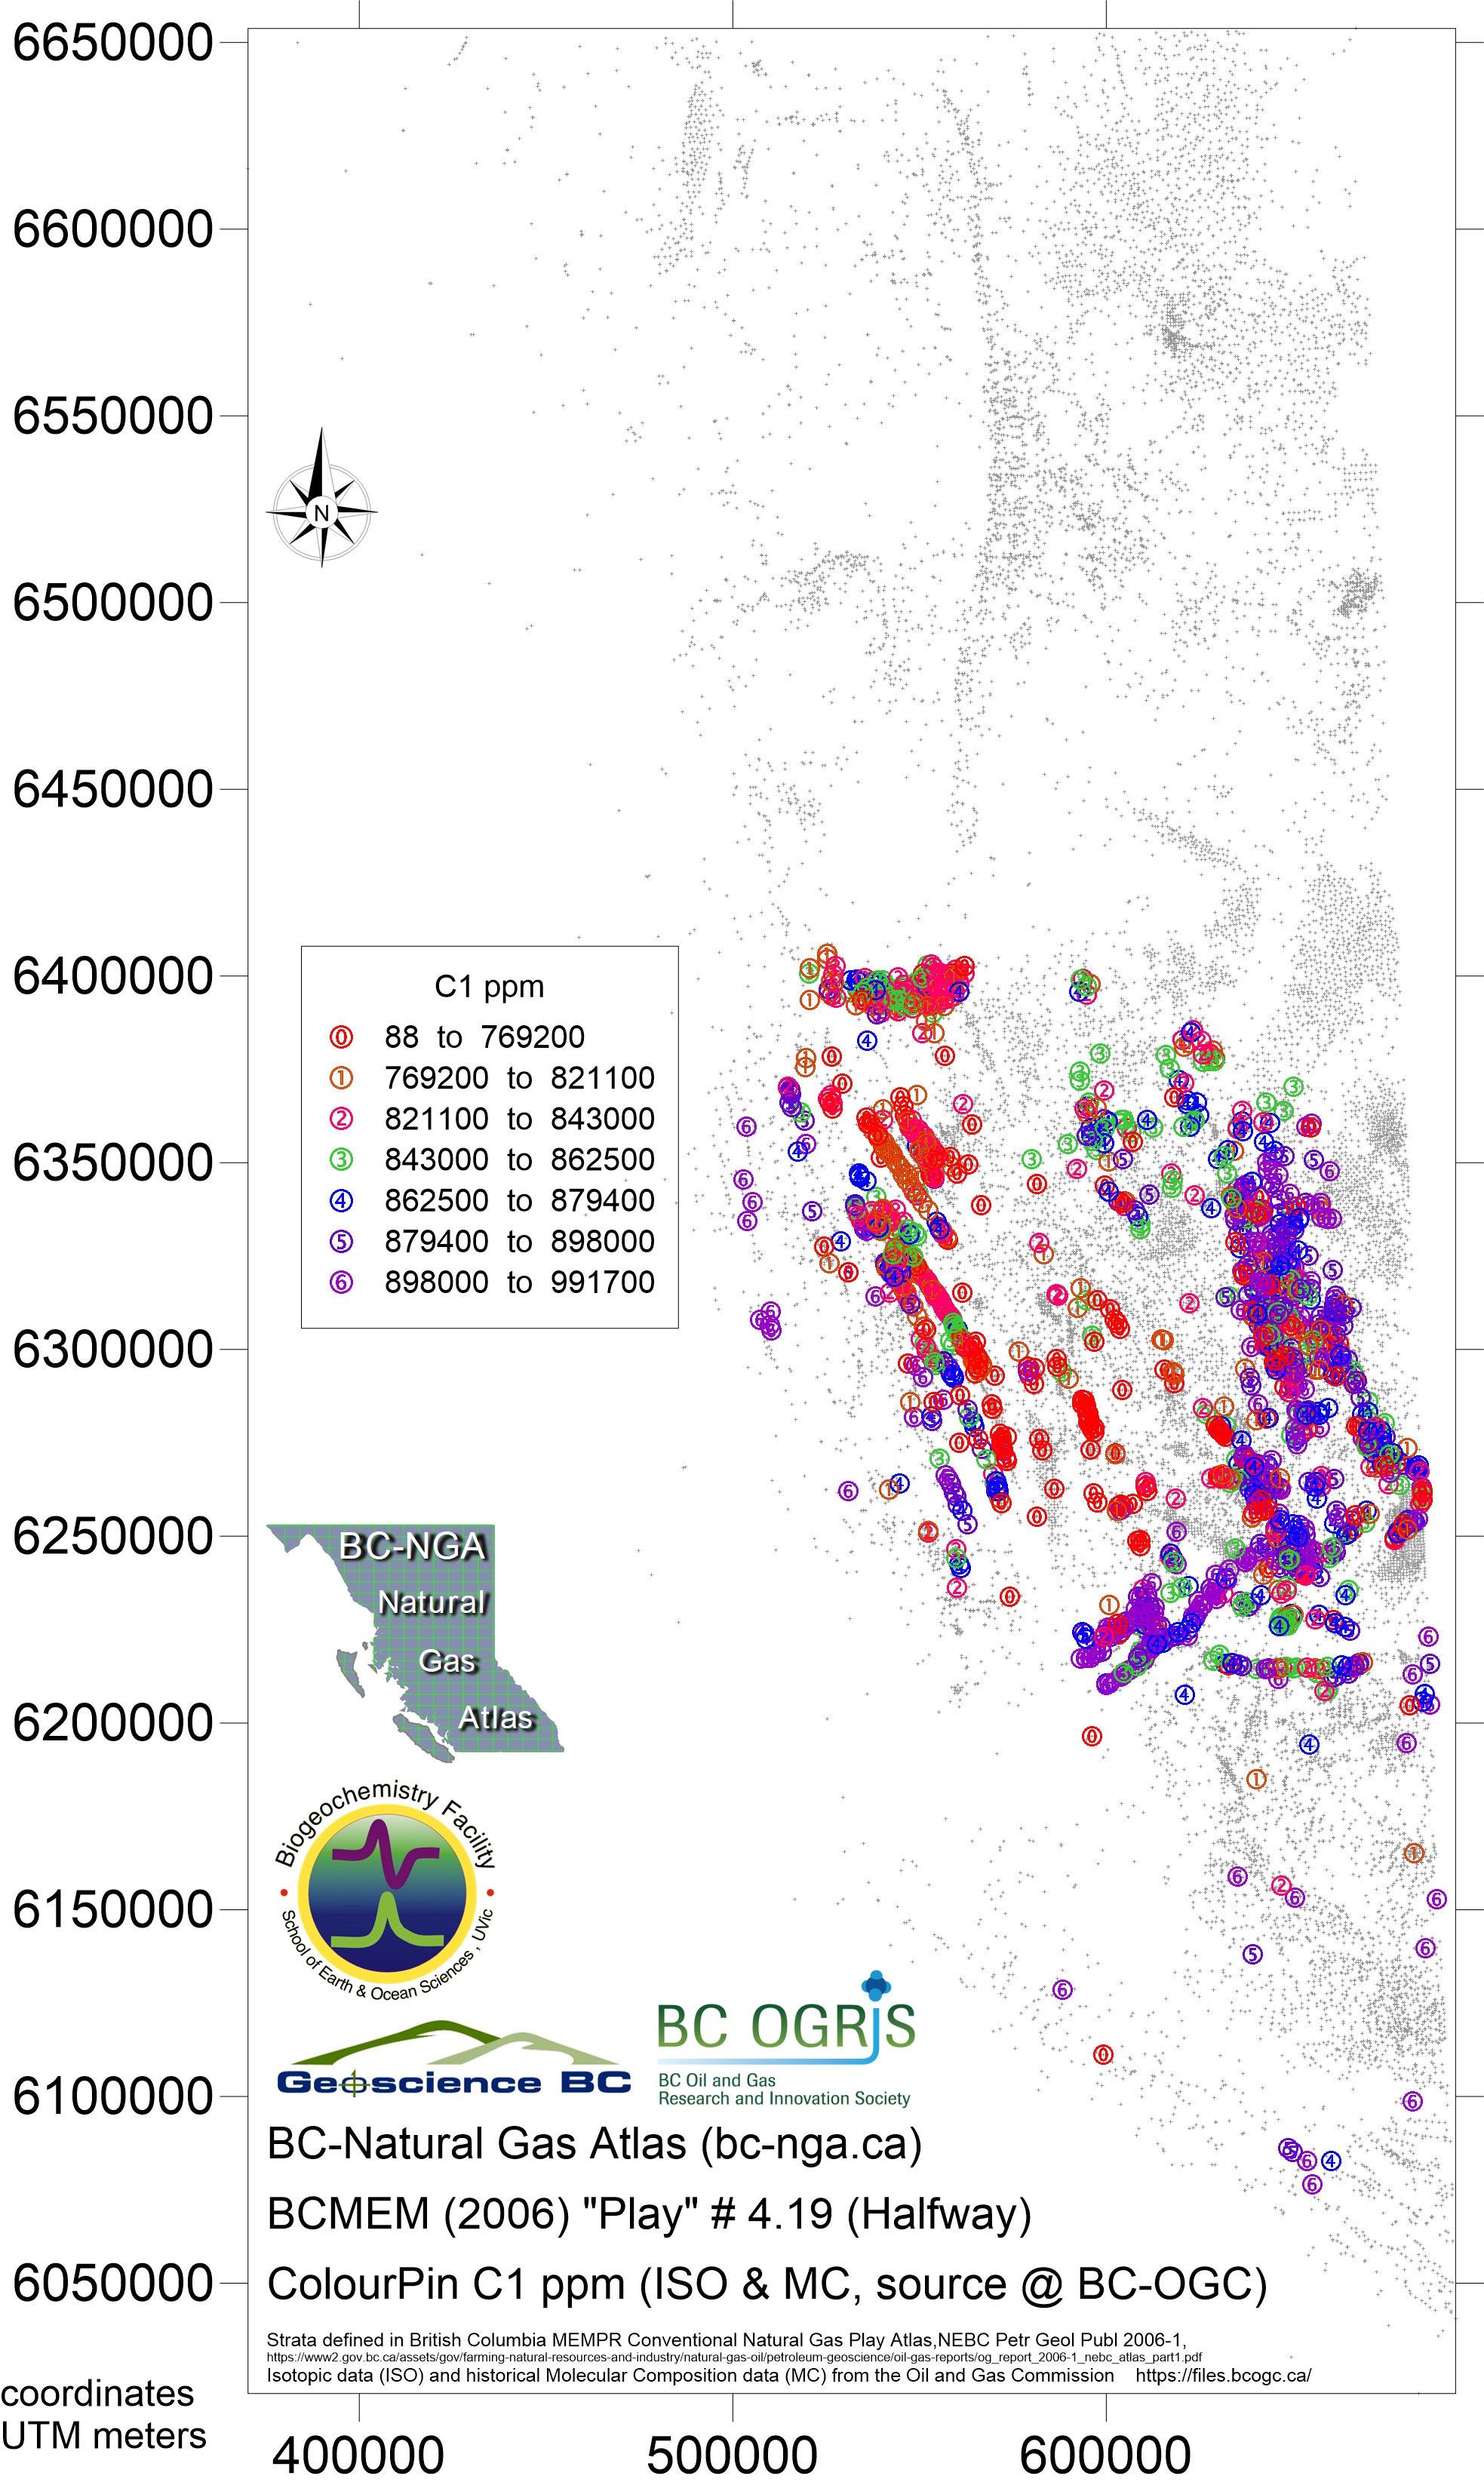
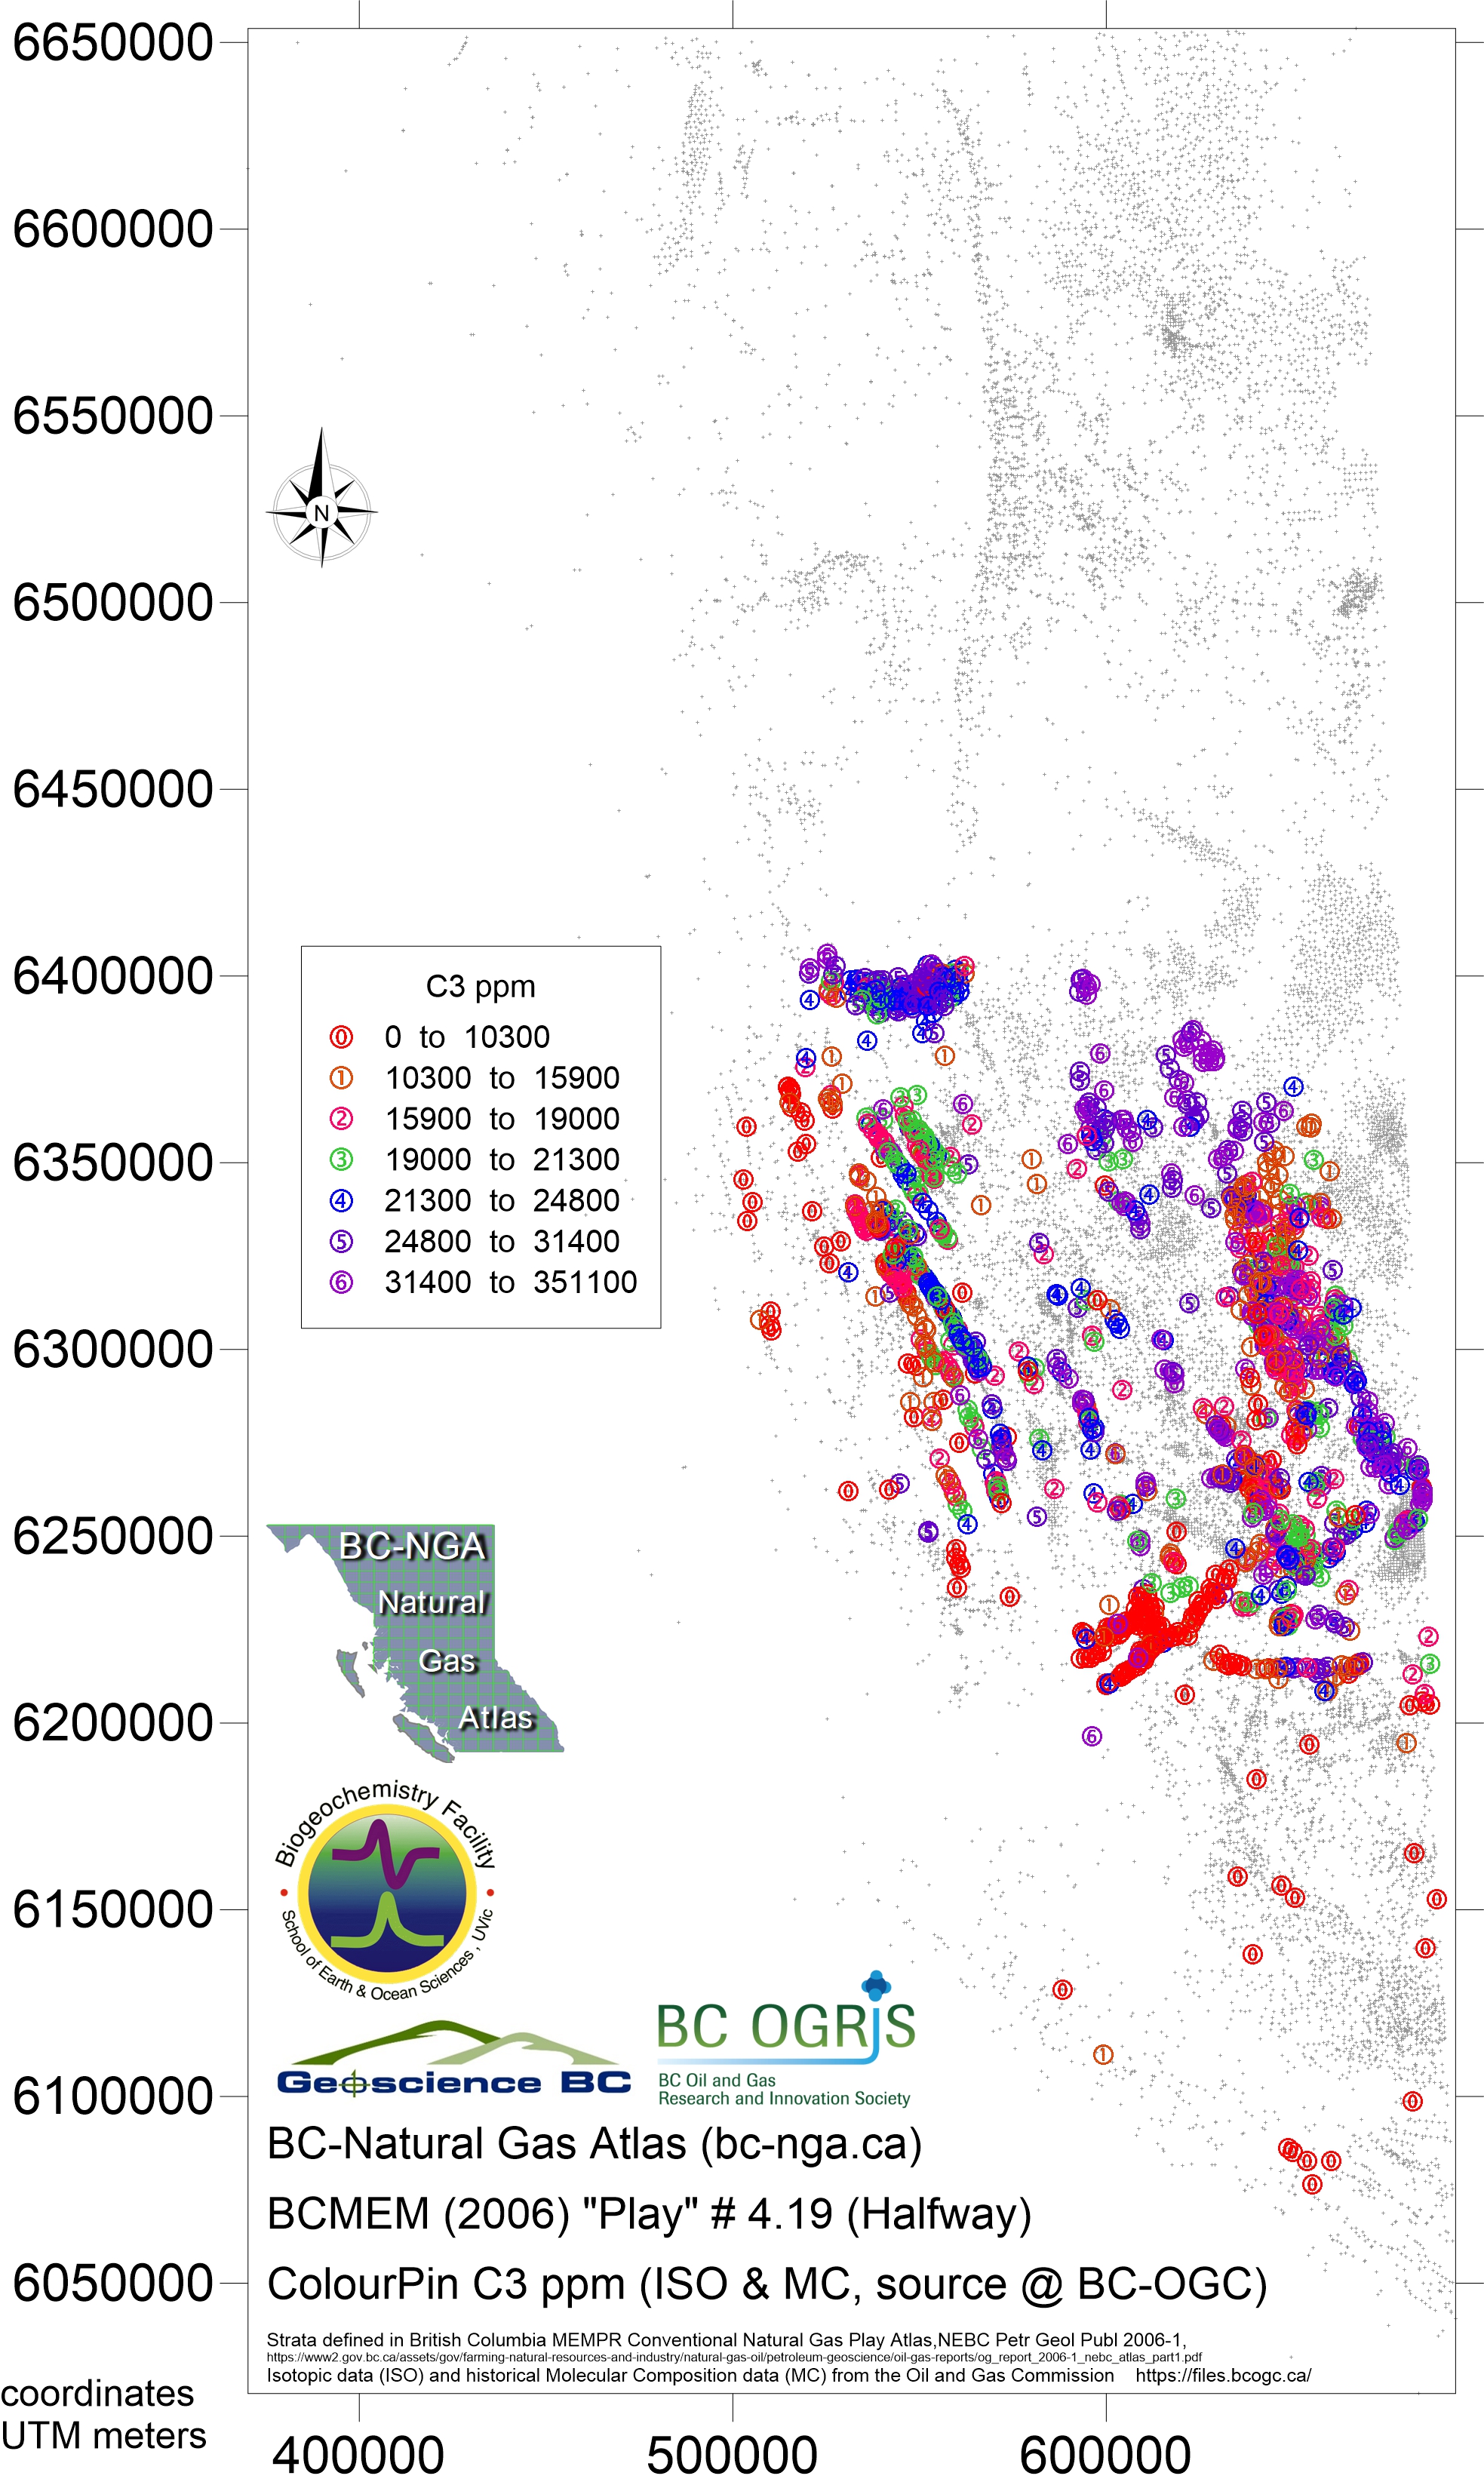
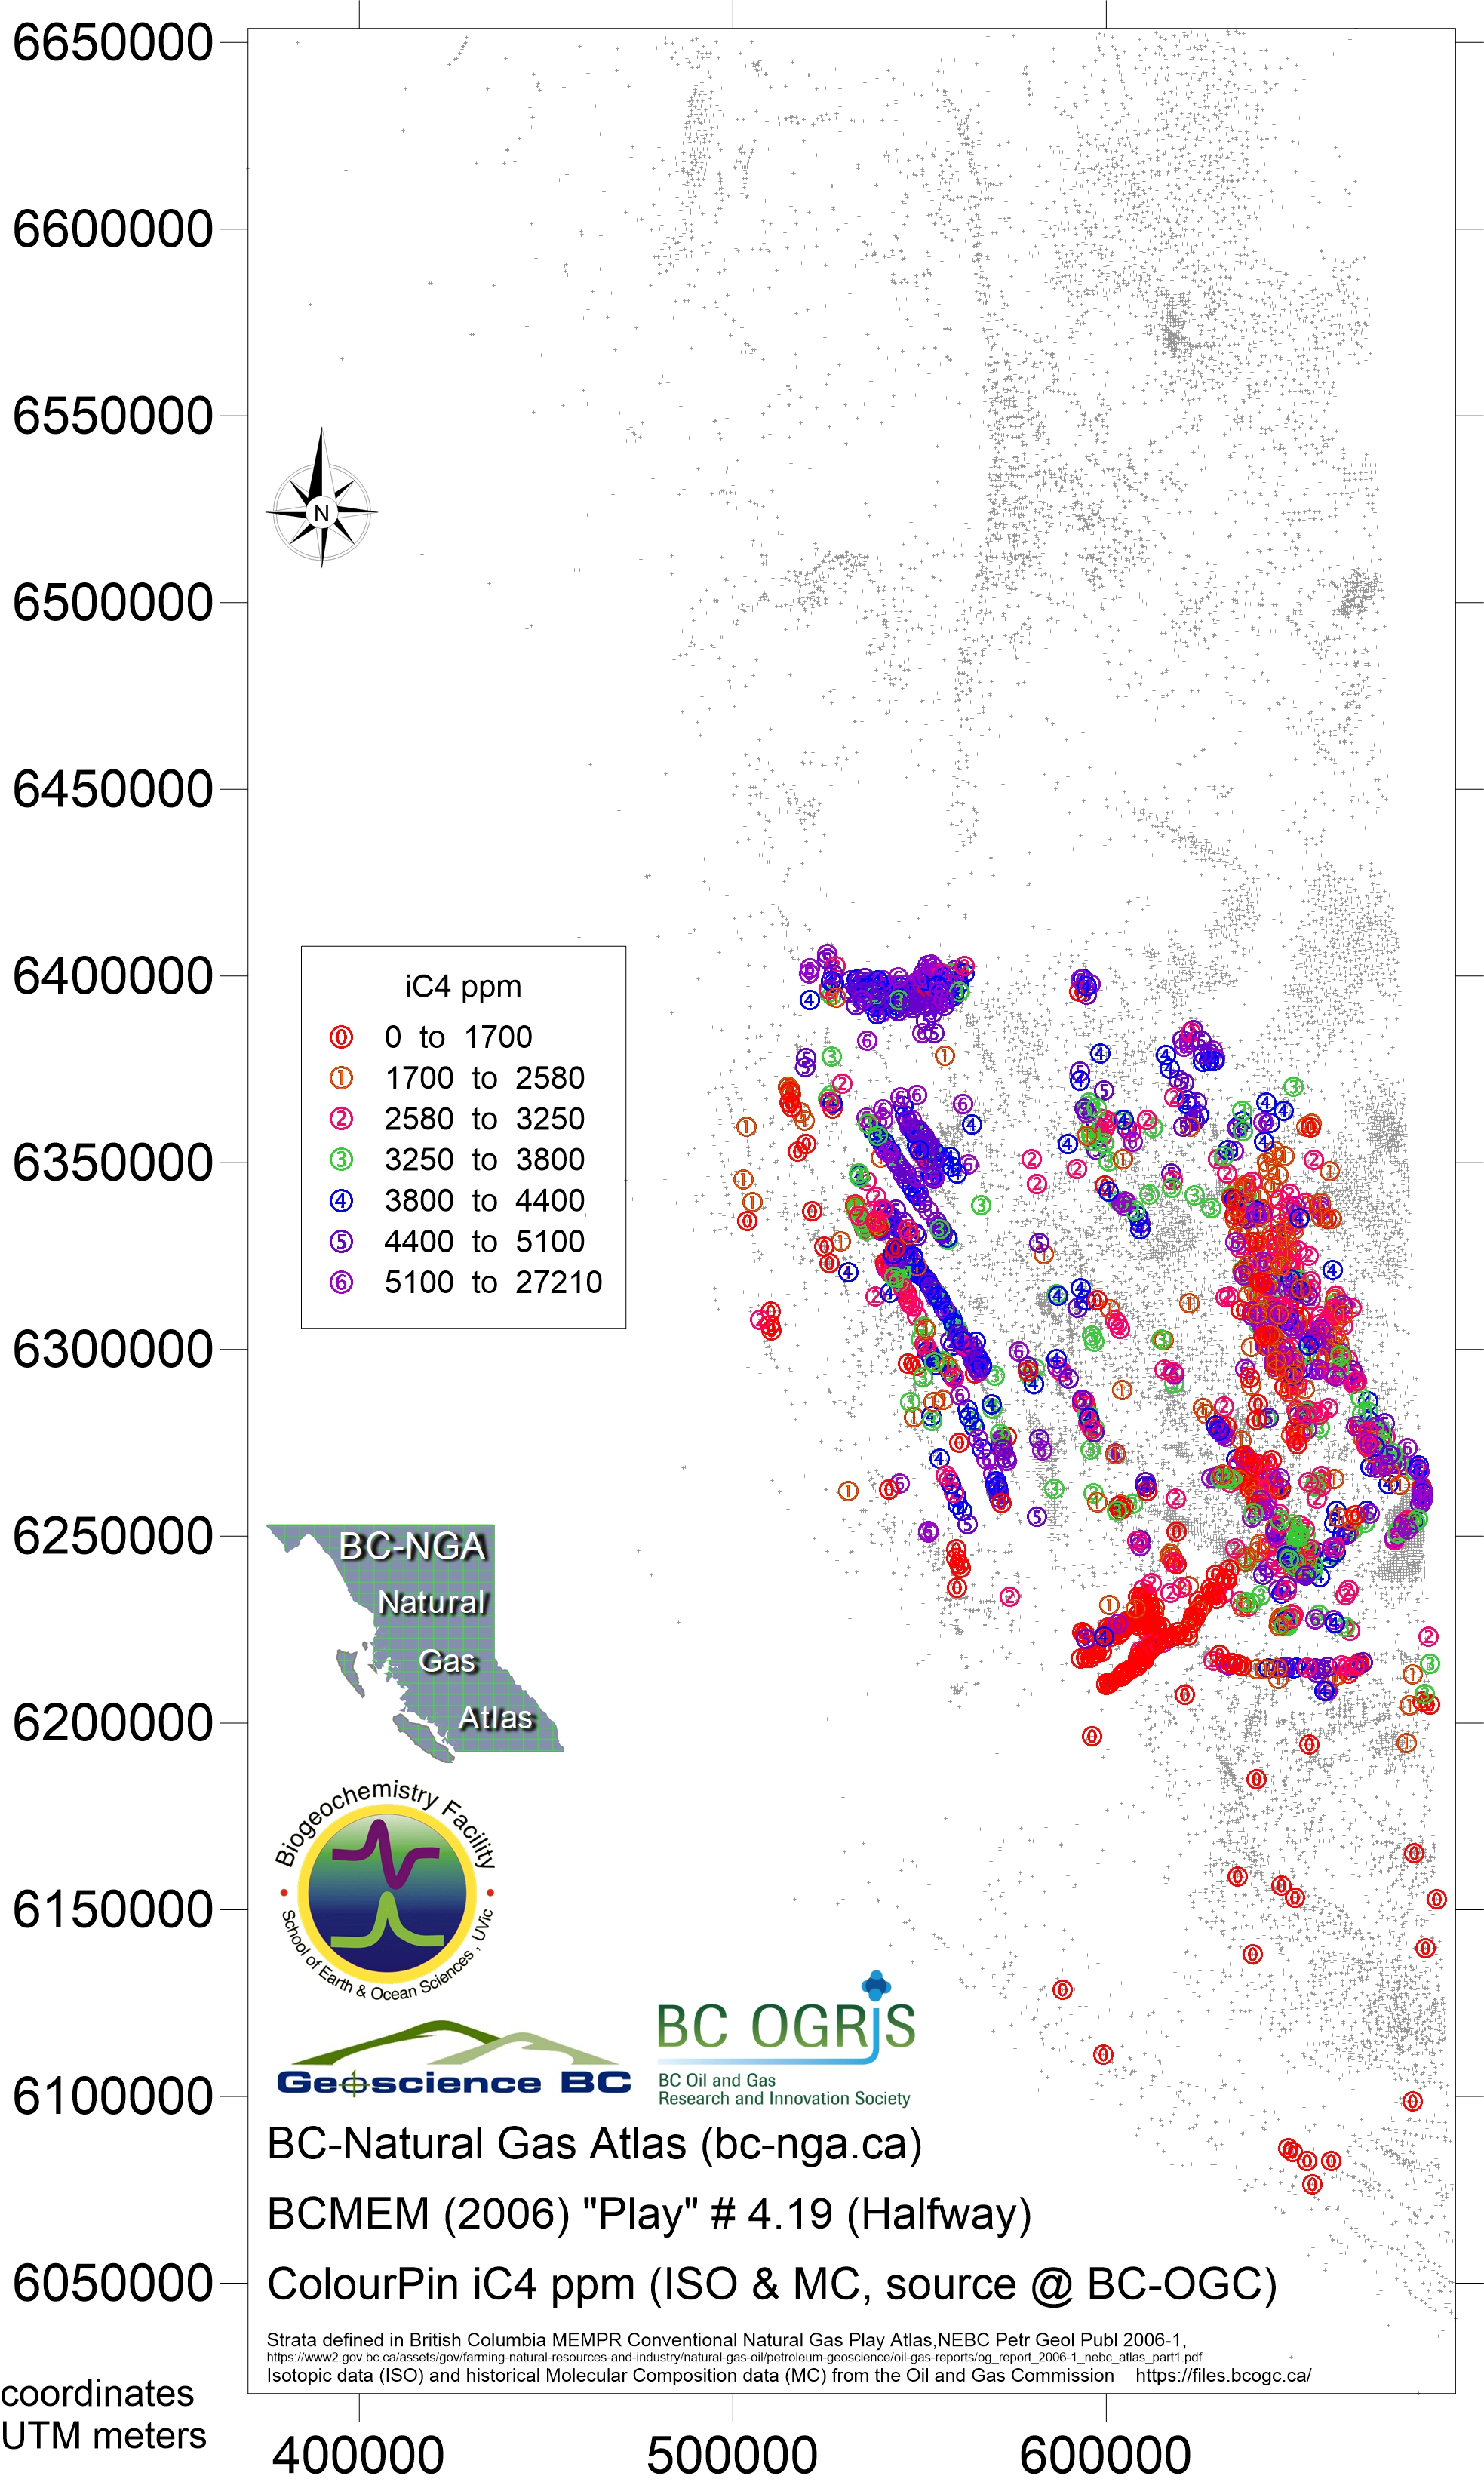
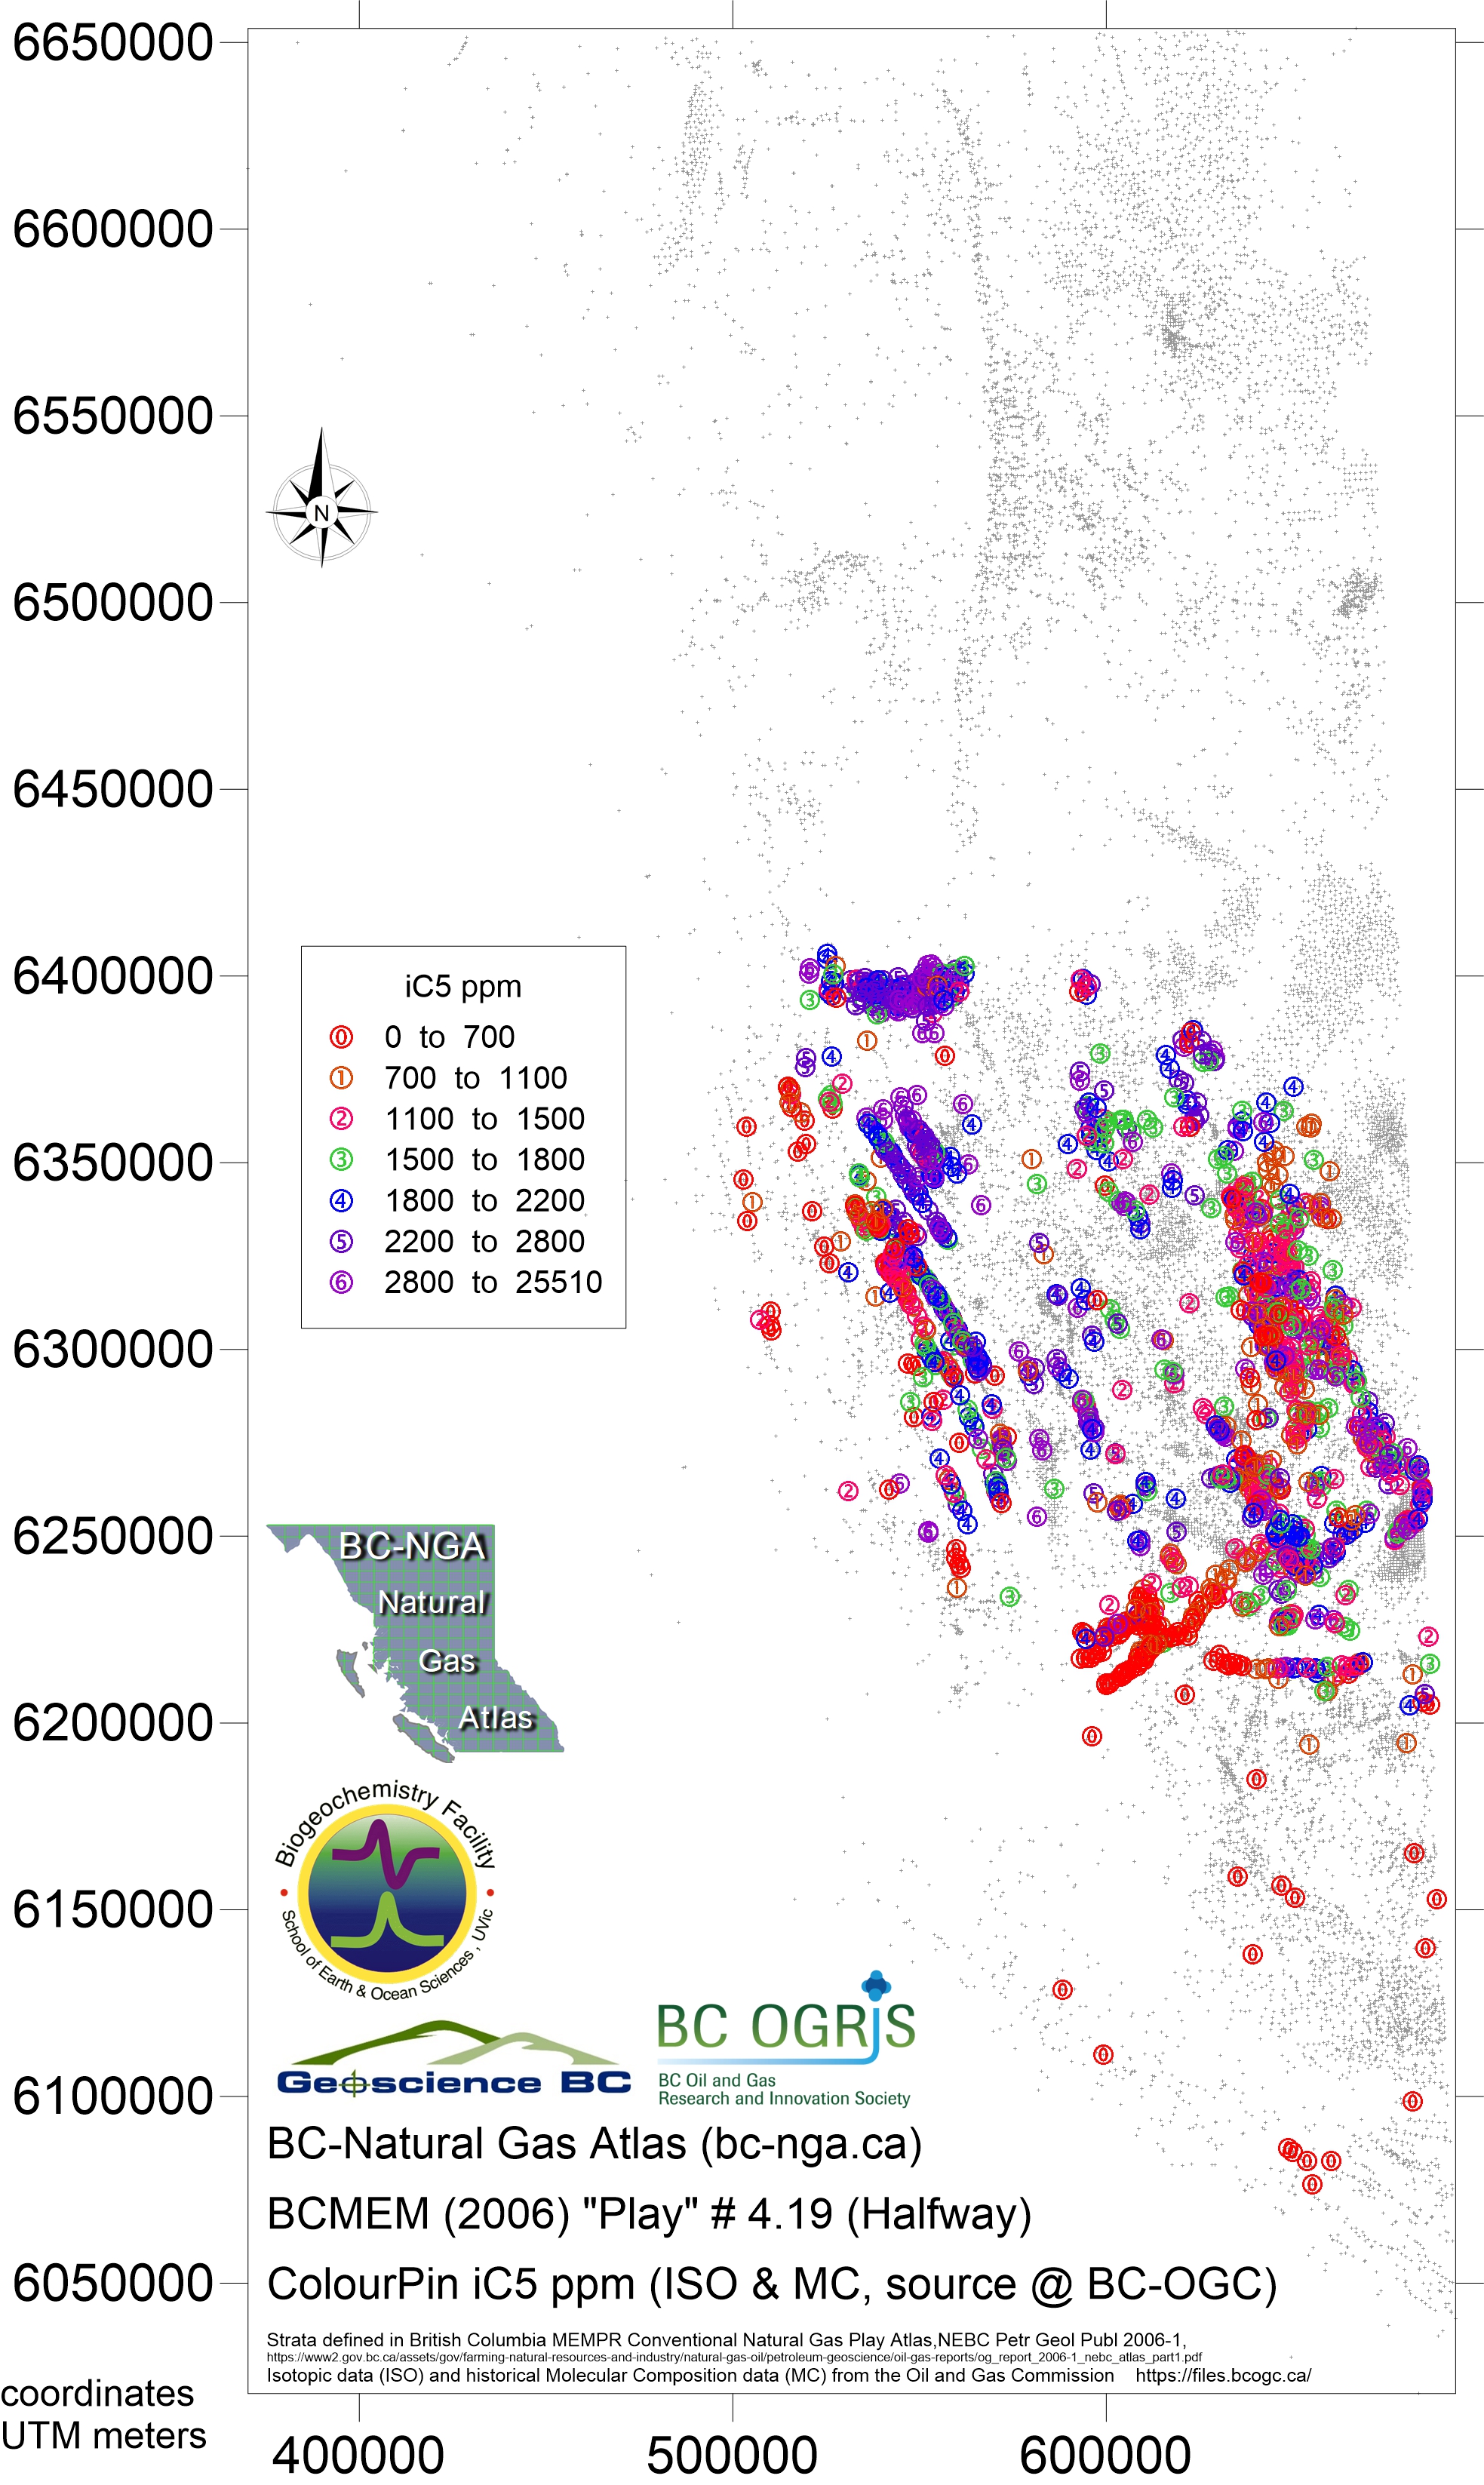
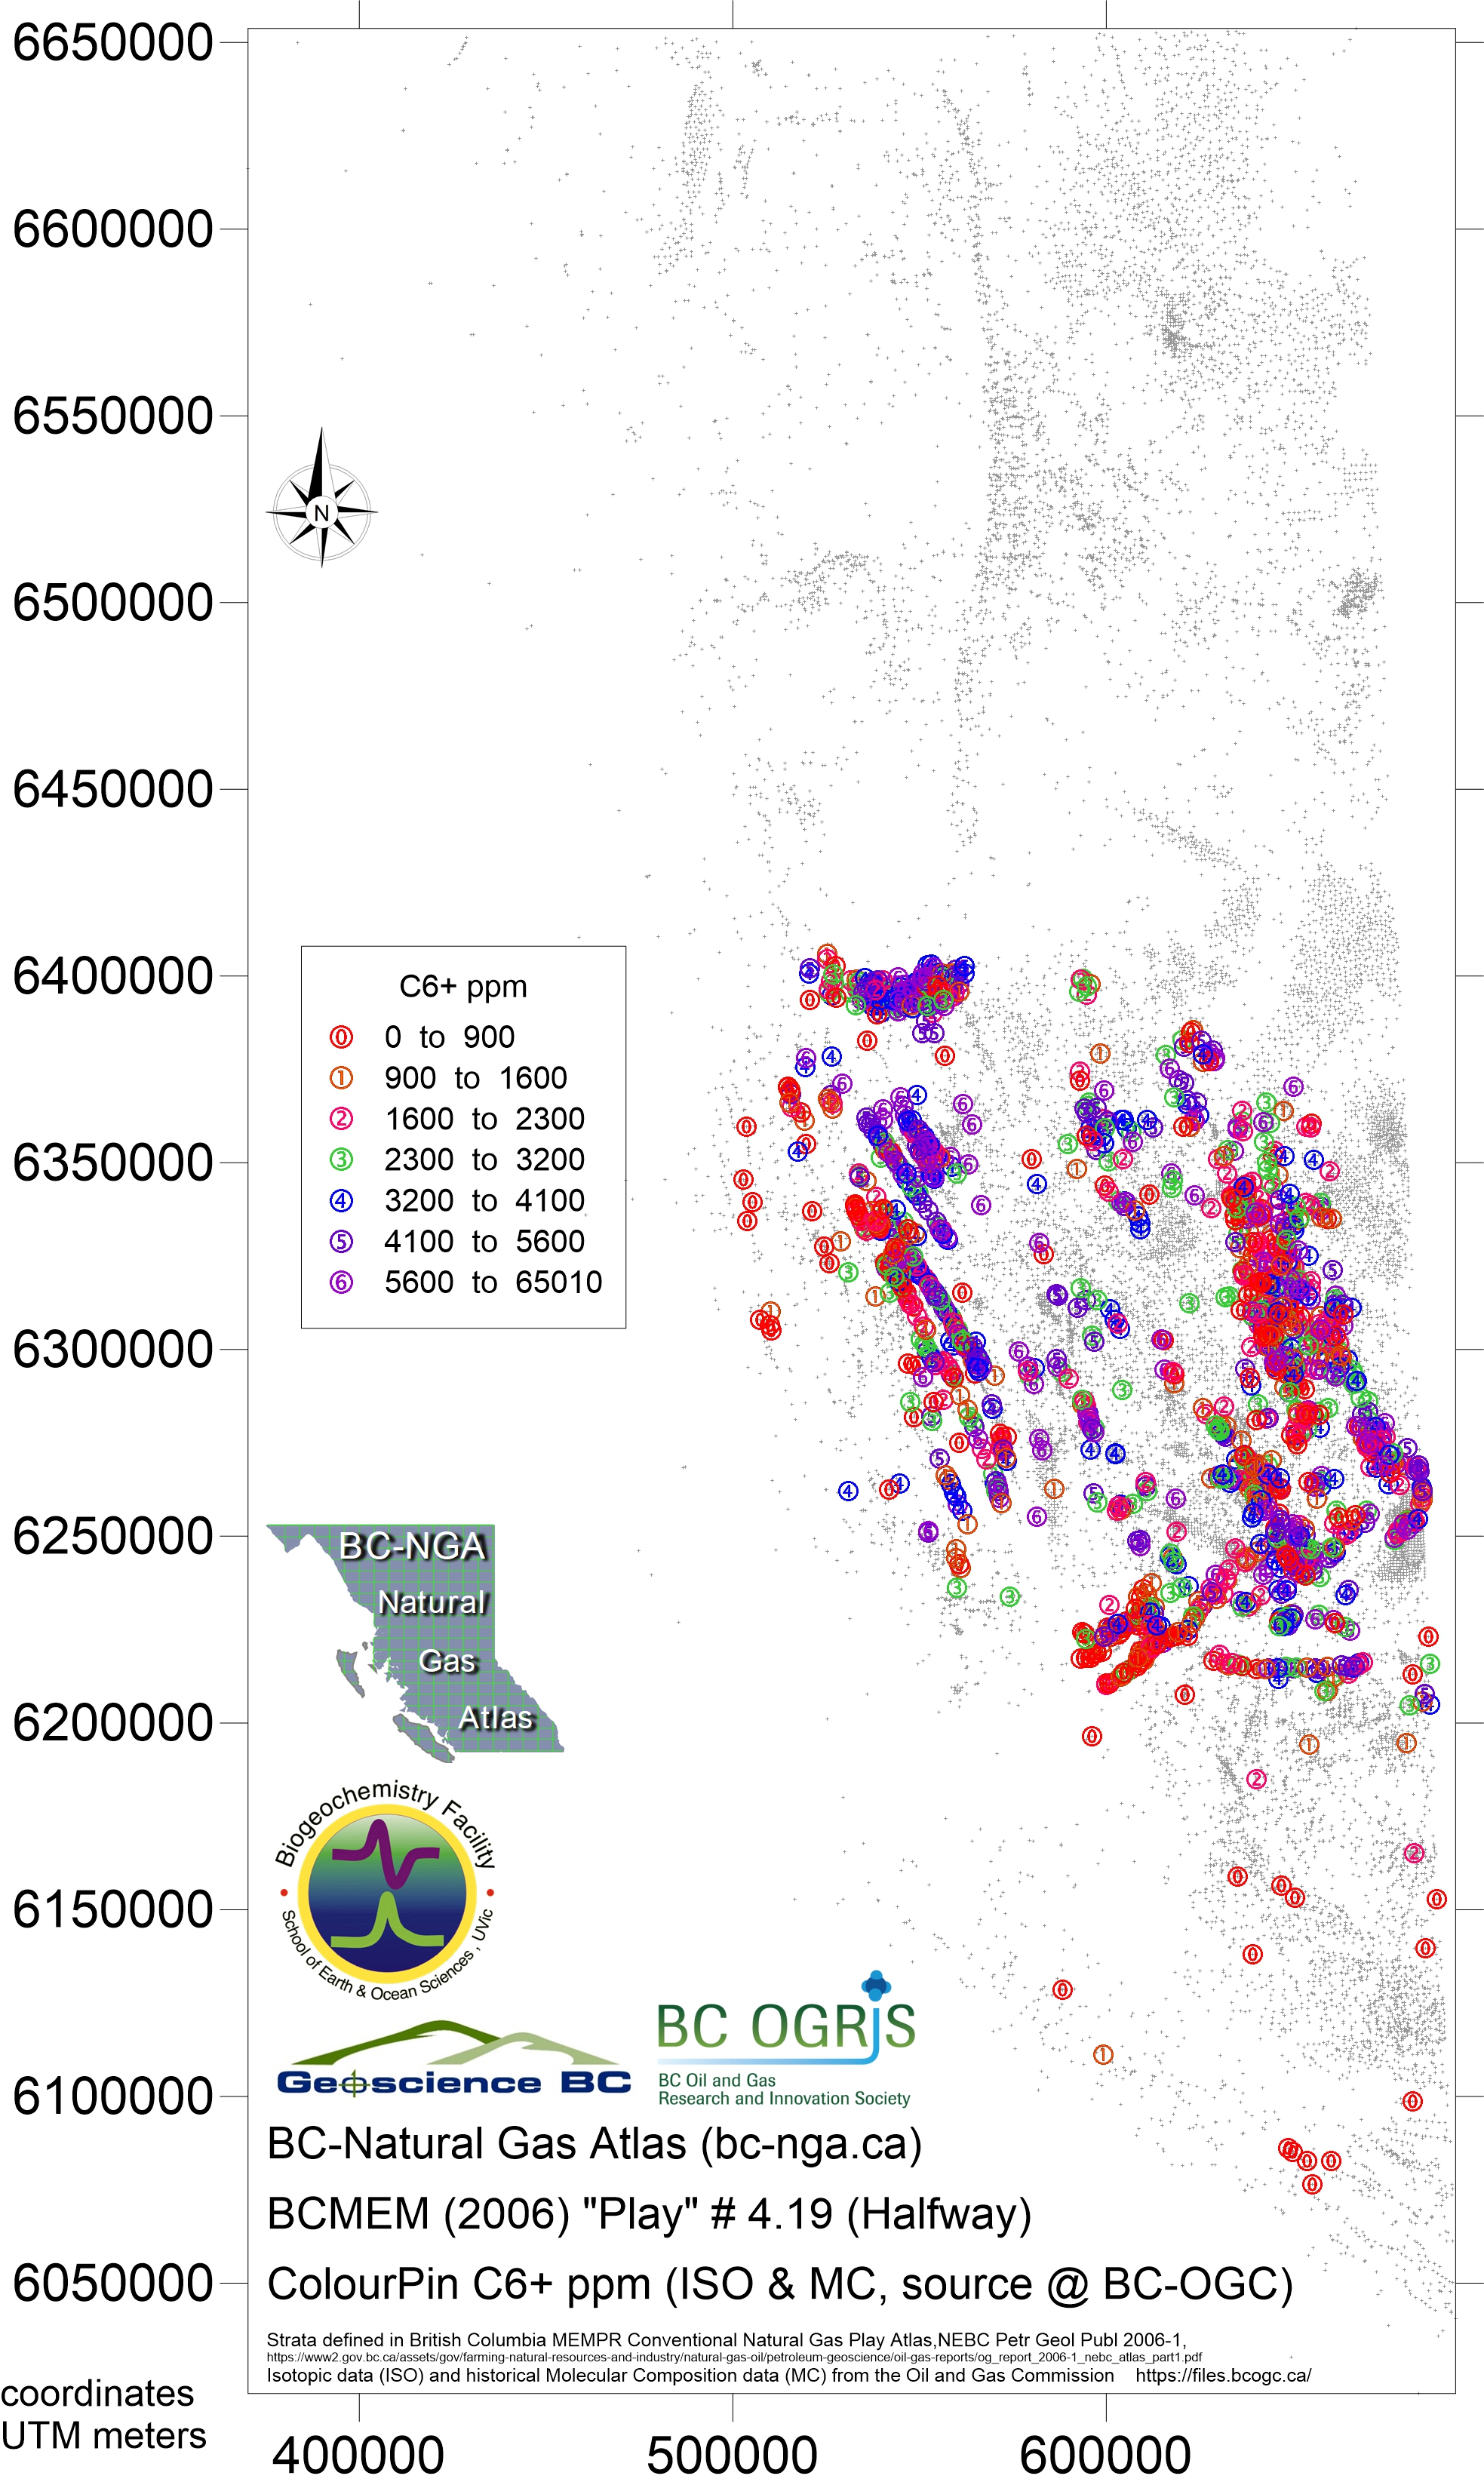
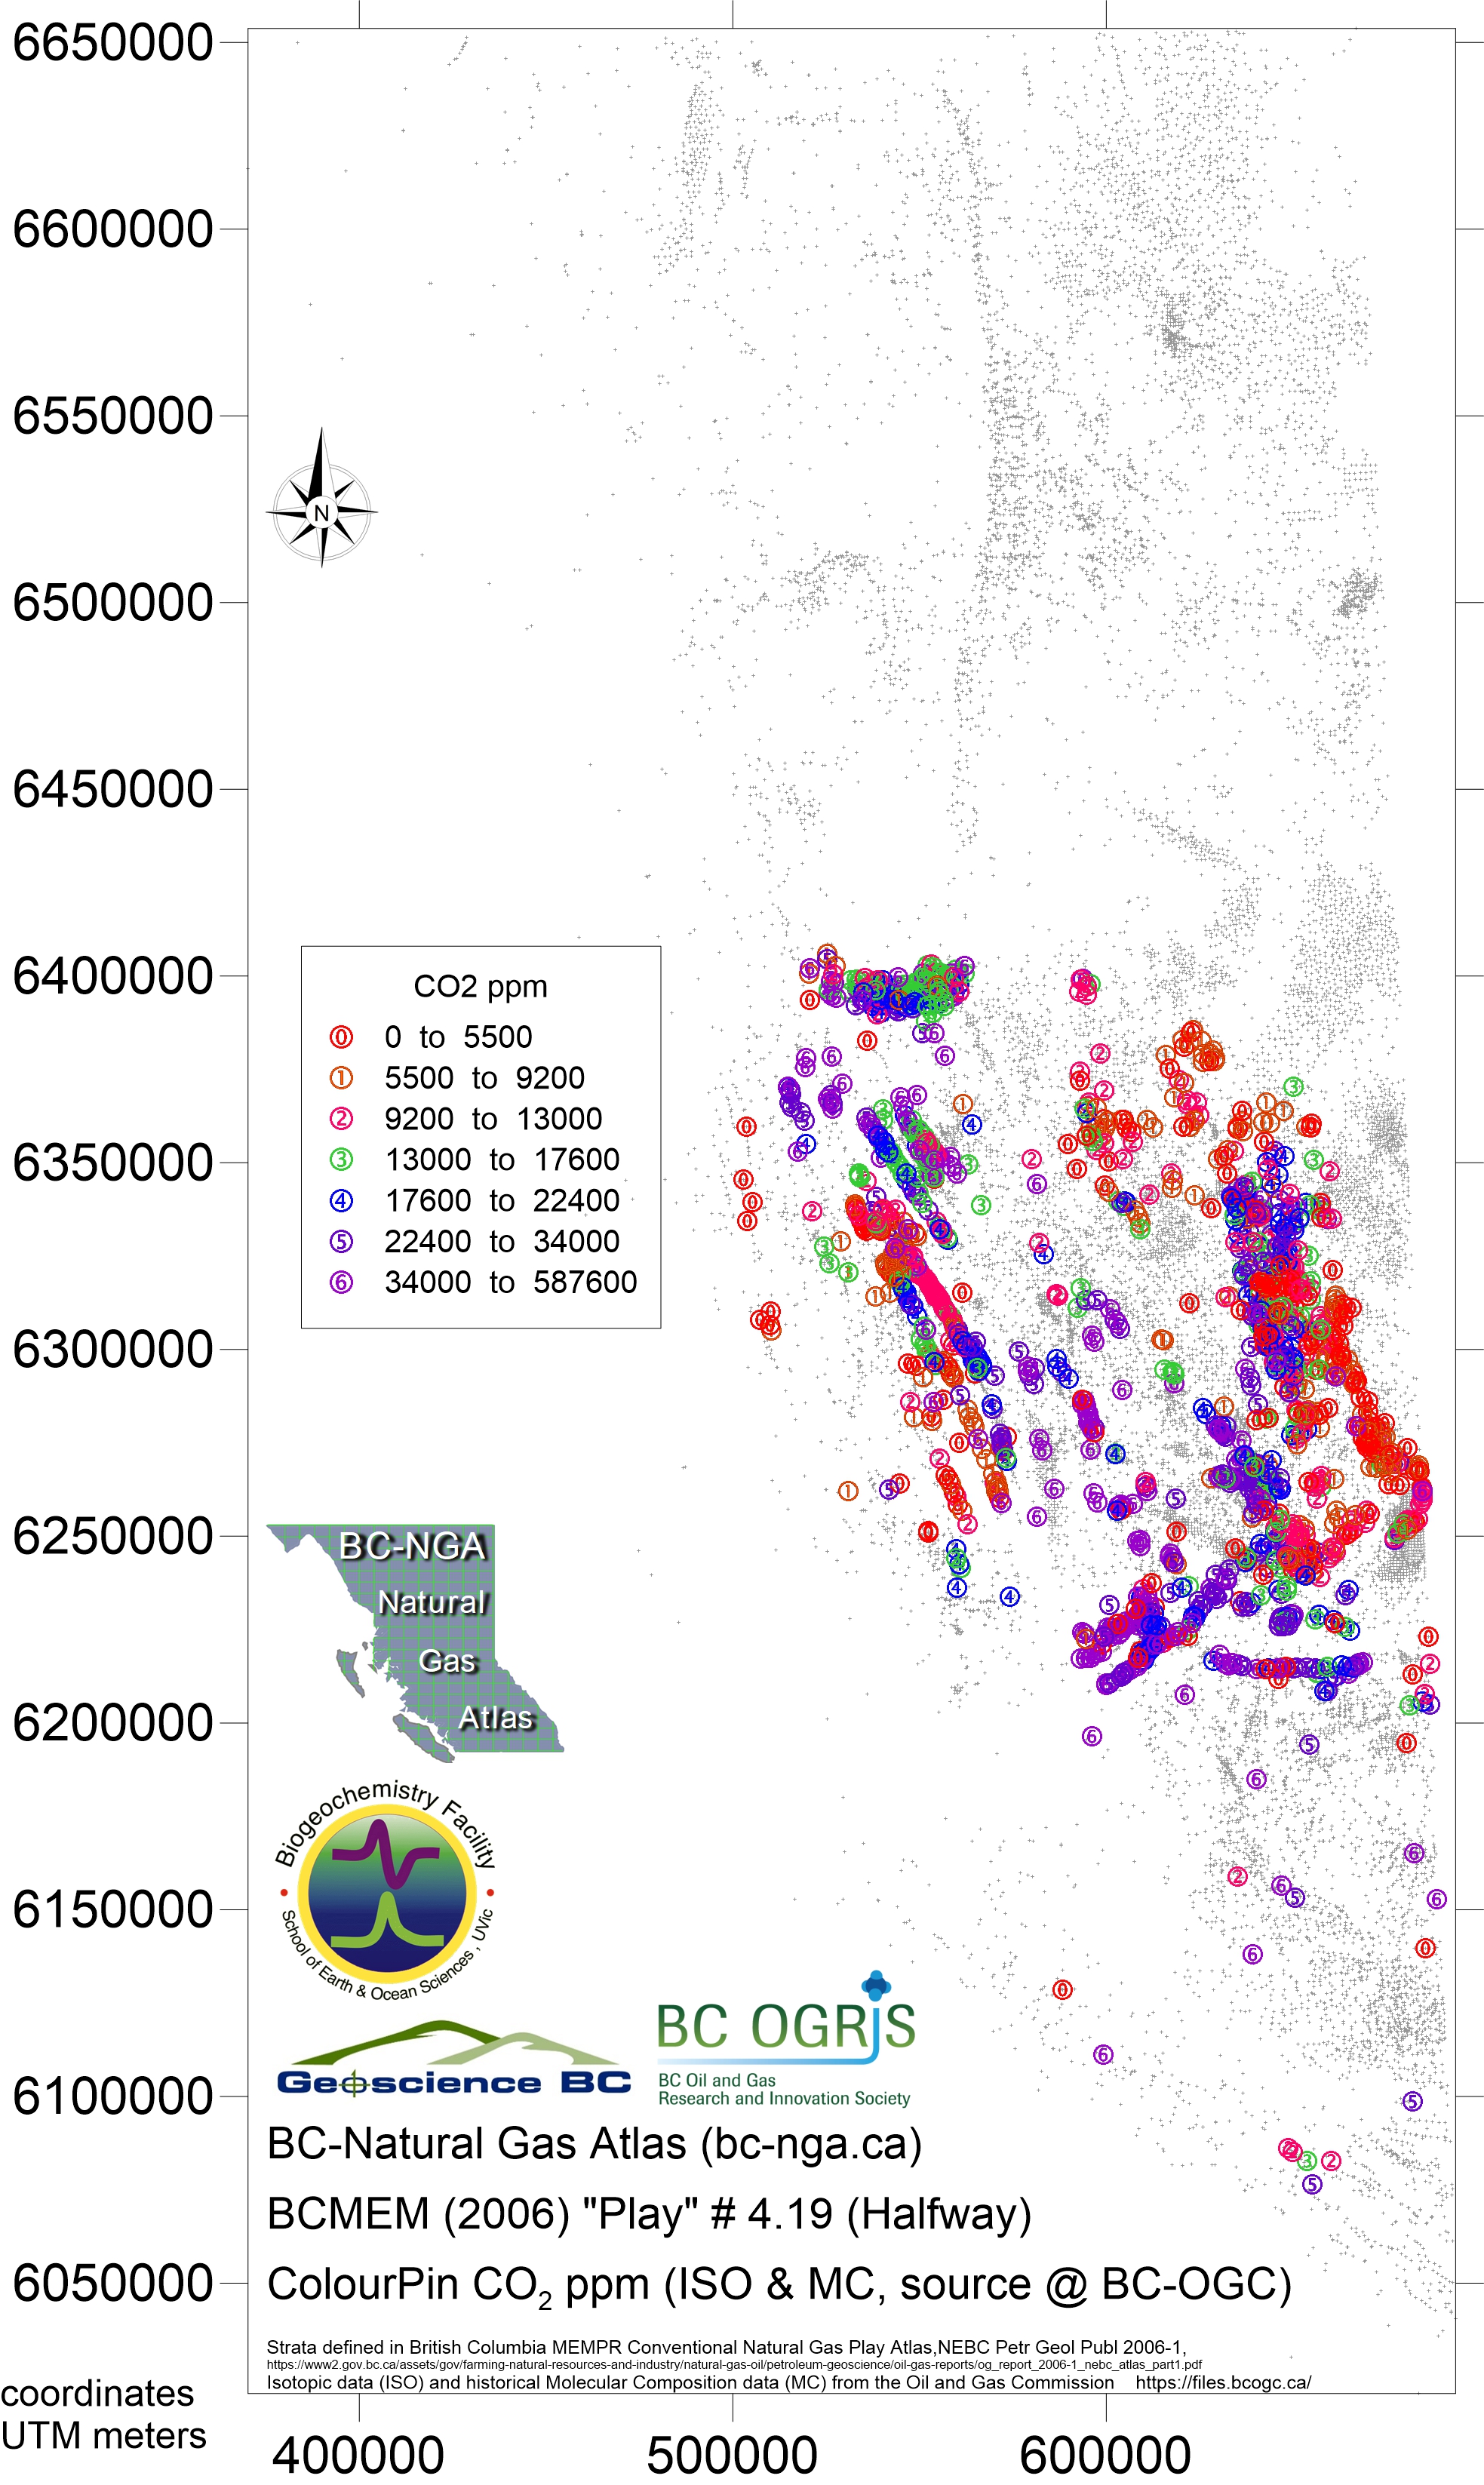
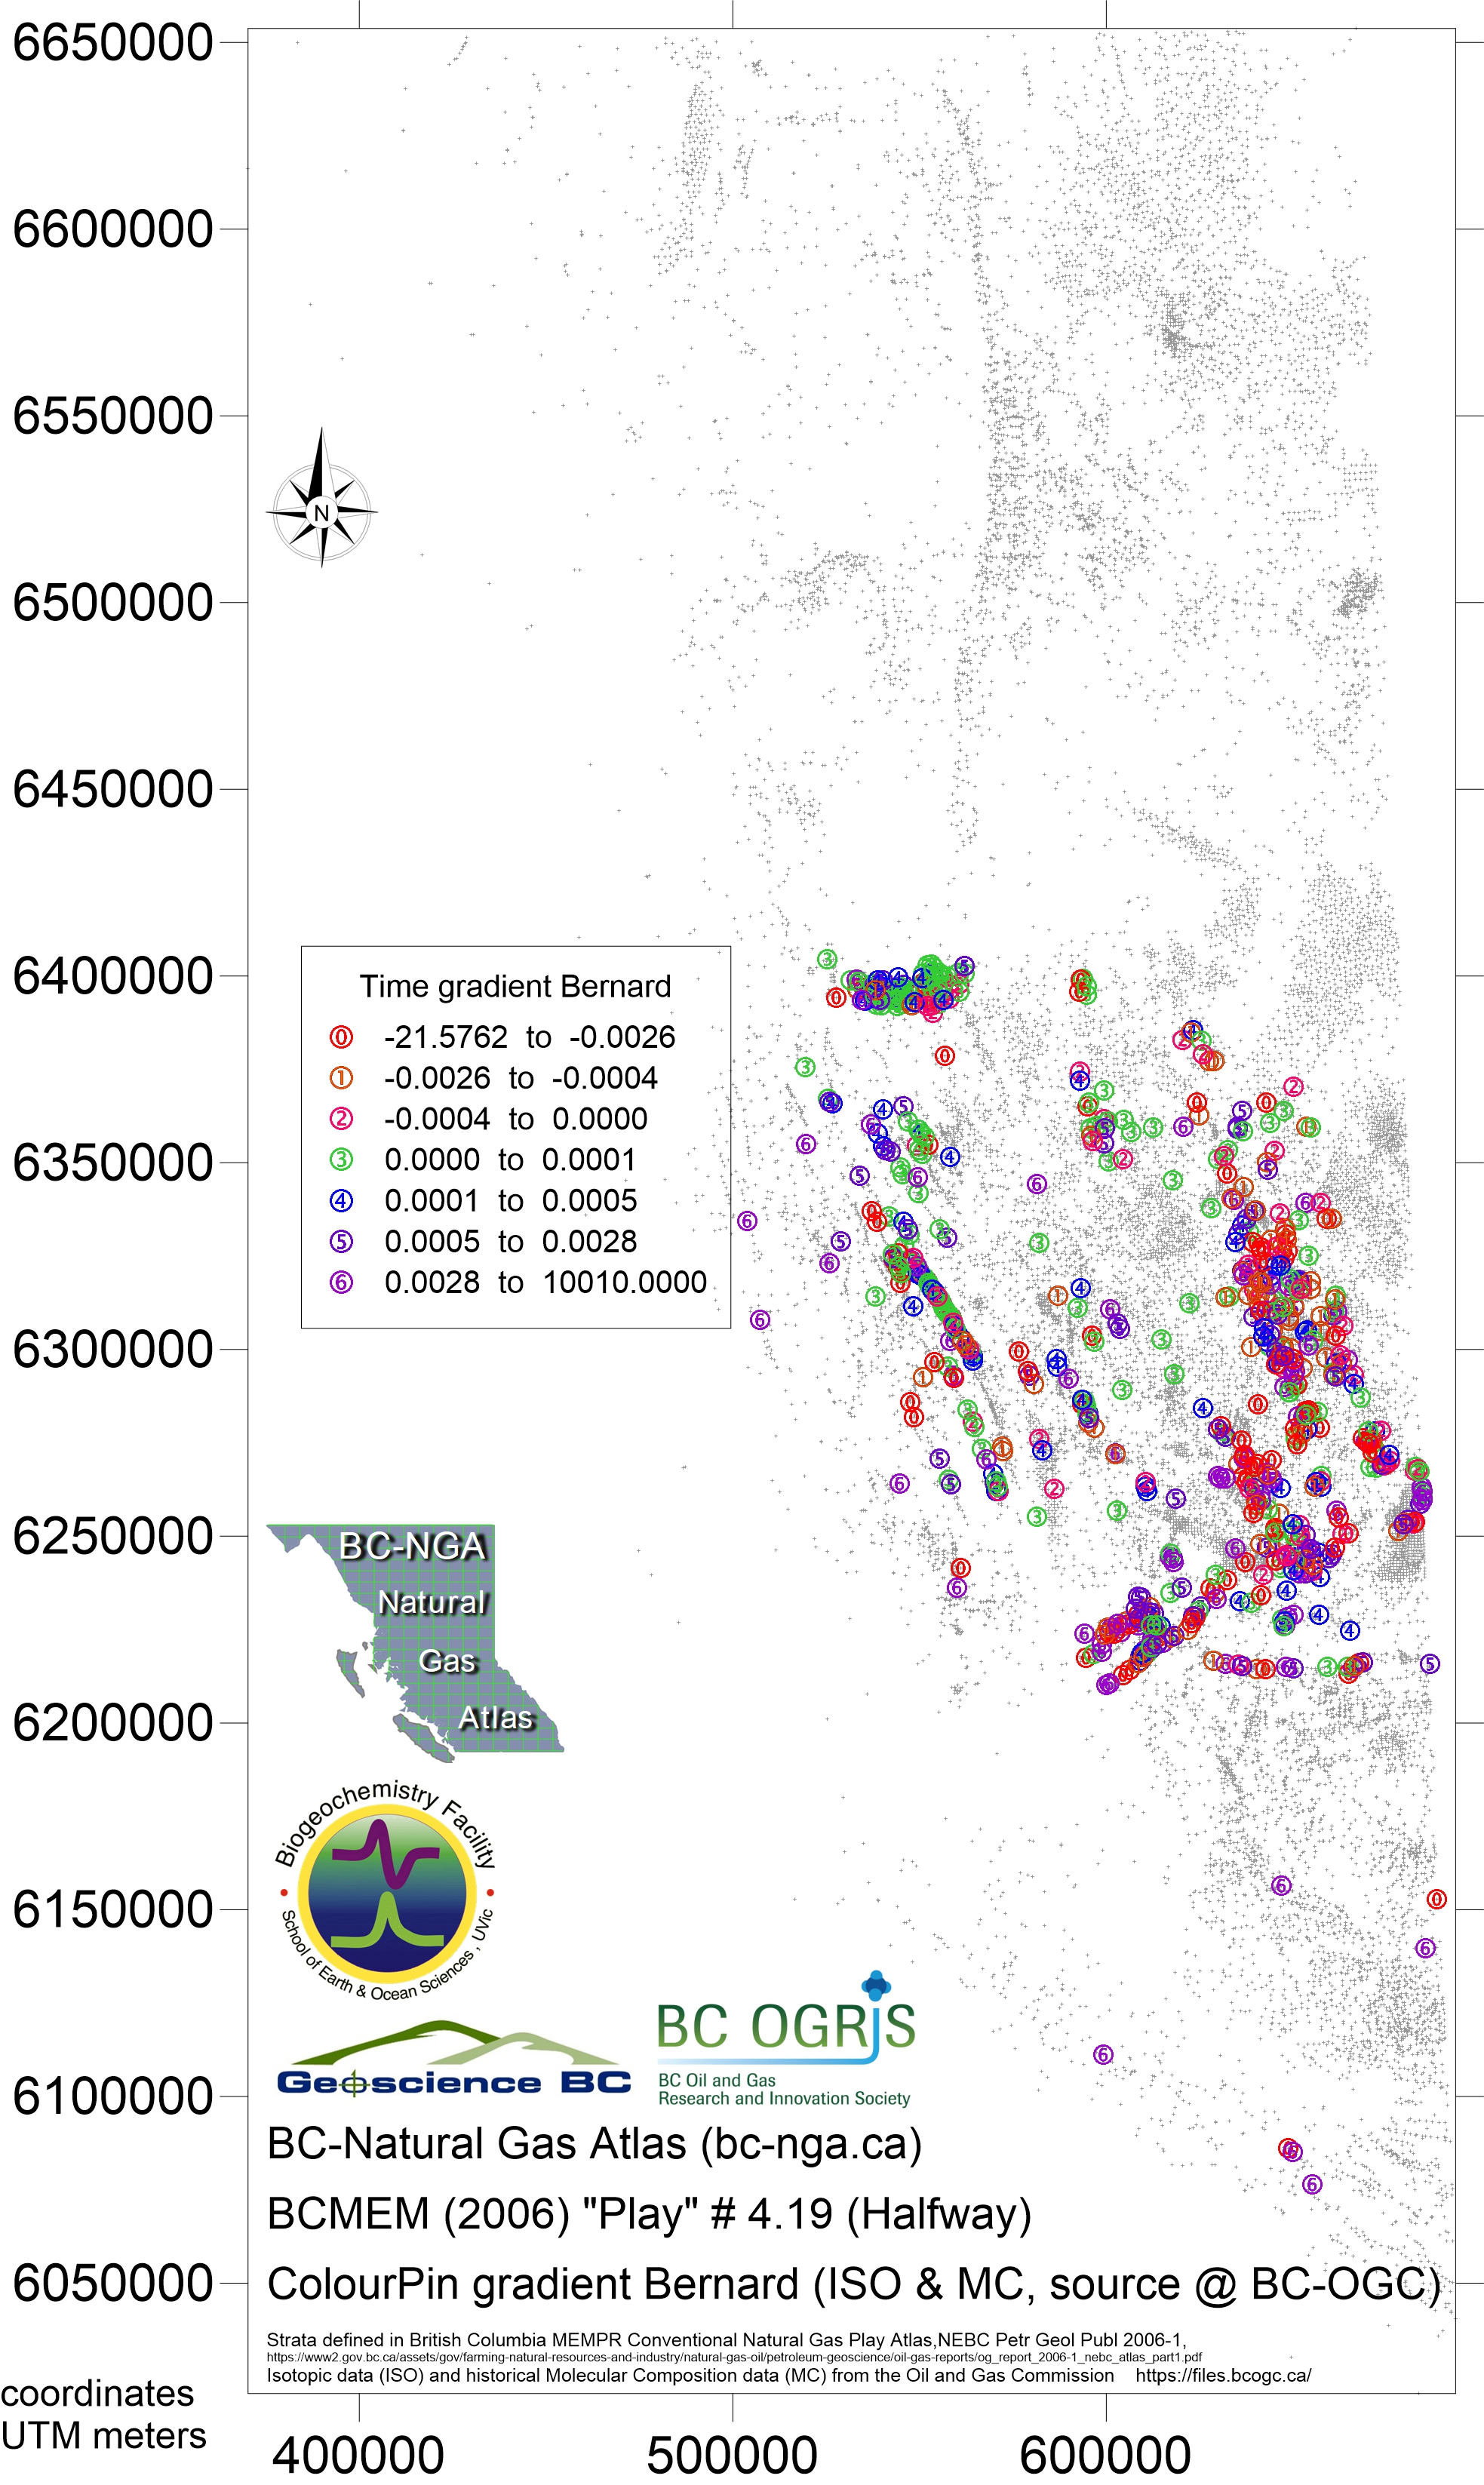
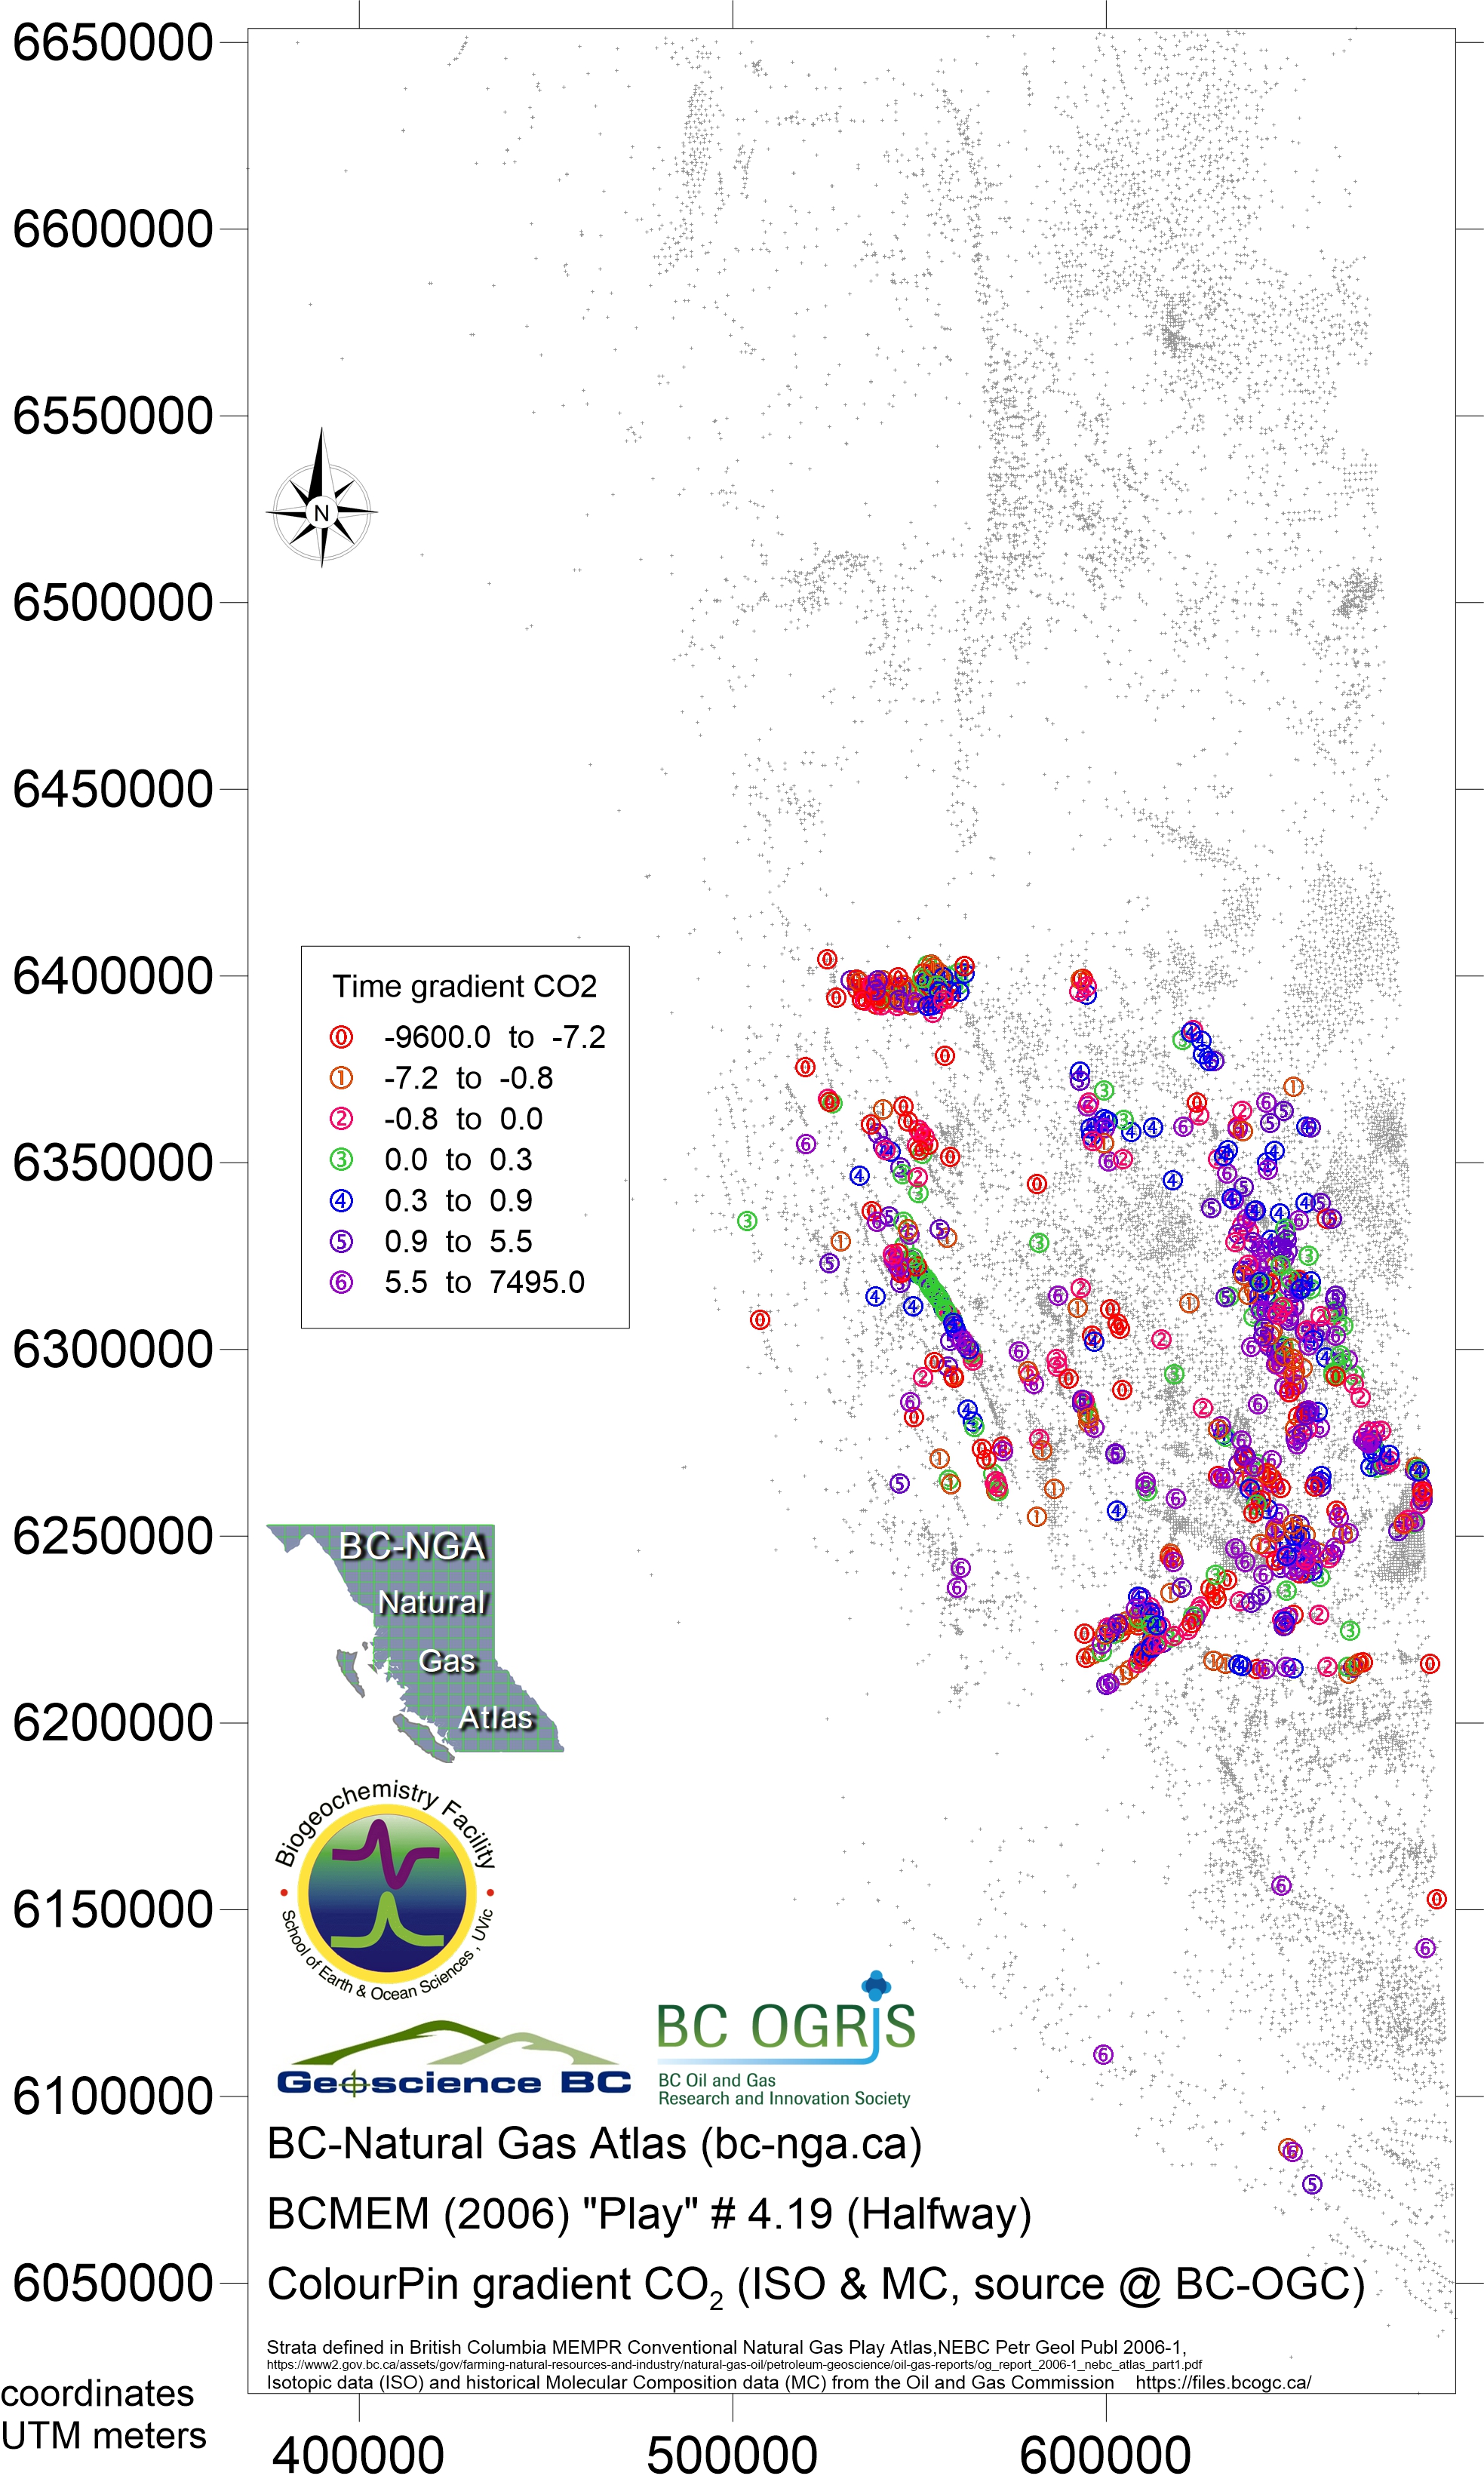
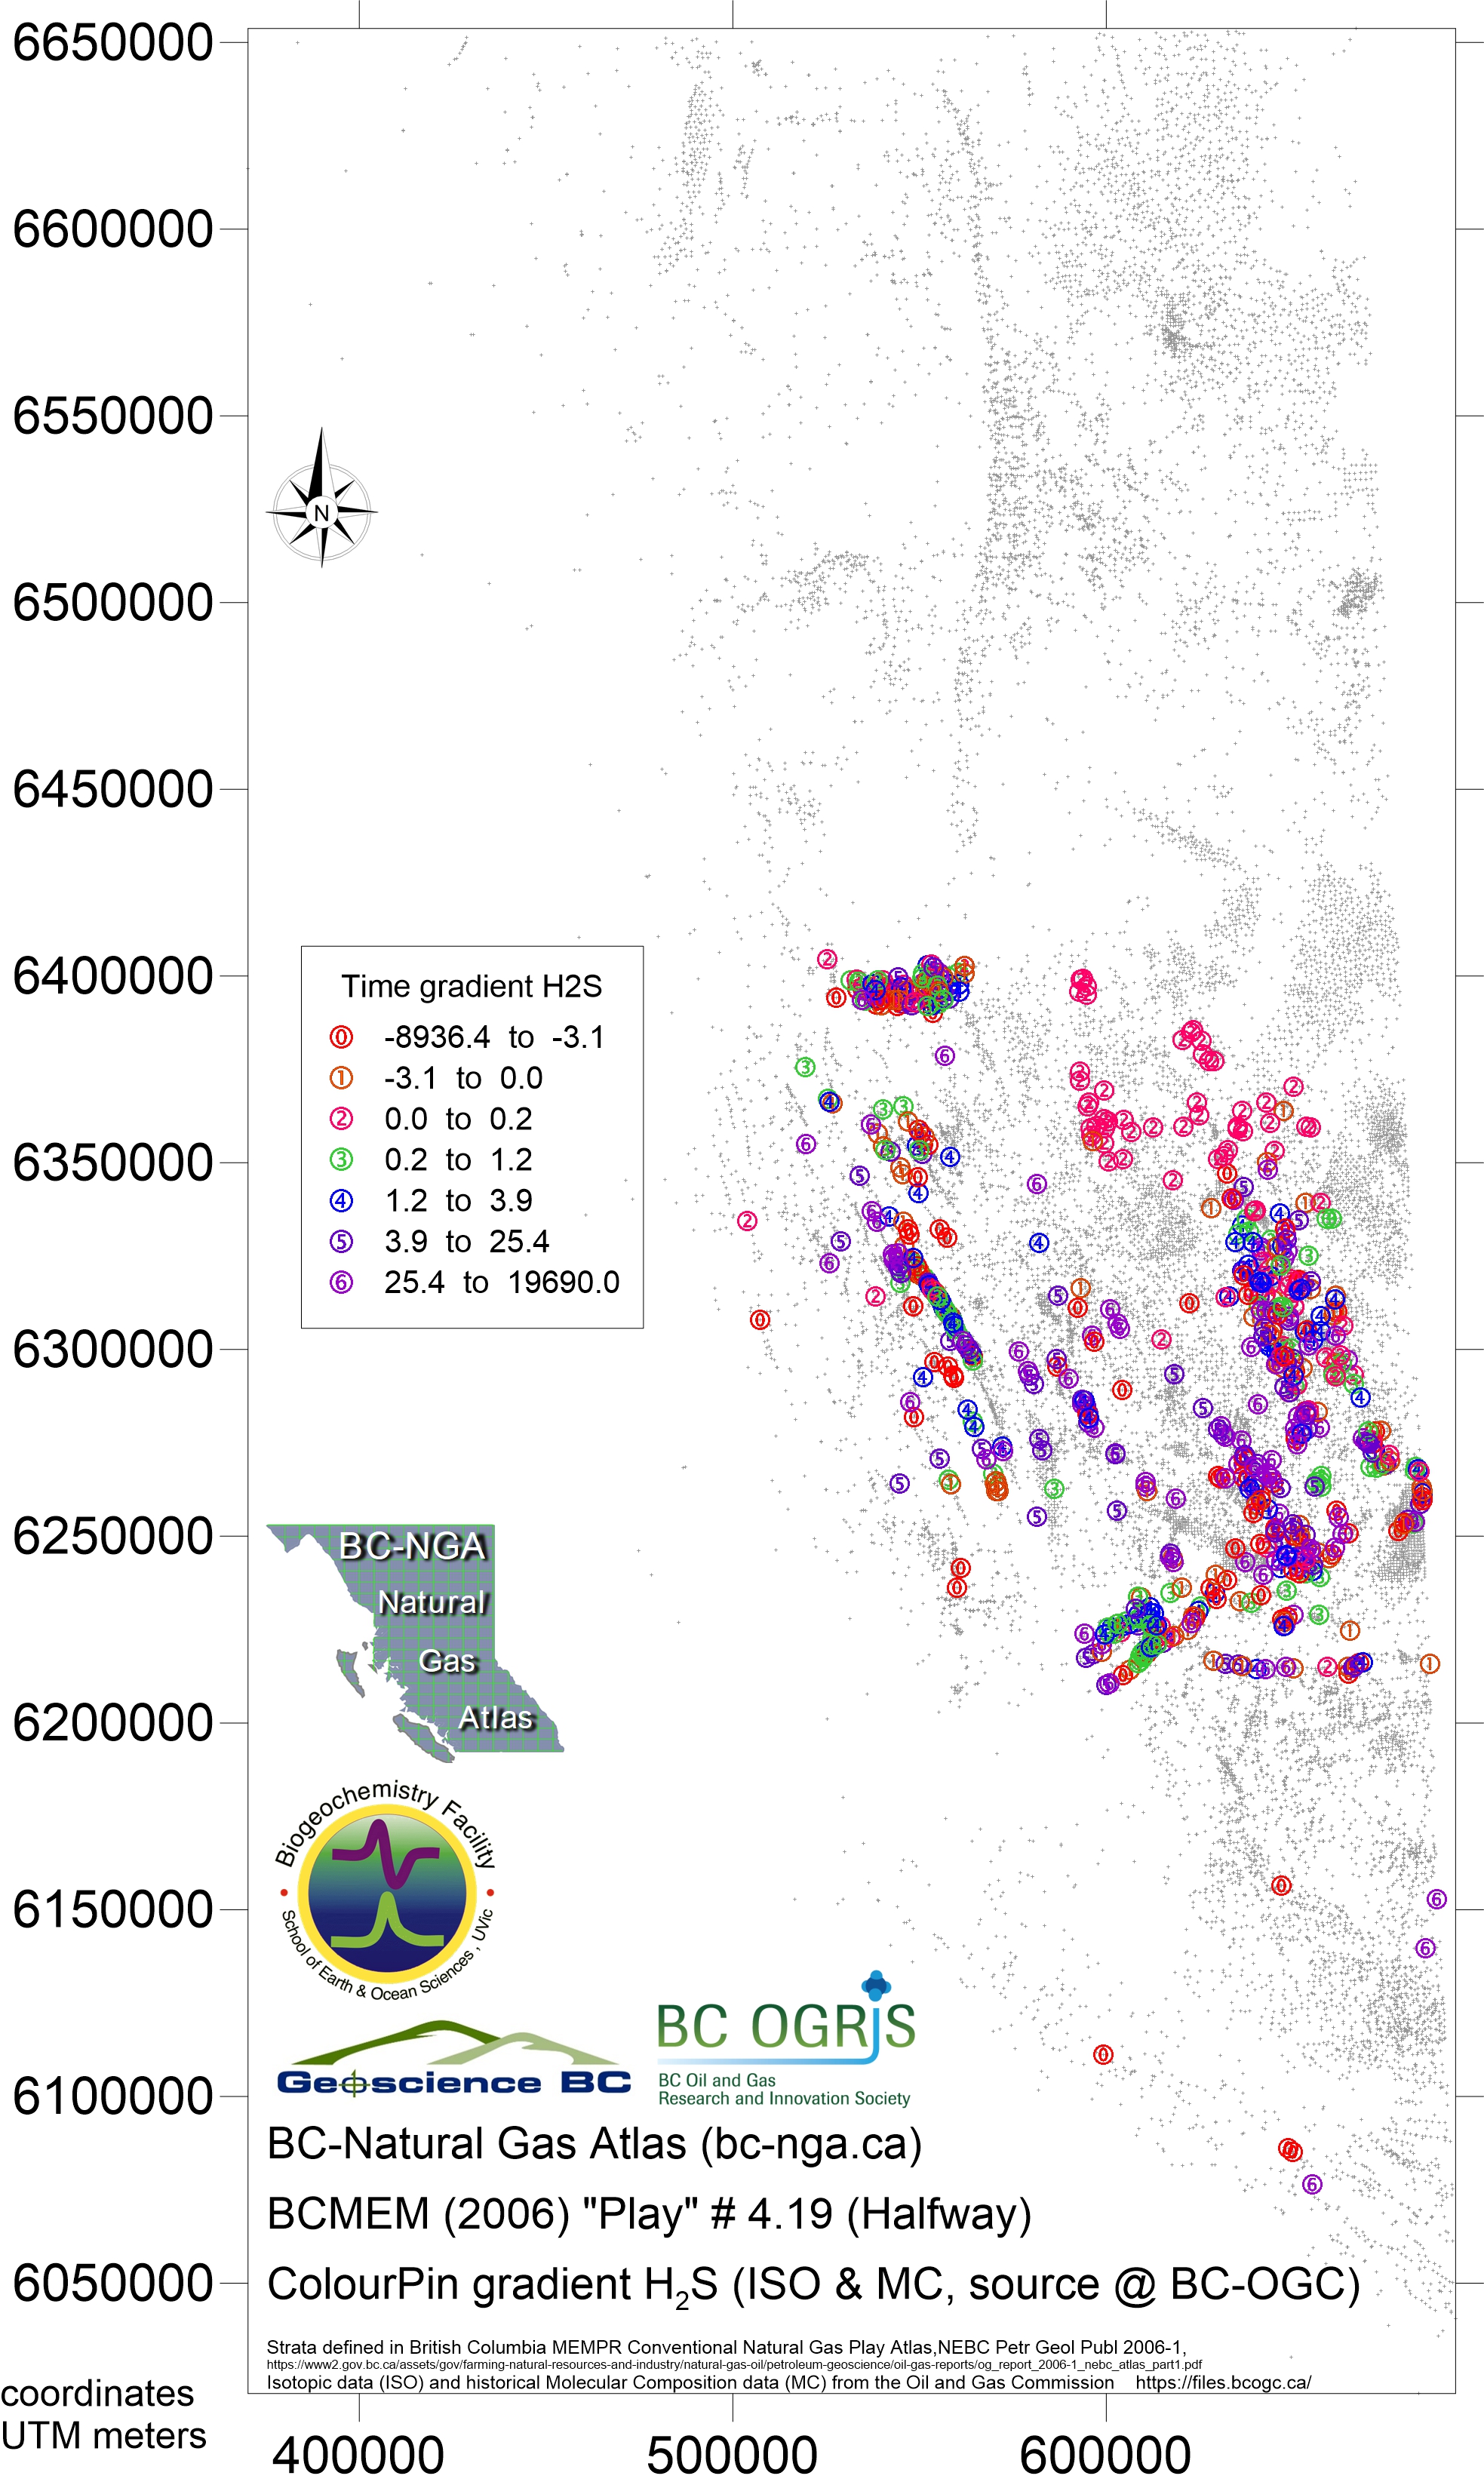
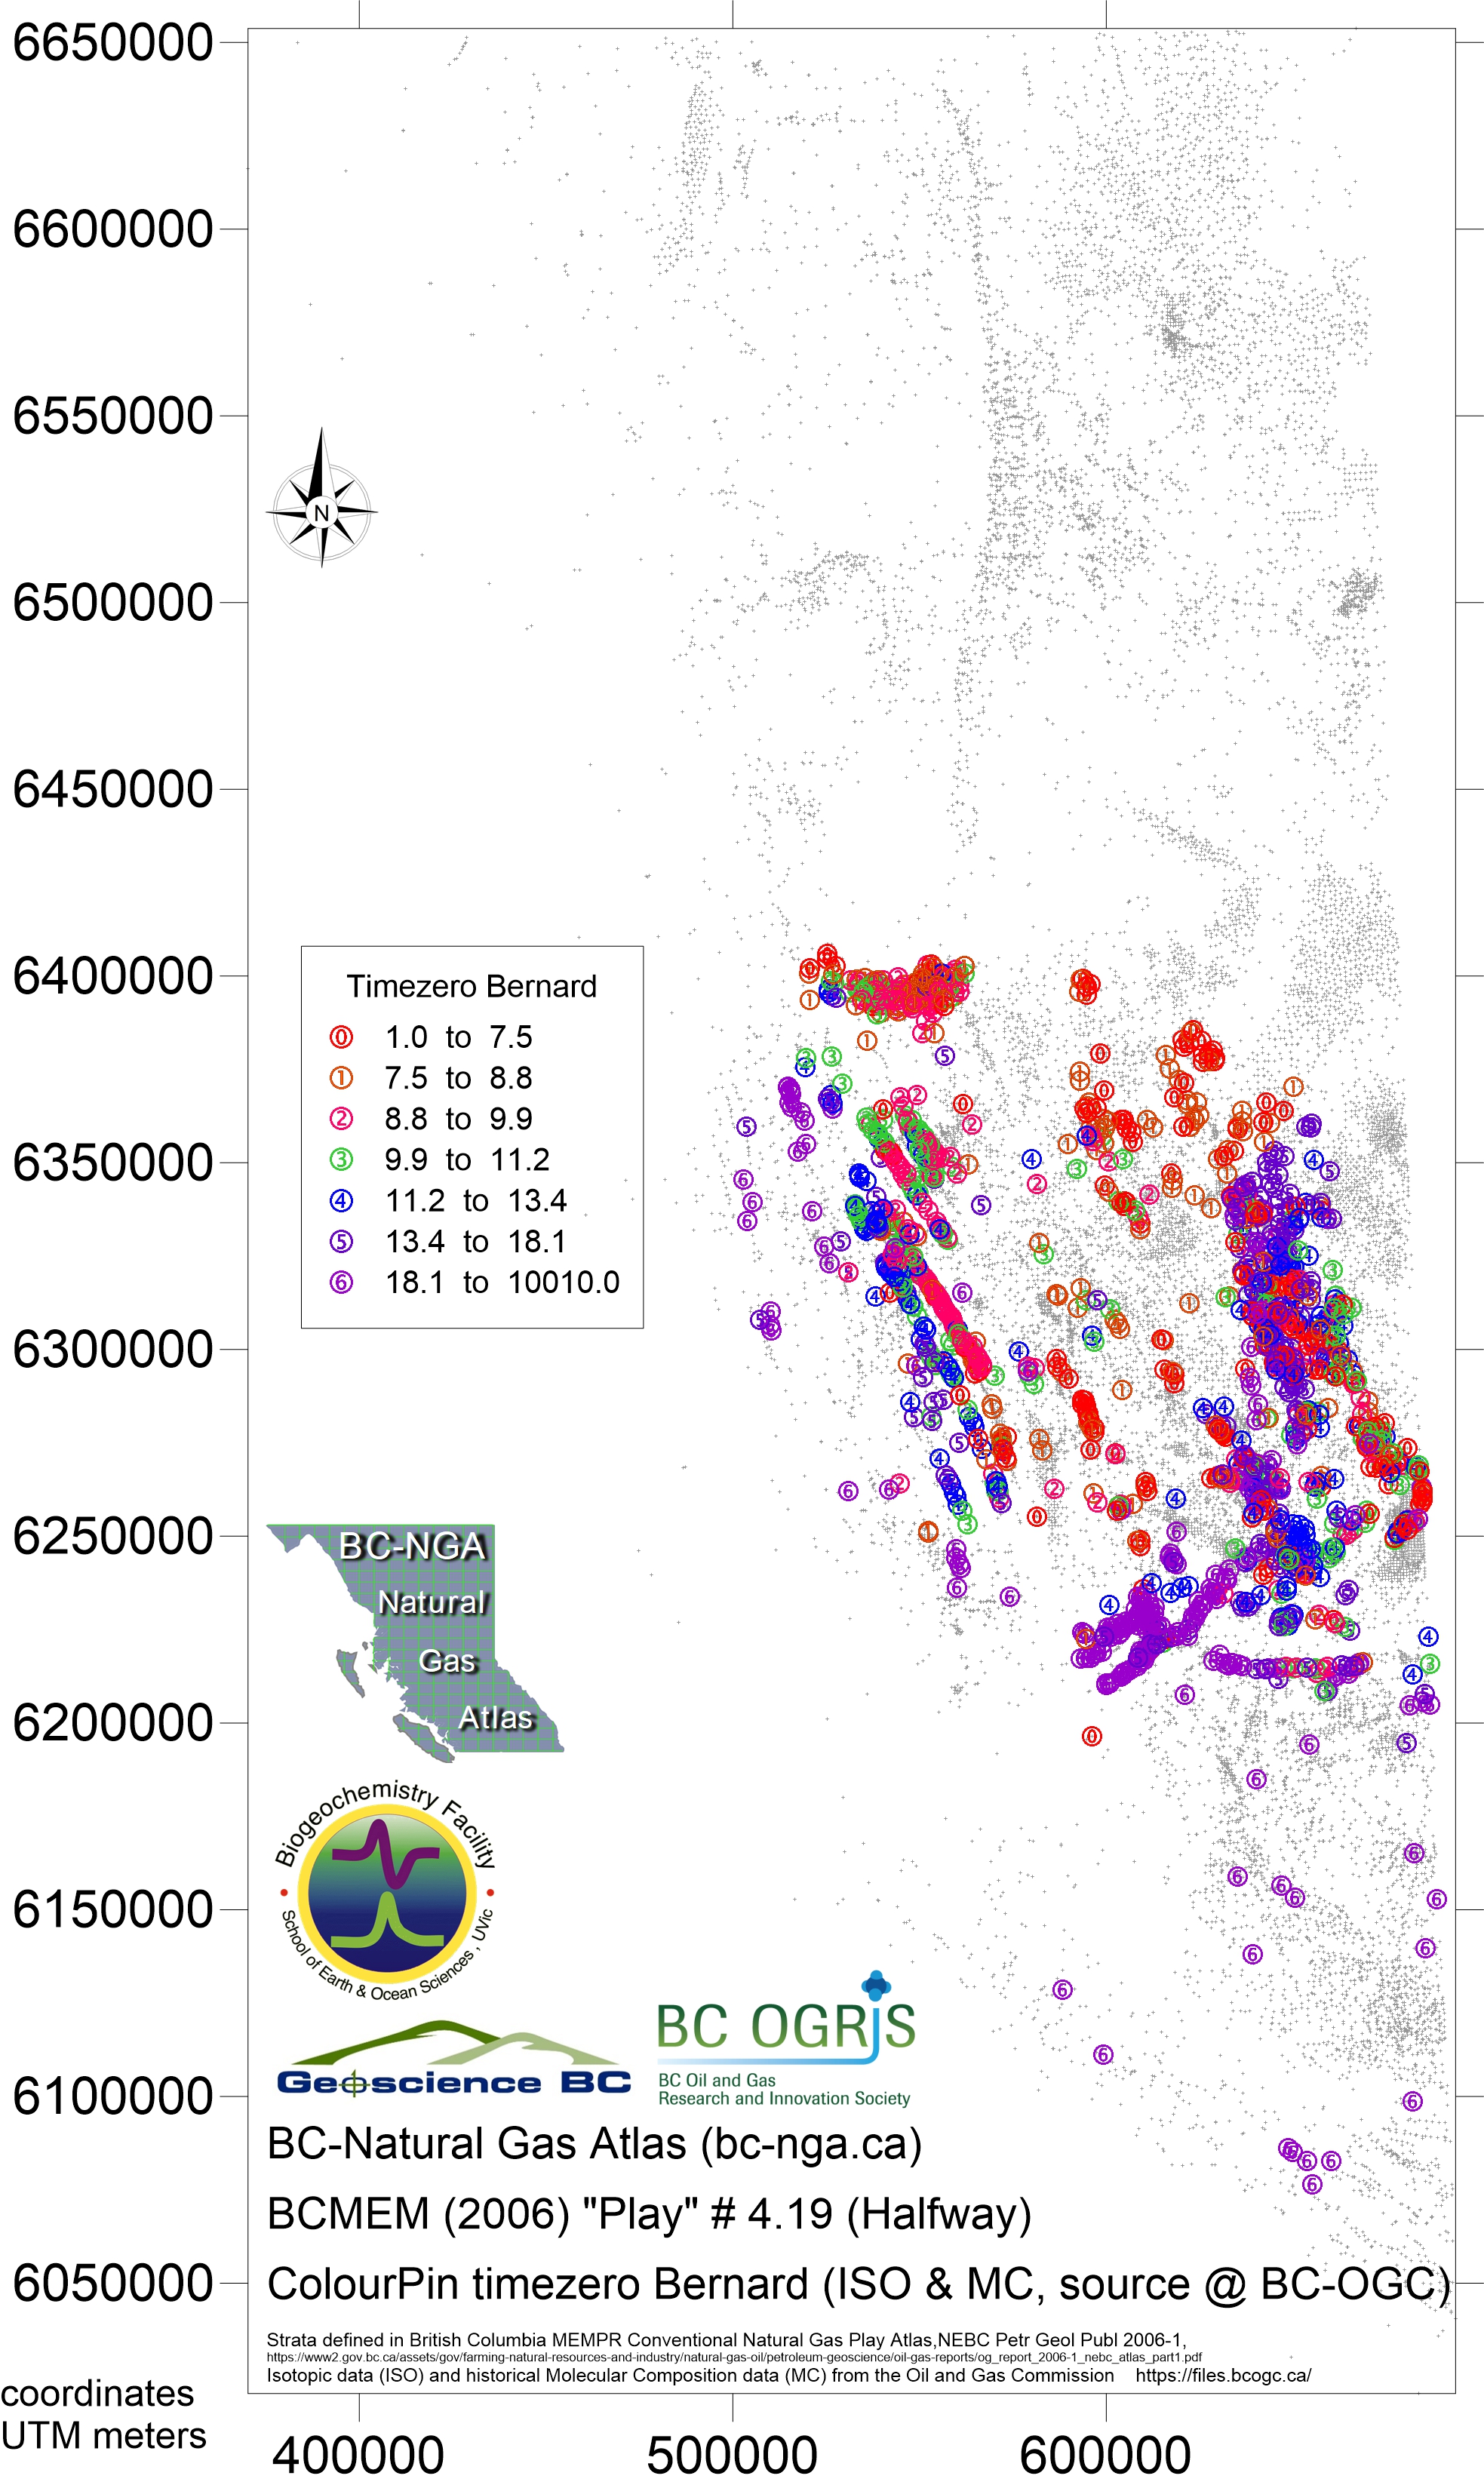
Play 4.19 Halfway Formation and equivalents
- Map154 Nov 2018 play 4.19 Halfway eqv Bernard ratio
- Map155 Nov 2018 play 4.19 Halfway eqv dryness ratio
- Map156 Nov 2018 play 4.19 Halfway eqv iC4nC4 ratio
- Map157 Nov 2018 play 4.19 Halfway eqv ISO ratio
- Map158 Nov 2018 play 4.19 Halfway eqv H2S ppm
- Map159 Nov 2018 play 4.19 Halfway eqv CH4 ppm
- Map160 Nov 2018 play 4.19 Halfway eqv C2H6 ppm
- Map161 Nov 2018 play 4.19 Halfway eqv C3H8 ppm
- Map162 Nov 2018 play 4.19 Halfway eqv iC4H10 ppm
- Map163 Nov 2018 play 4.19 Halfway eqv nC4H10 ppm
- Map164 Nov 2018 play 4.19 Halfway eqv iC5H12 ppm
- Map165 Nov 2018 play 4.19 Halfway eqv nC5H12 ppm
- Map166 Nov 2018 play 4.19 Halfway eqv C6H14 plus ppm
- Map167 Nov 2018 play 4.19 Halfway eqv CO2 ppm
- Map168 Nov 2018 play 4.19 Halfway eqv δ13CH4
- Map169 Nov 2018 play 4.19 Halfway eqv δ13C2H6
- Map170 Nov 2018 play 4.19 Halfway eqv δ13C3H8
- Map171 Nov 2018 play 4.19 Halfway eqv time series gradient Bernard ratio
- Map172 Nov 2018 play 4.19 Halfway eqv time series gradient CO2
- Map173 Nov 2018 play 4.19 Halfway eqv time series gradient H2S
- Map174 Nov 2018 play 4.19 Halfway eqv time series start point Bernard ratio
- Map175 Nov 2018 play 4.19 Halfway eqv time series start point CO2
- Map176 Nov 2018 play 4.19 Halfway eqv time series start point H2S
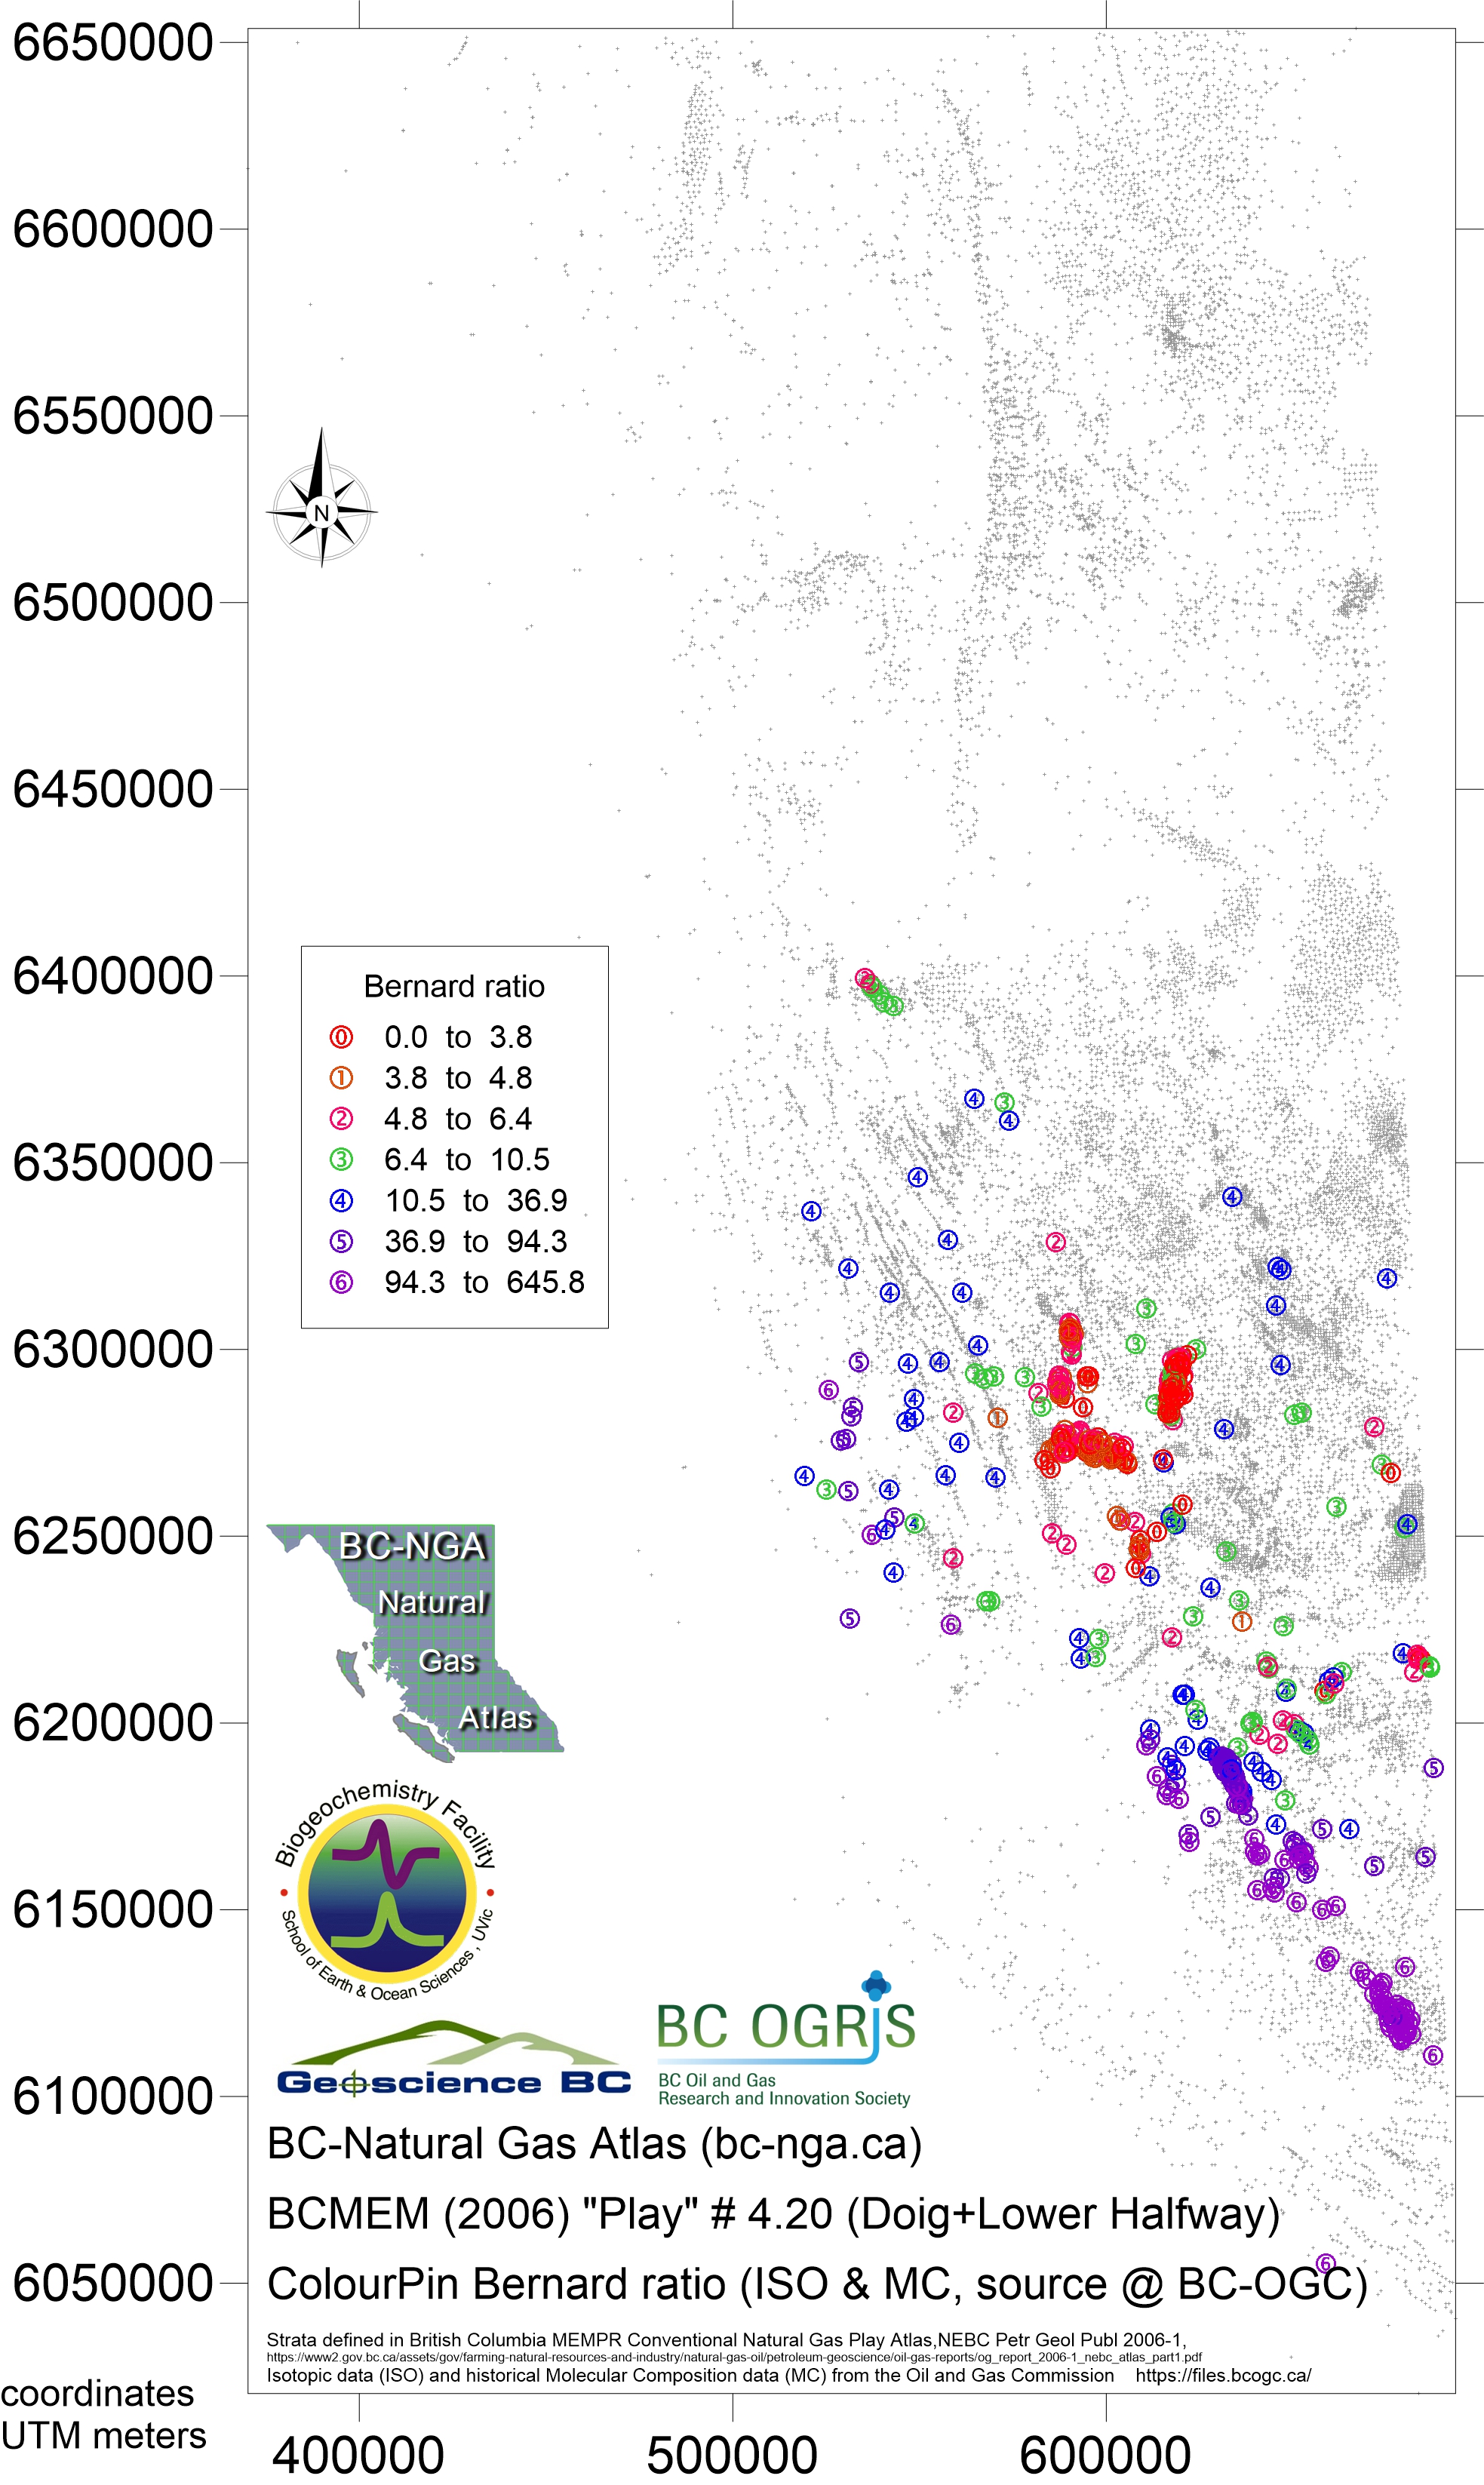
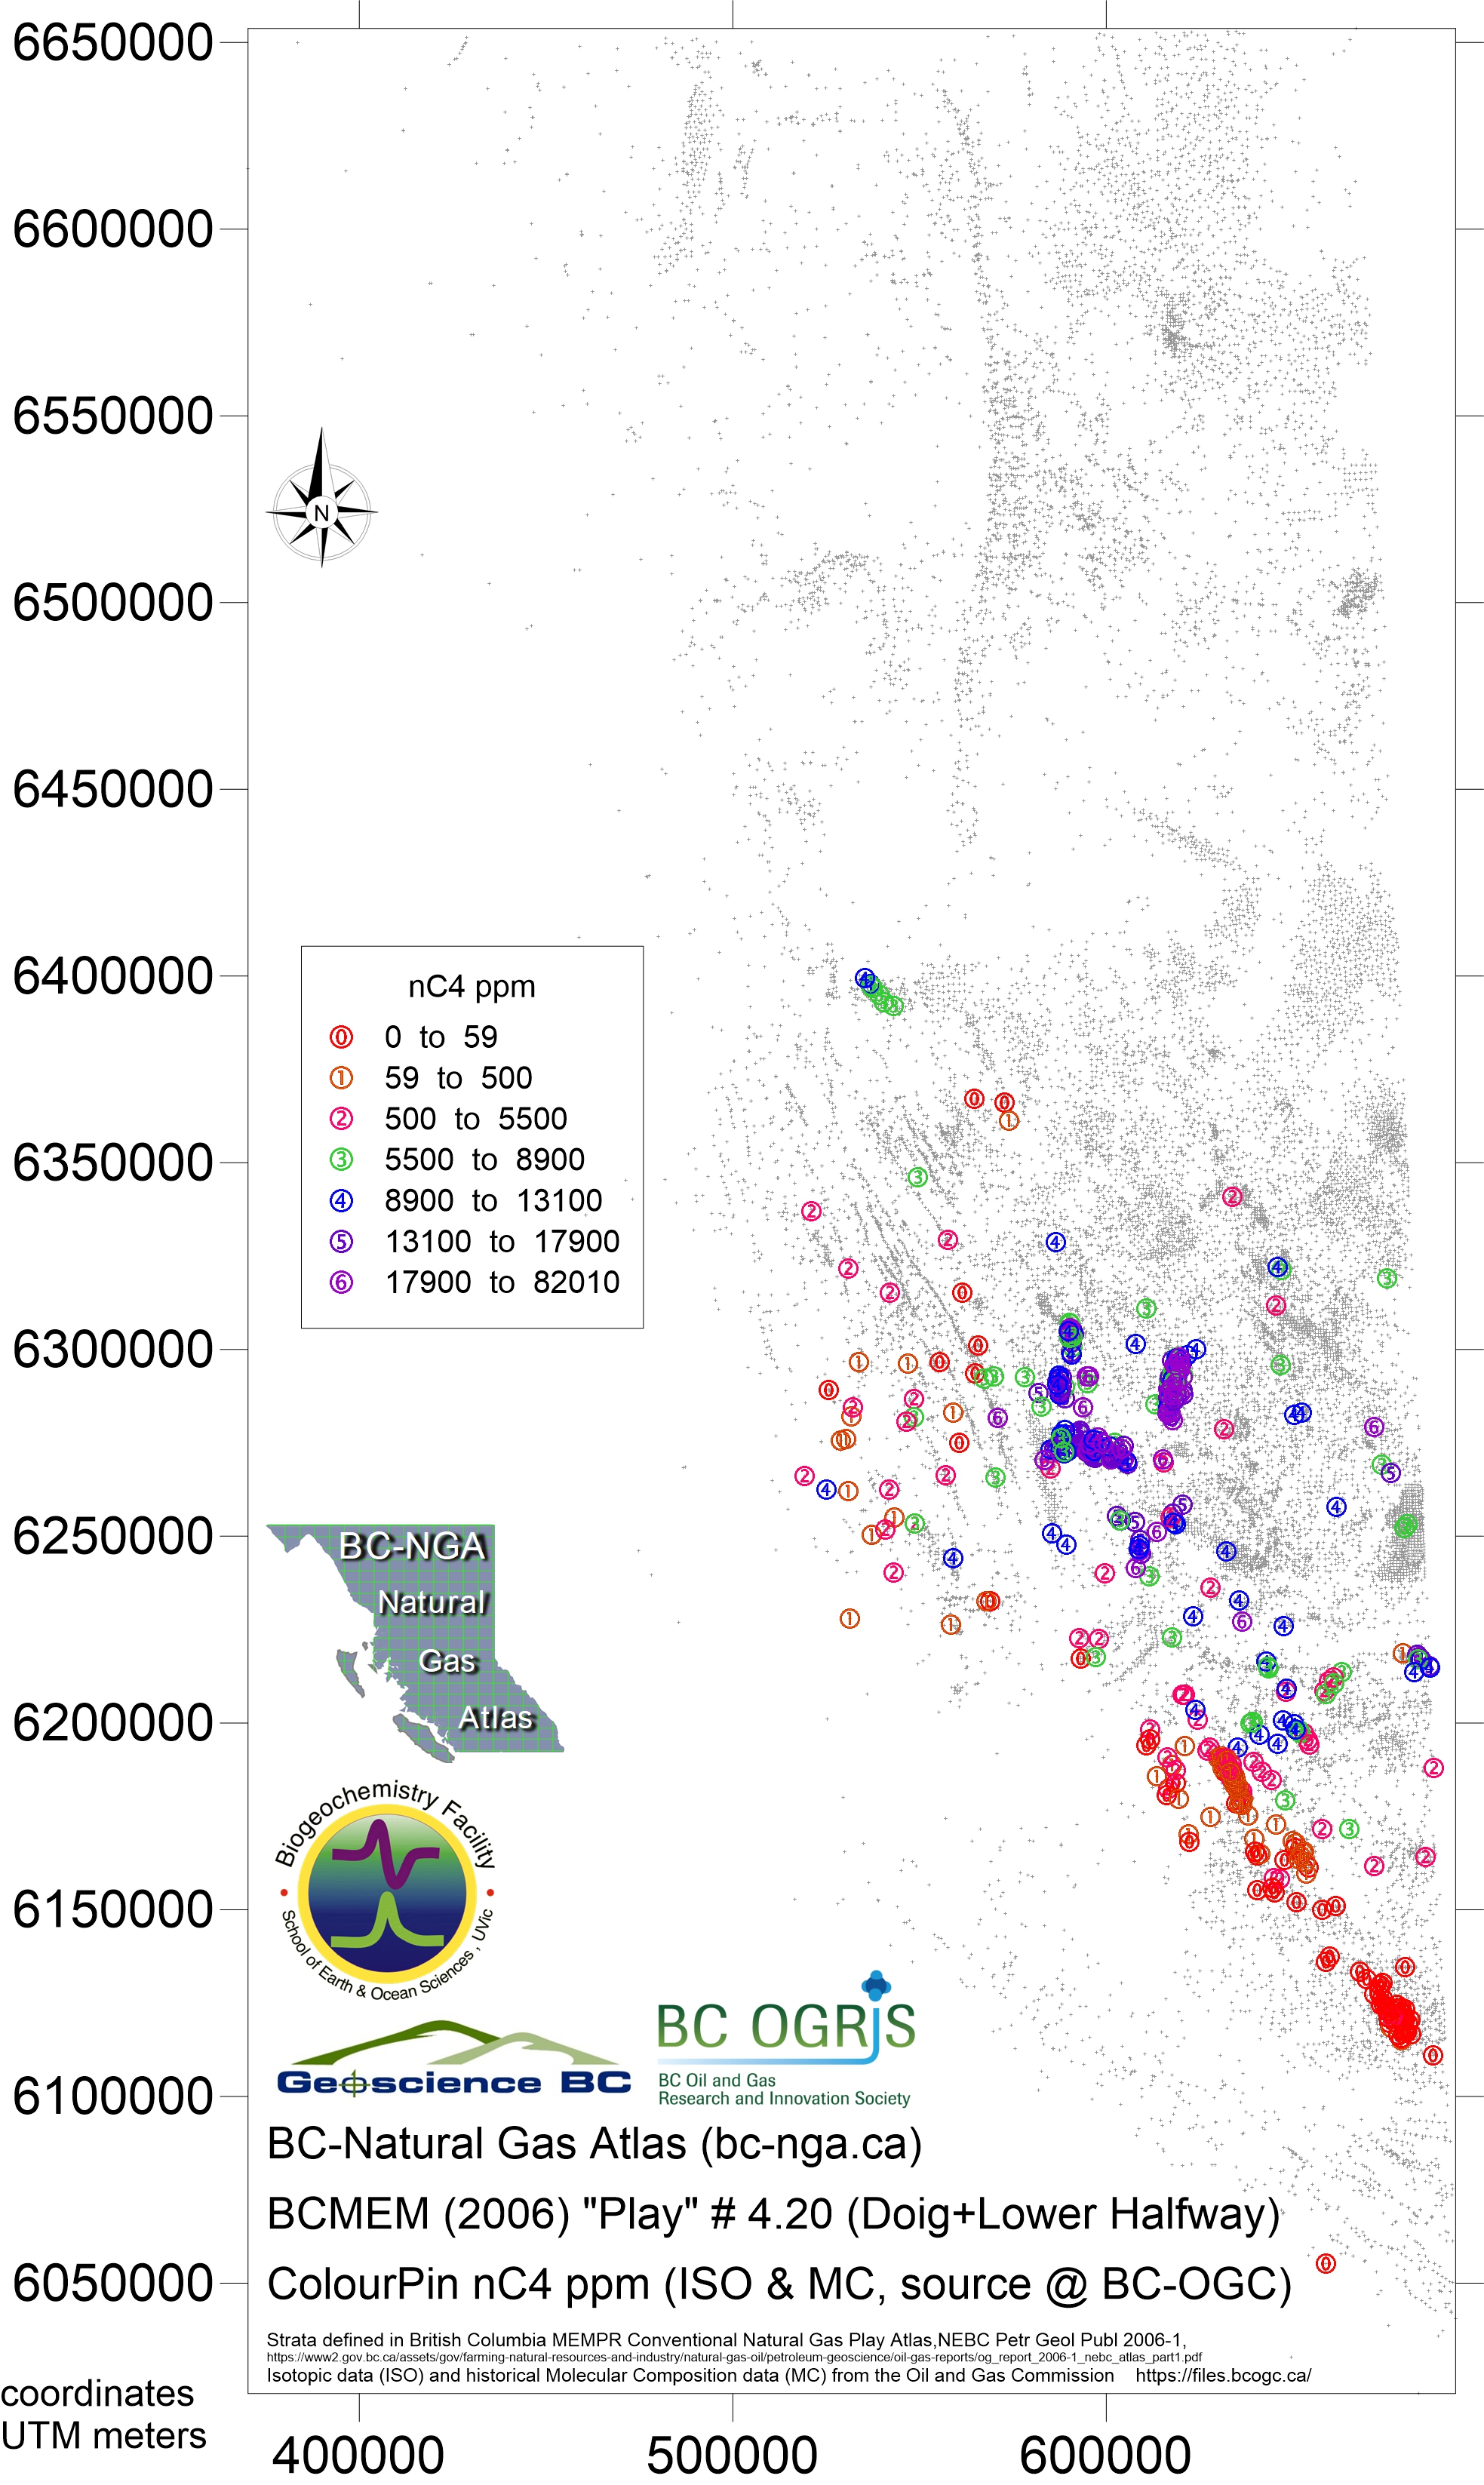
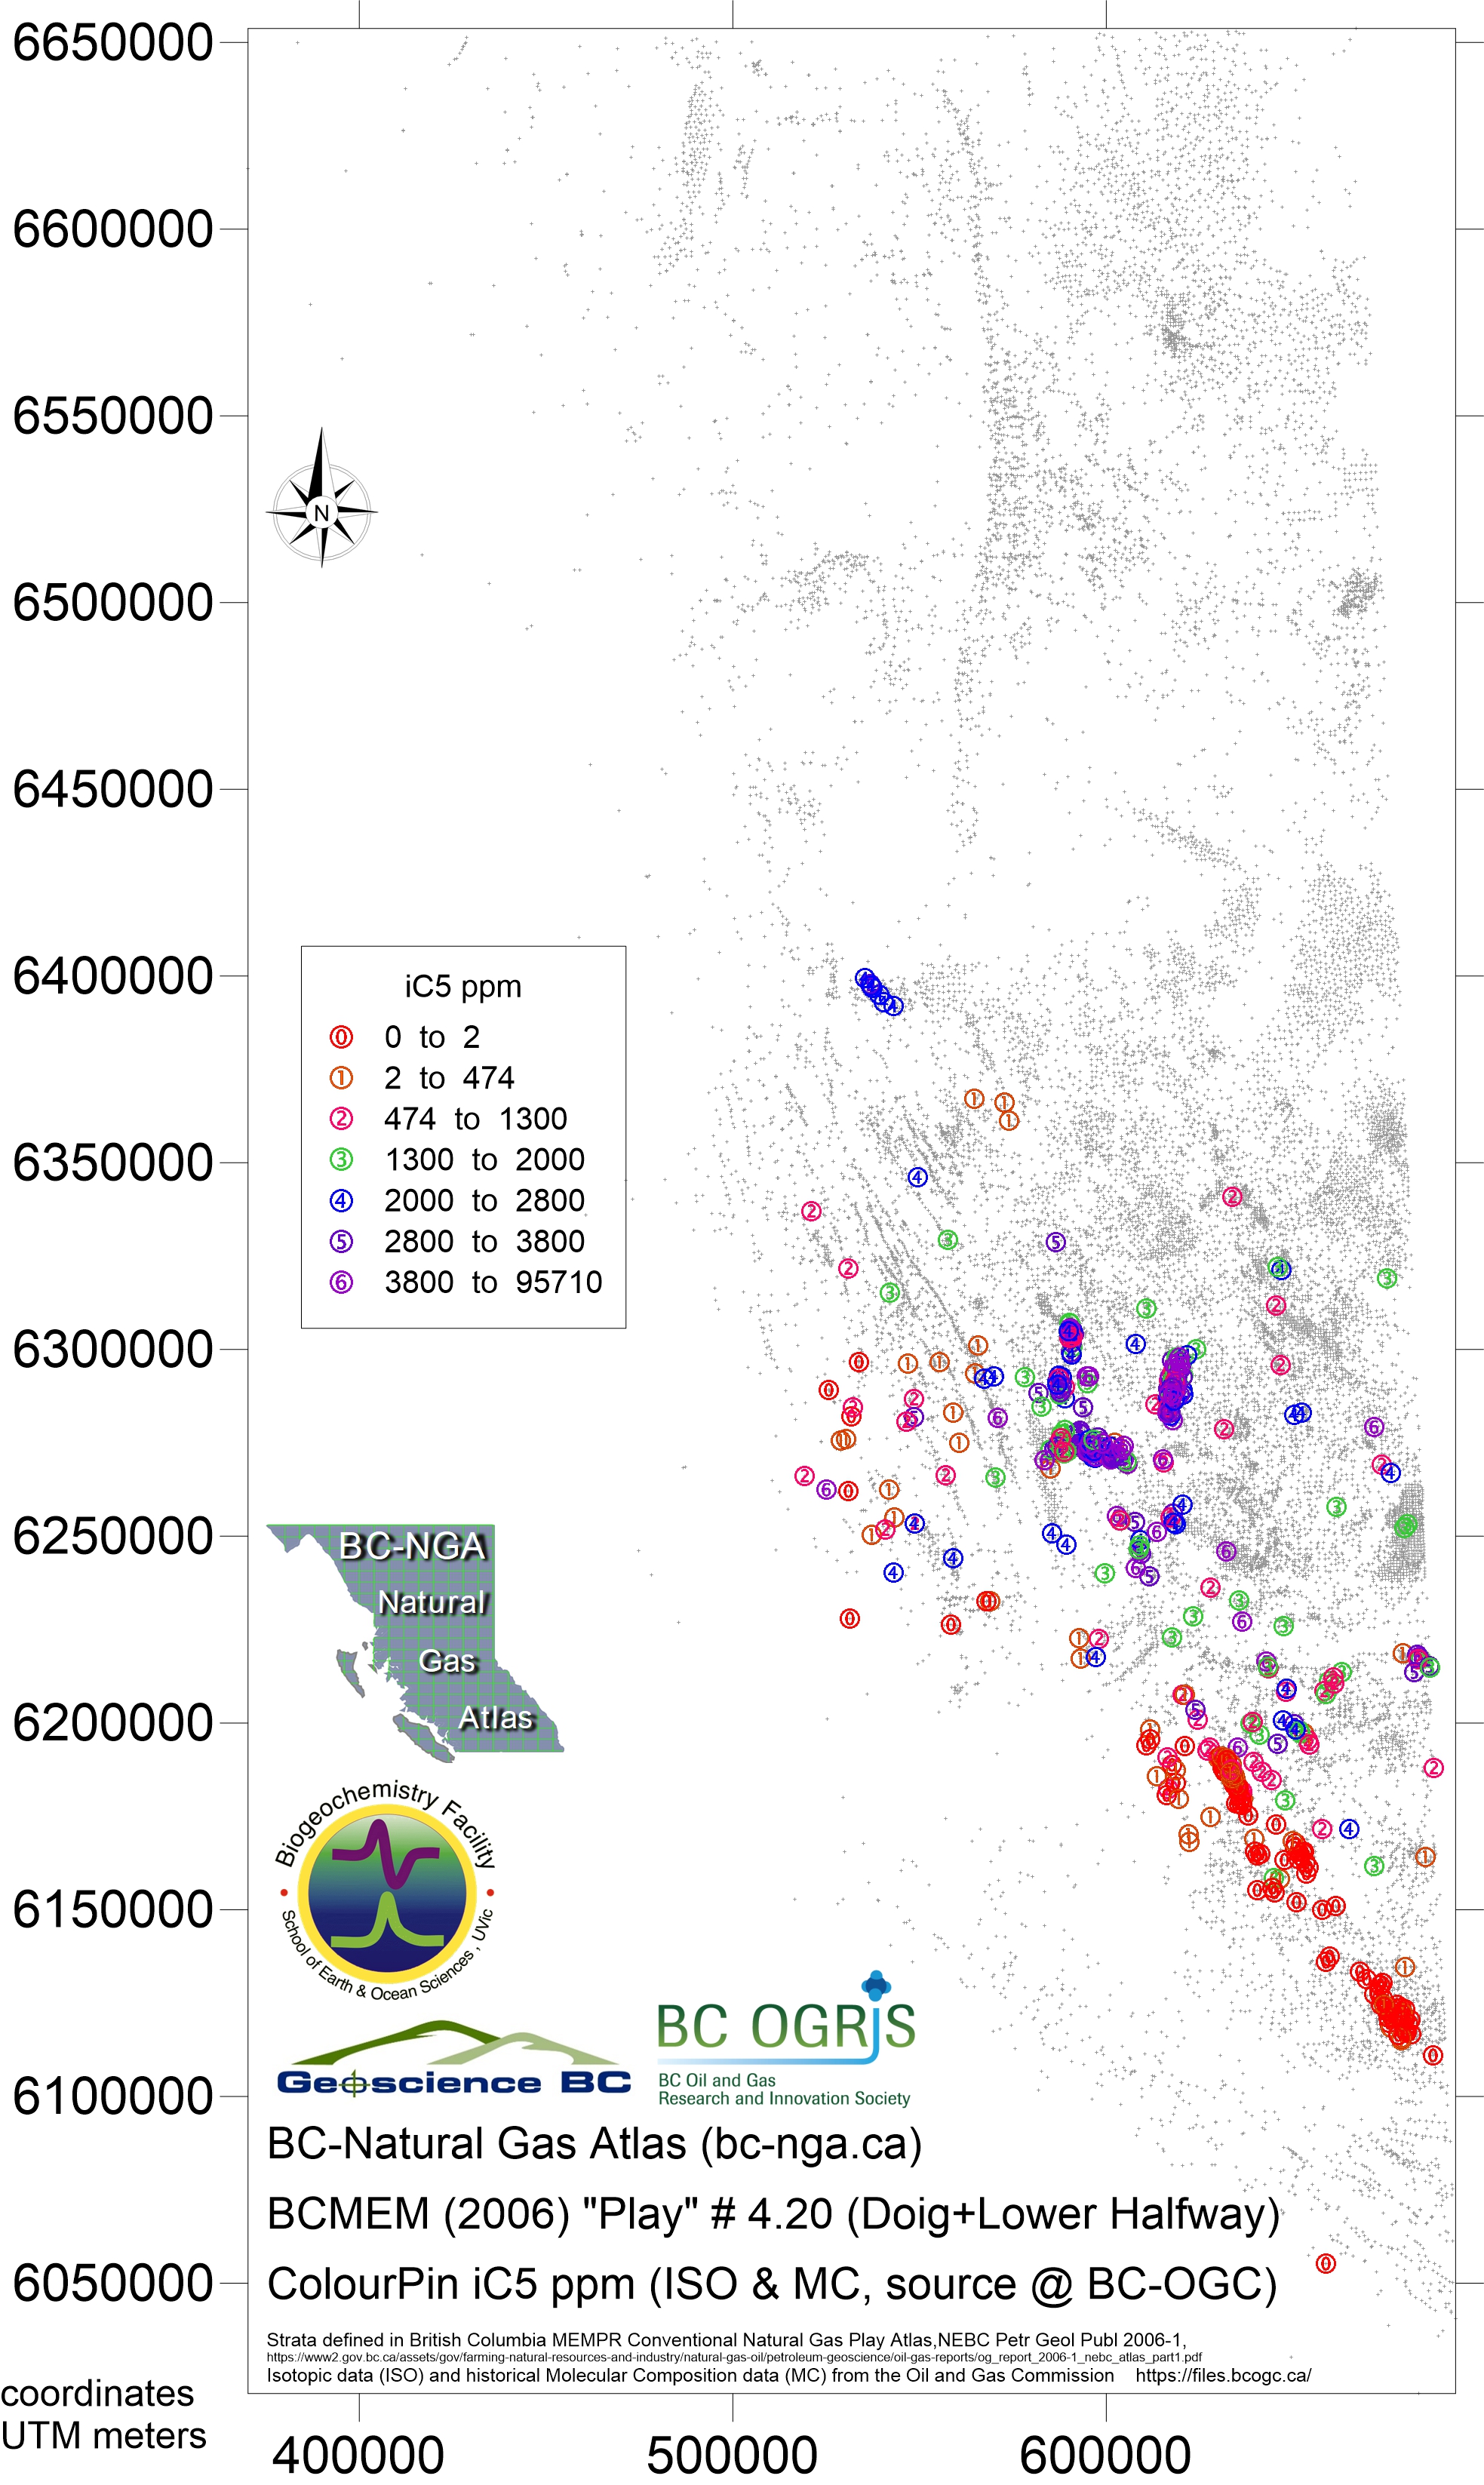
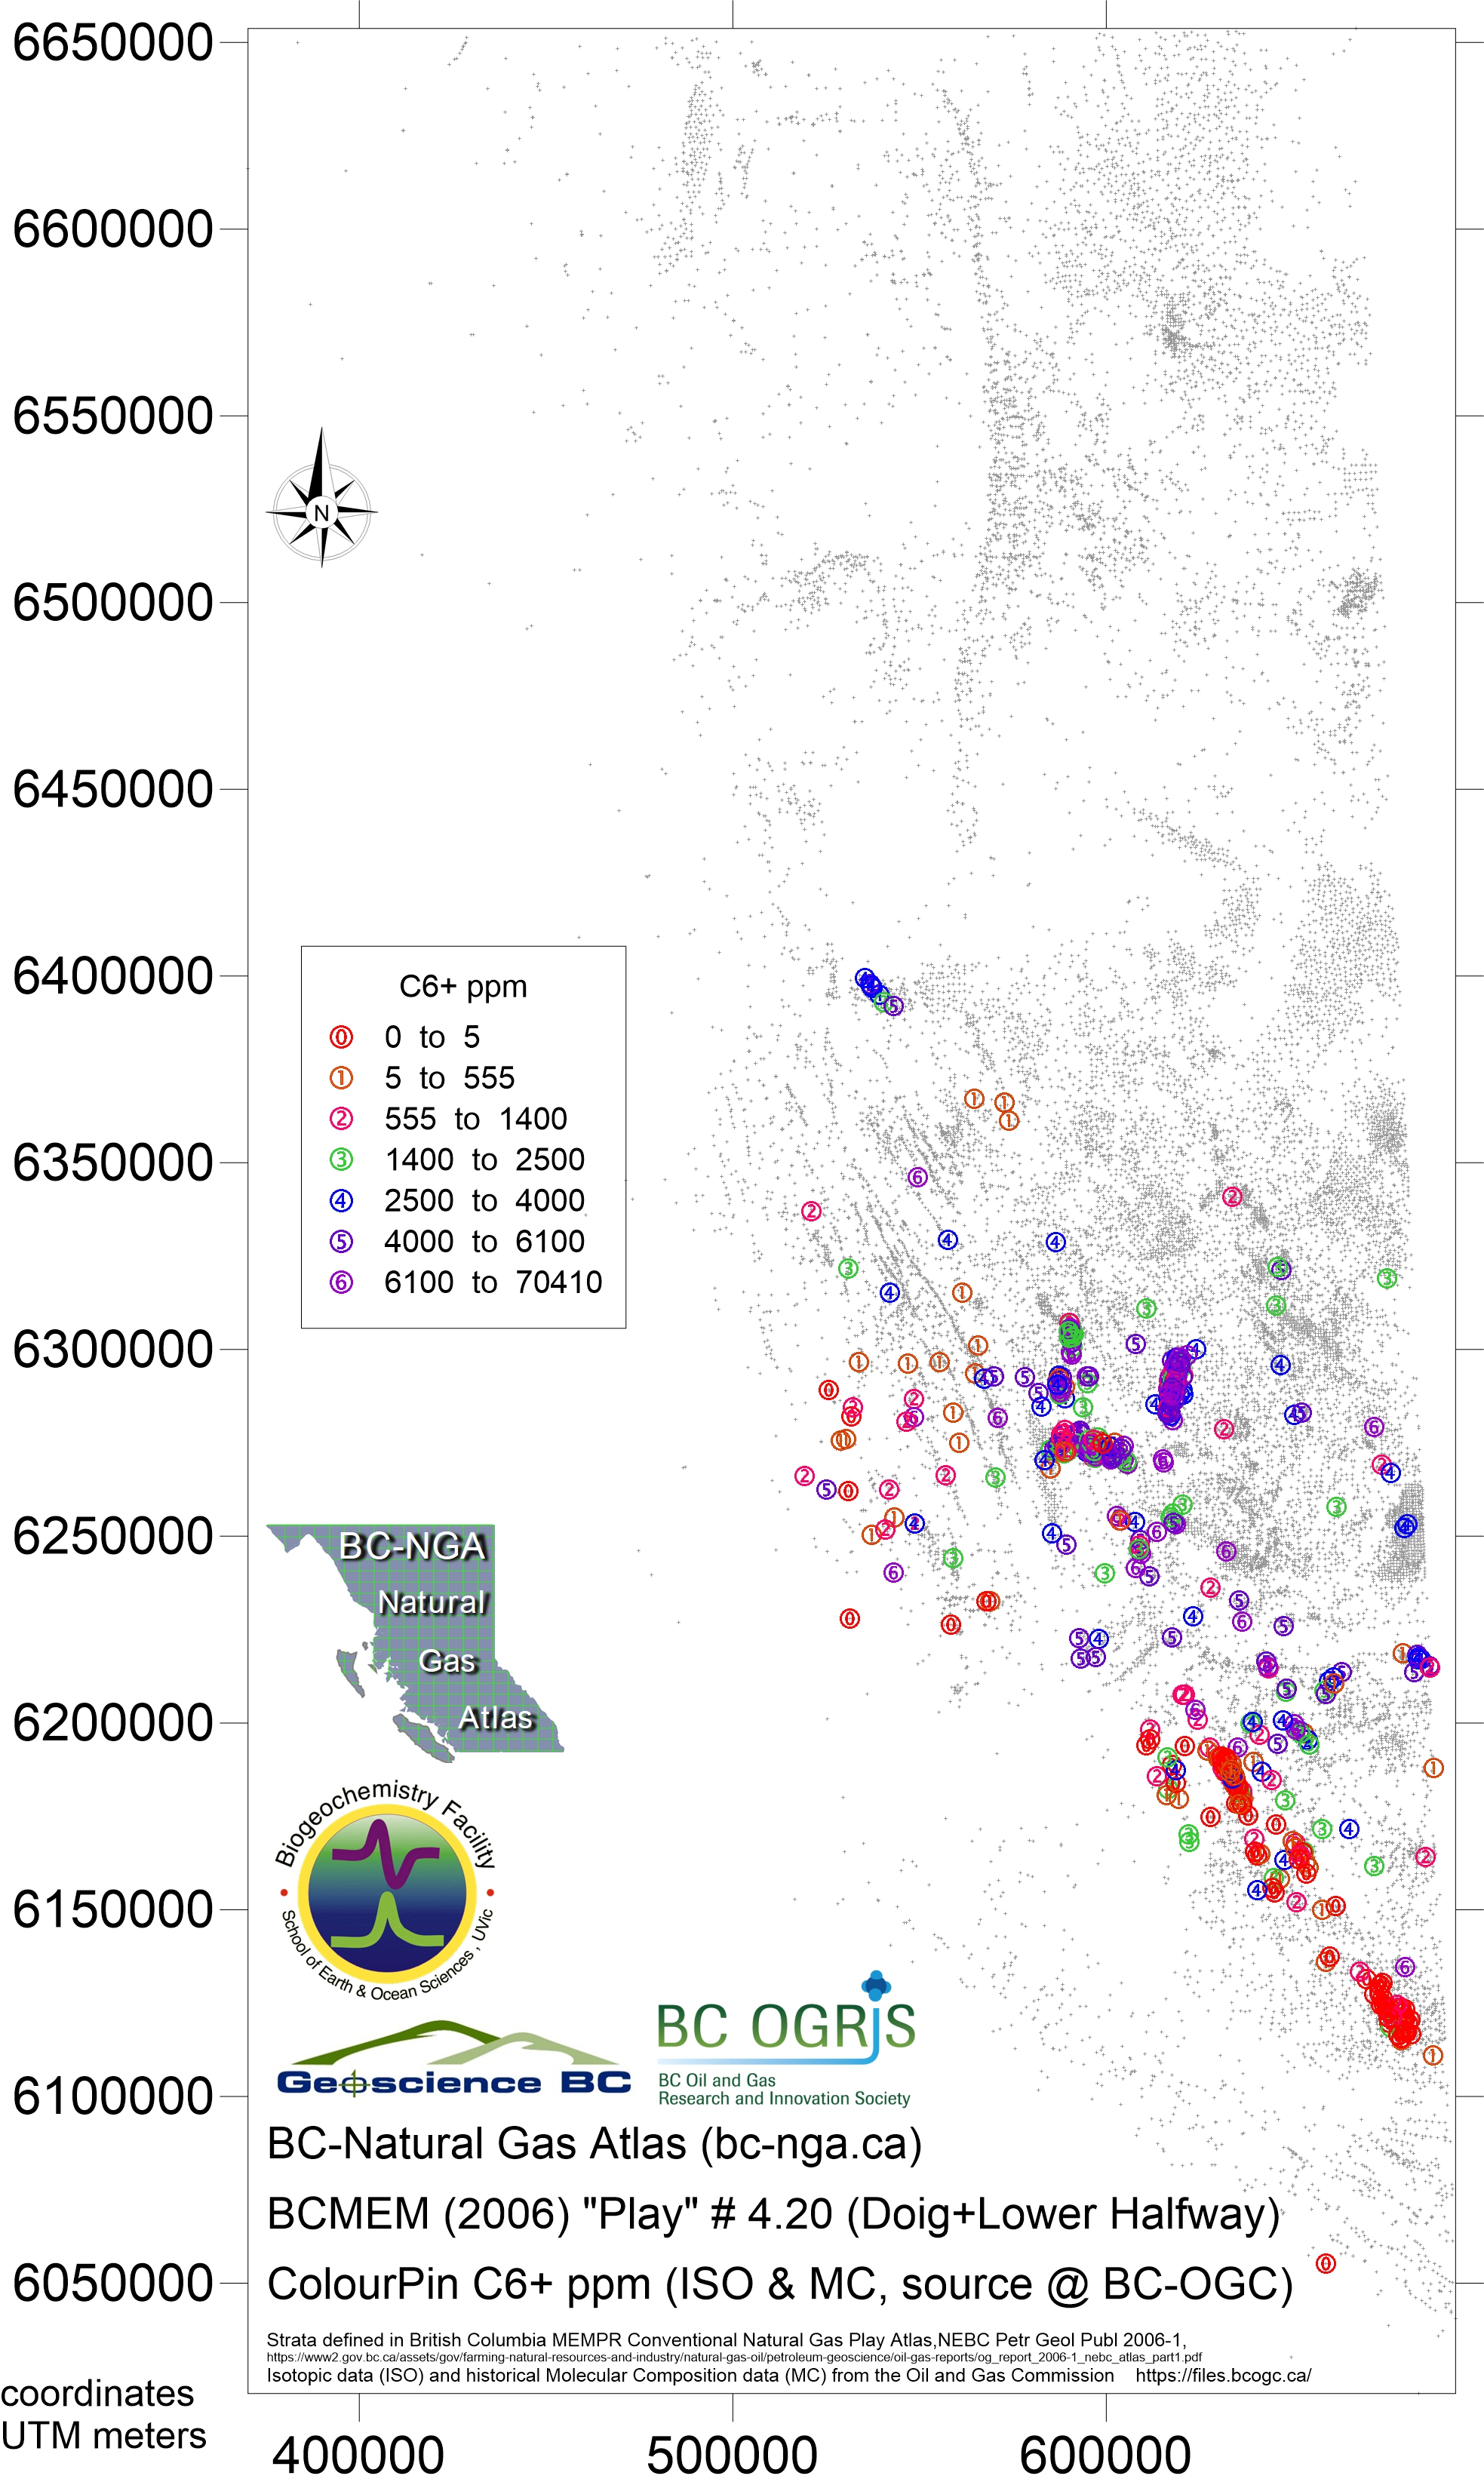
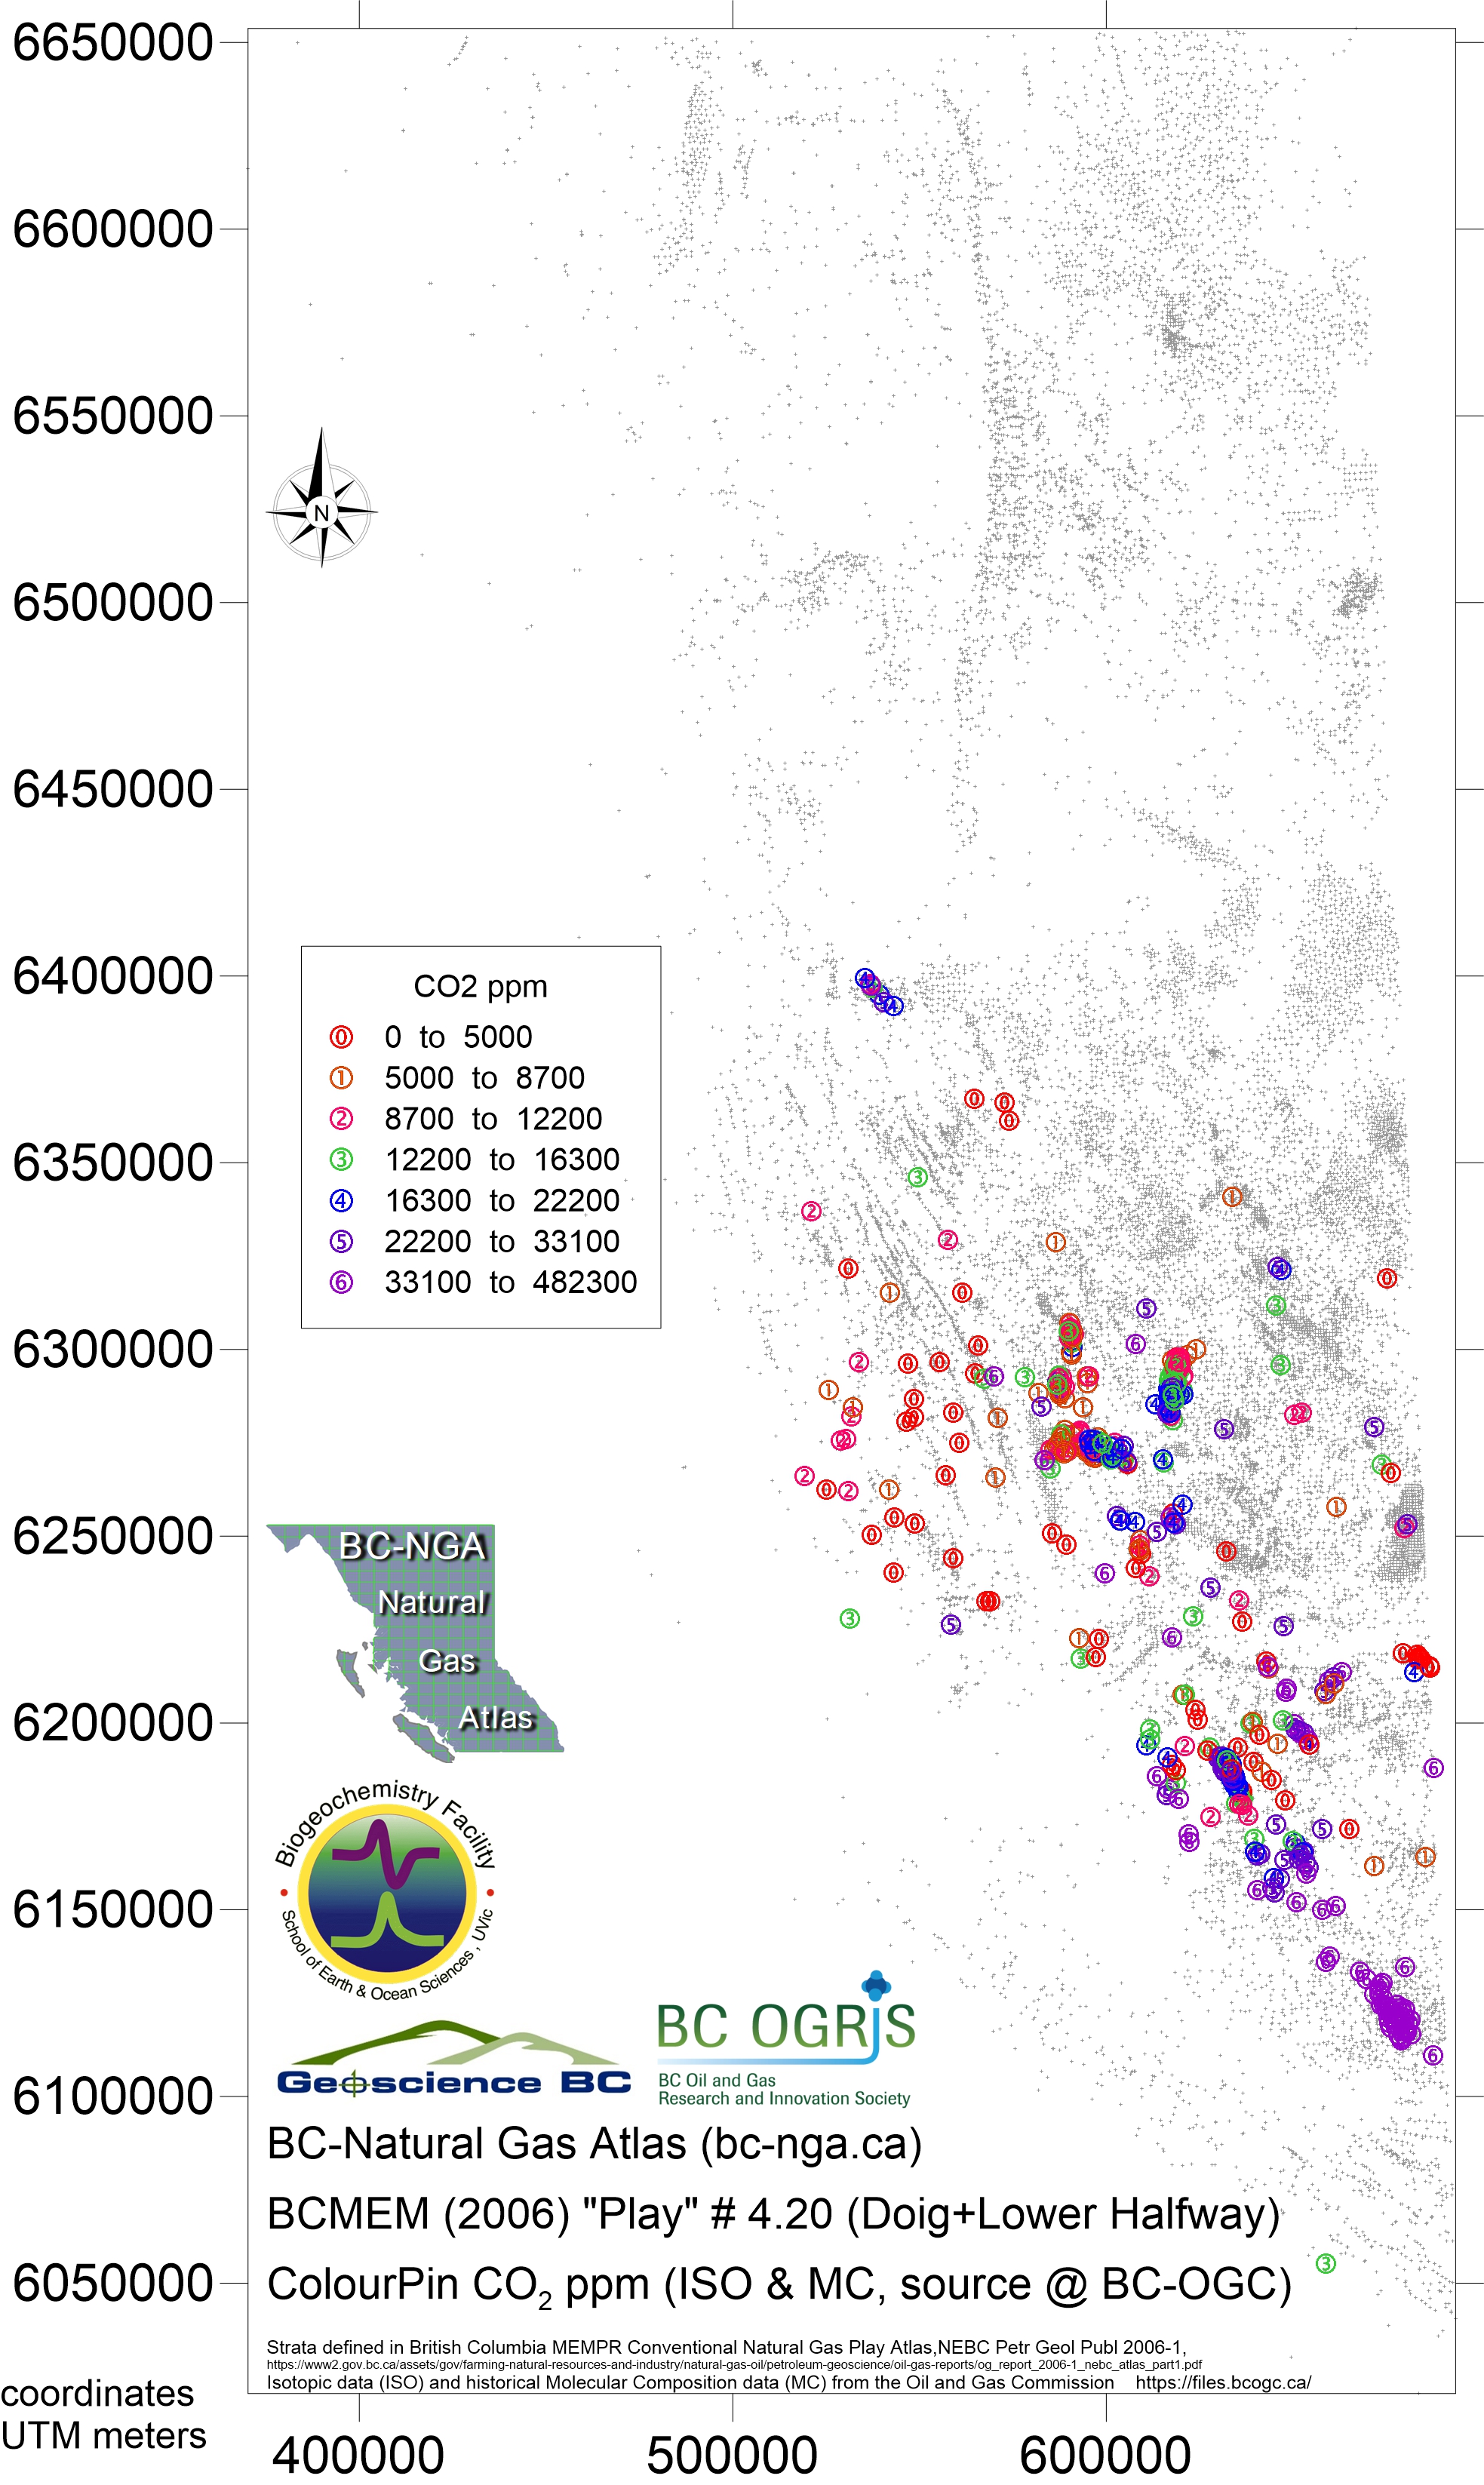
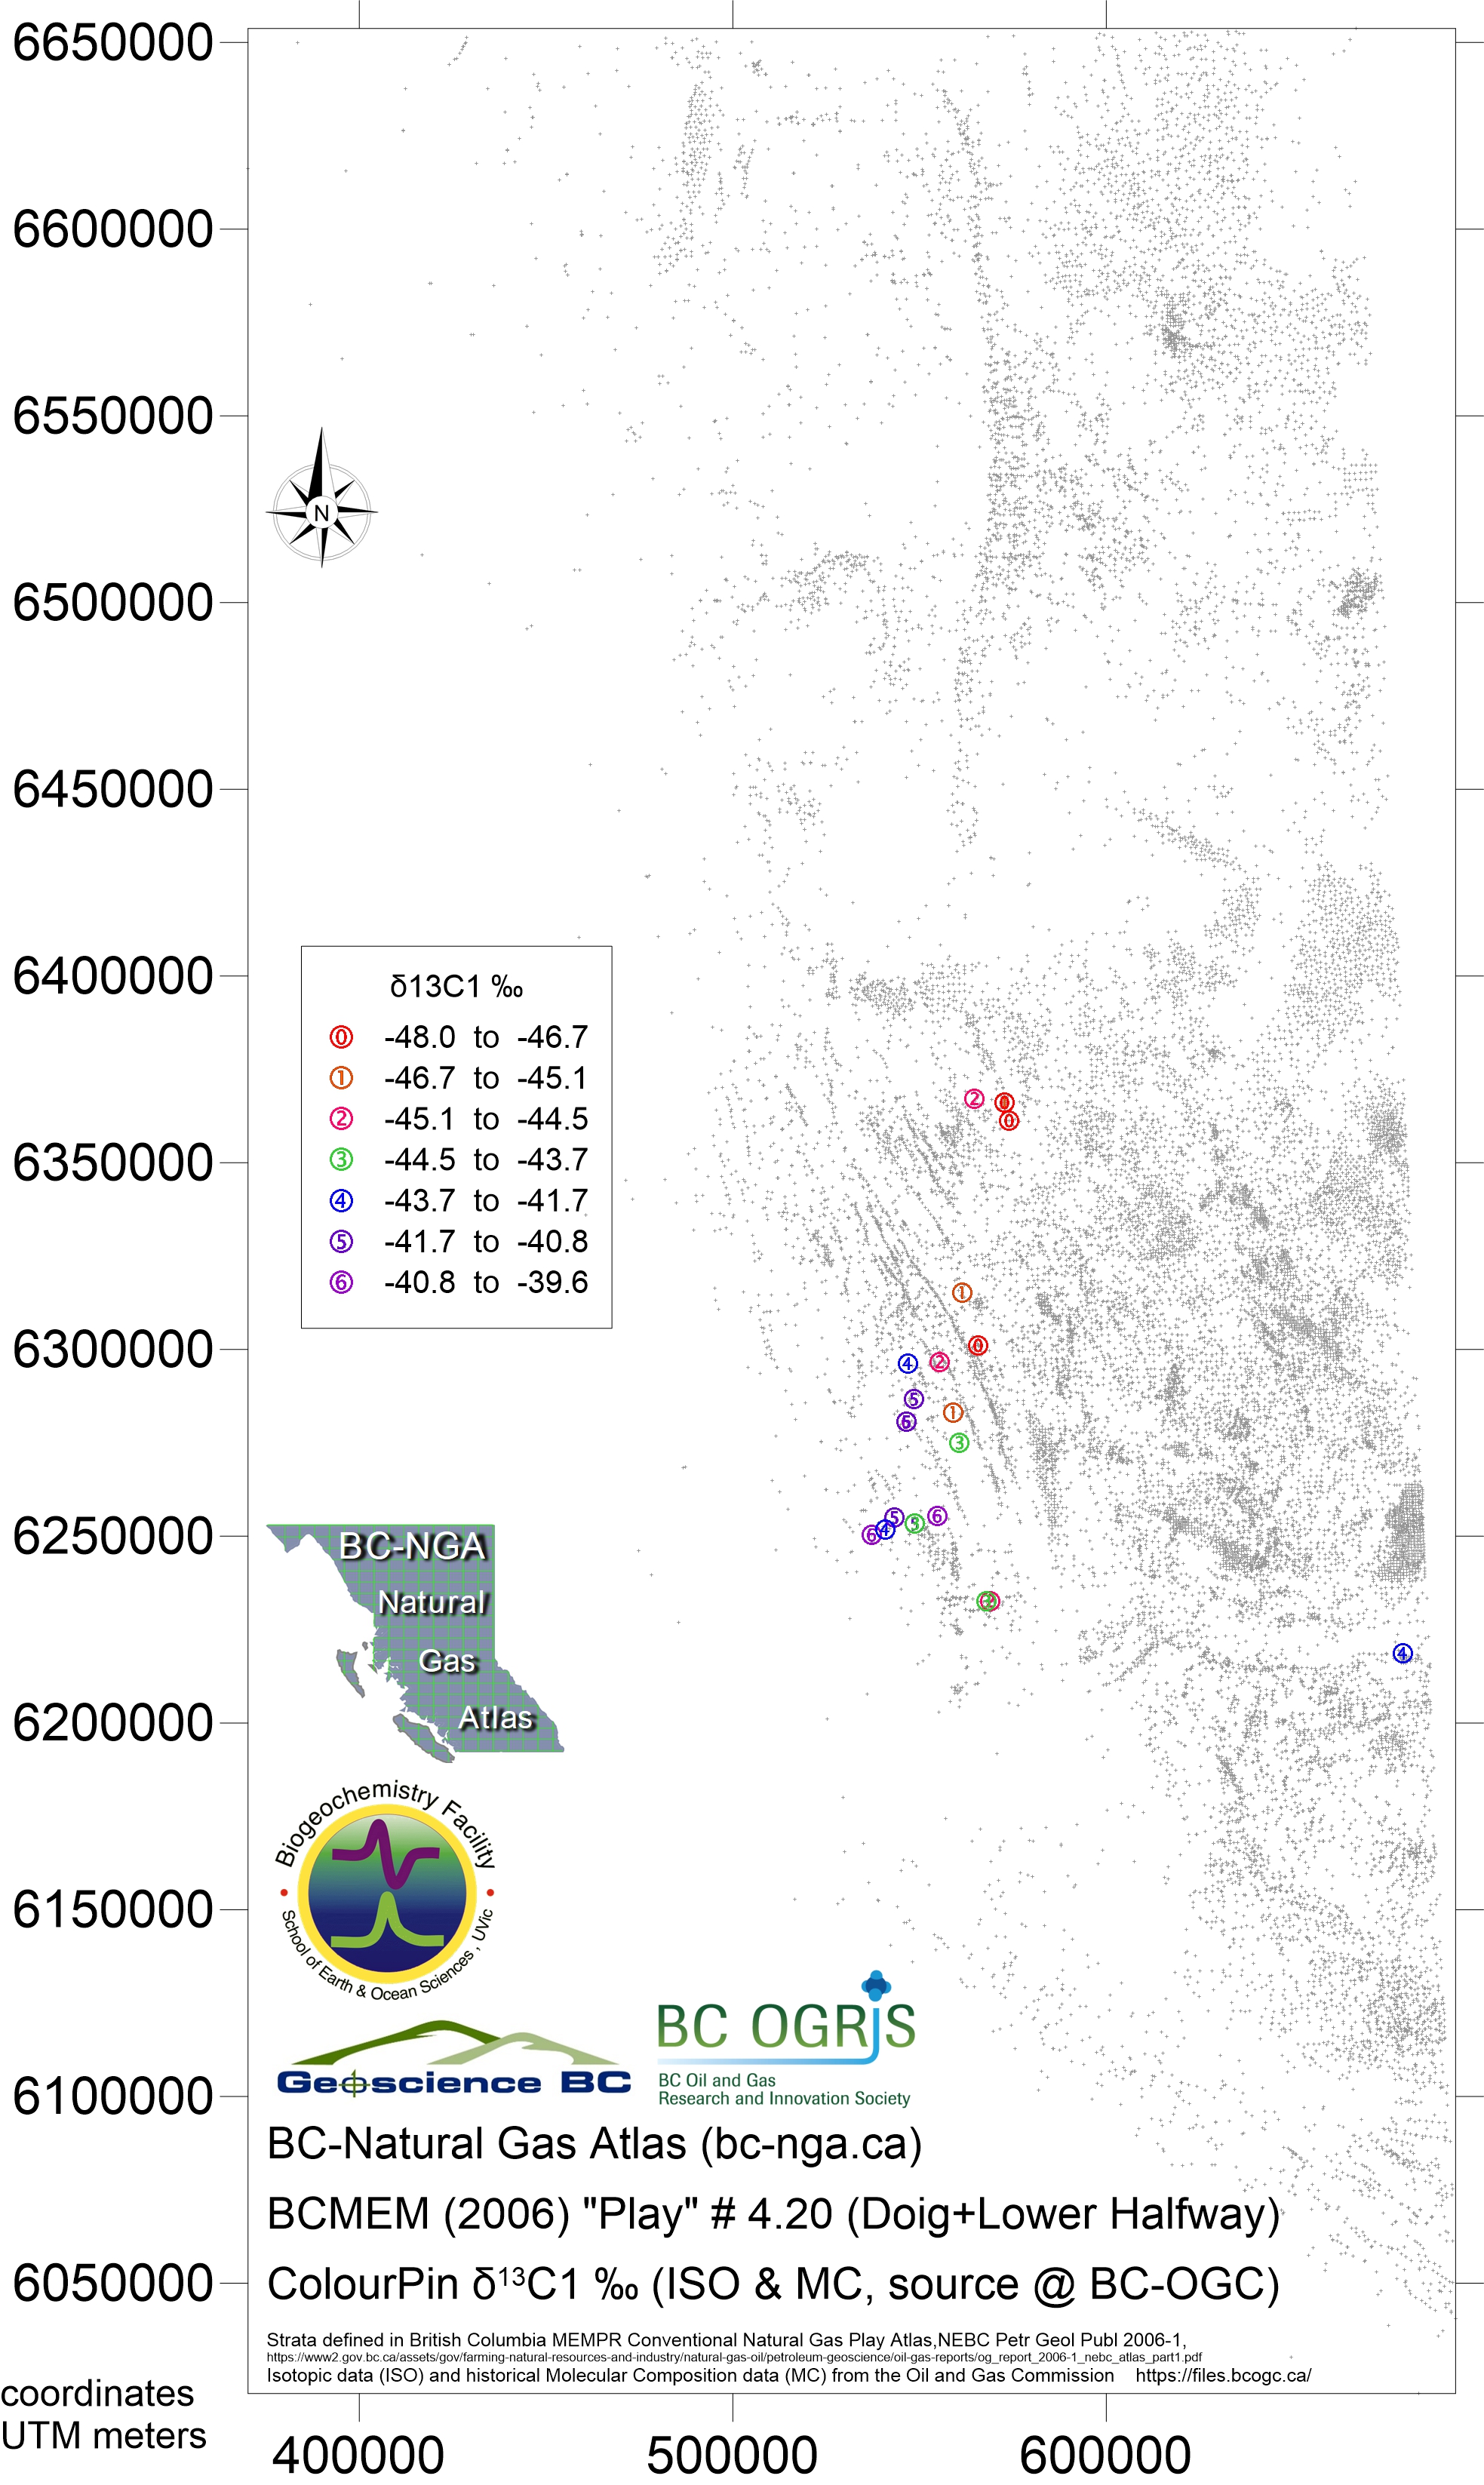
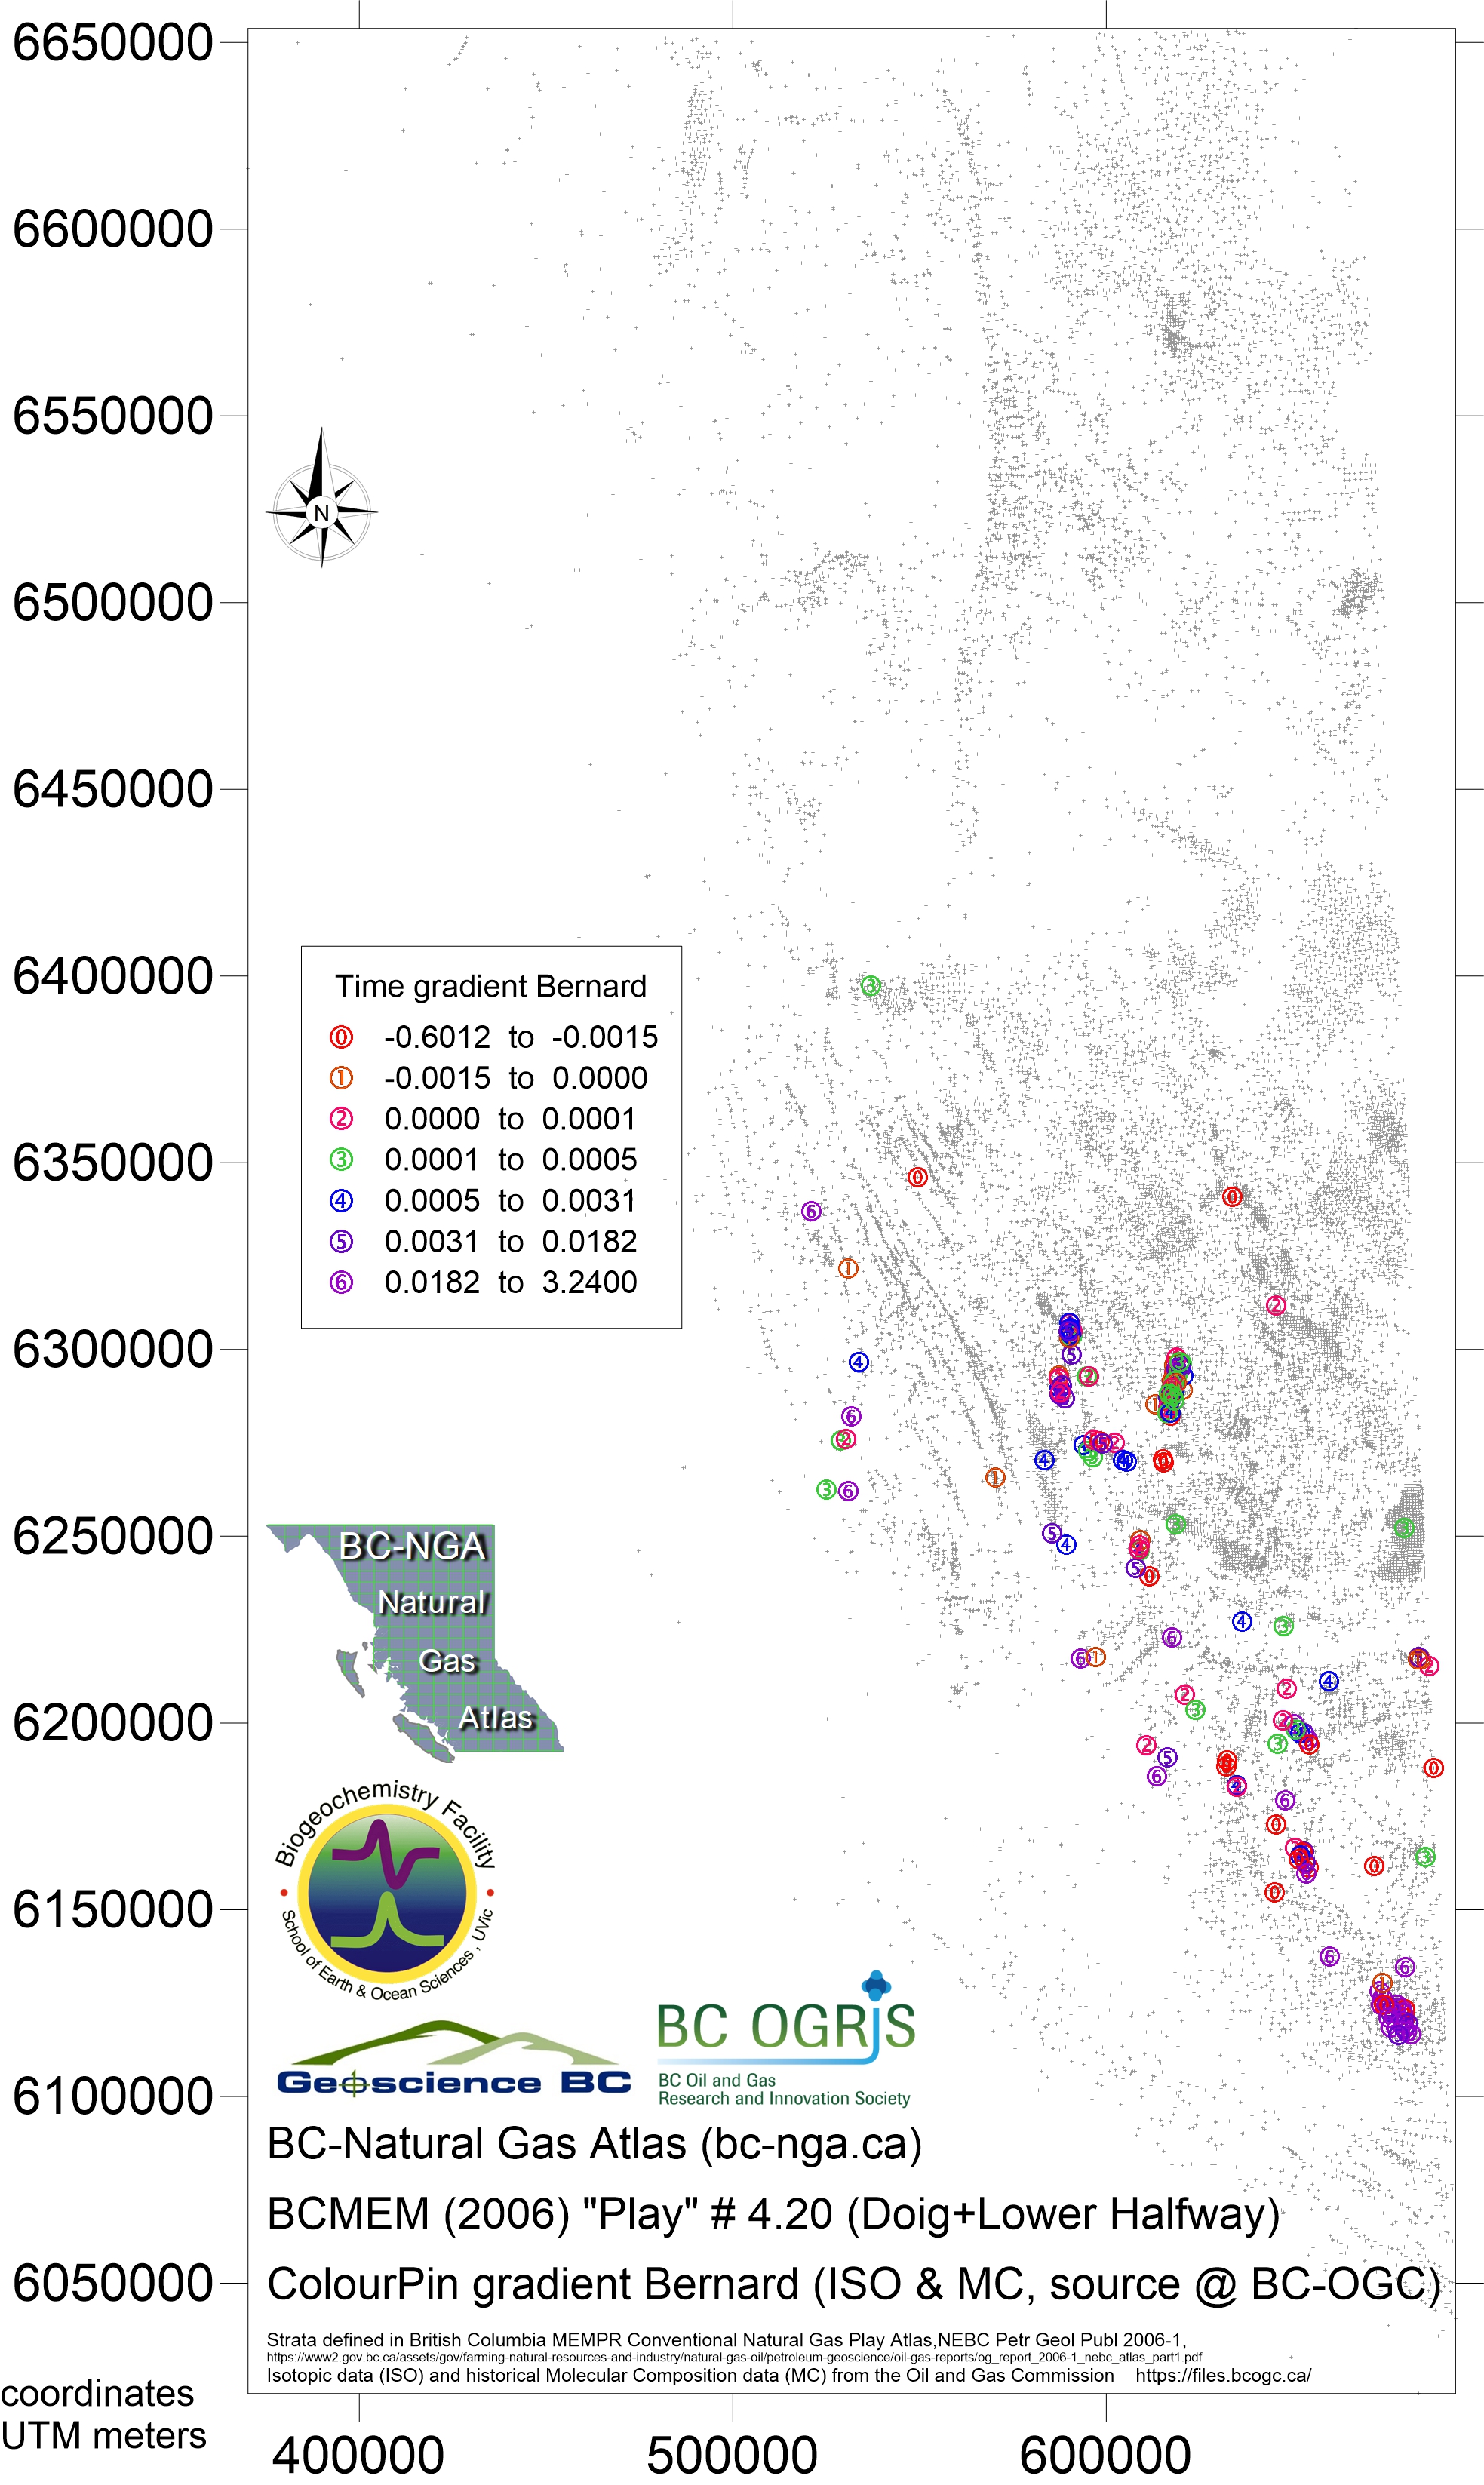
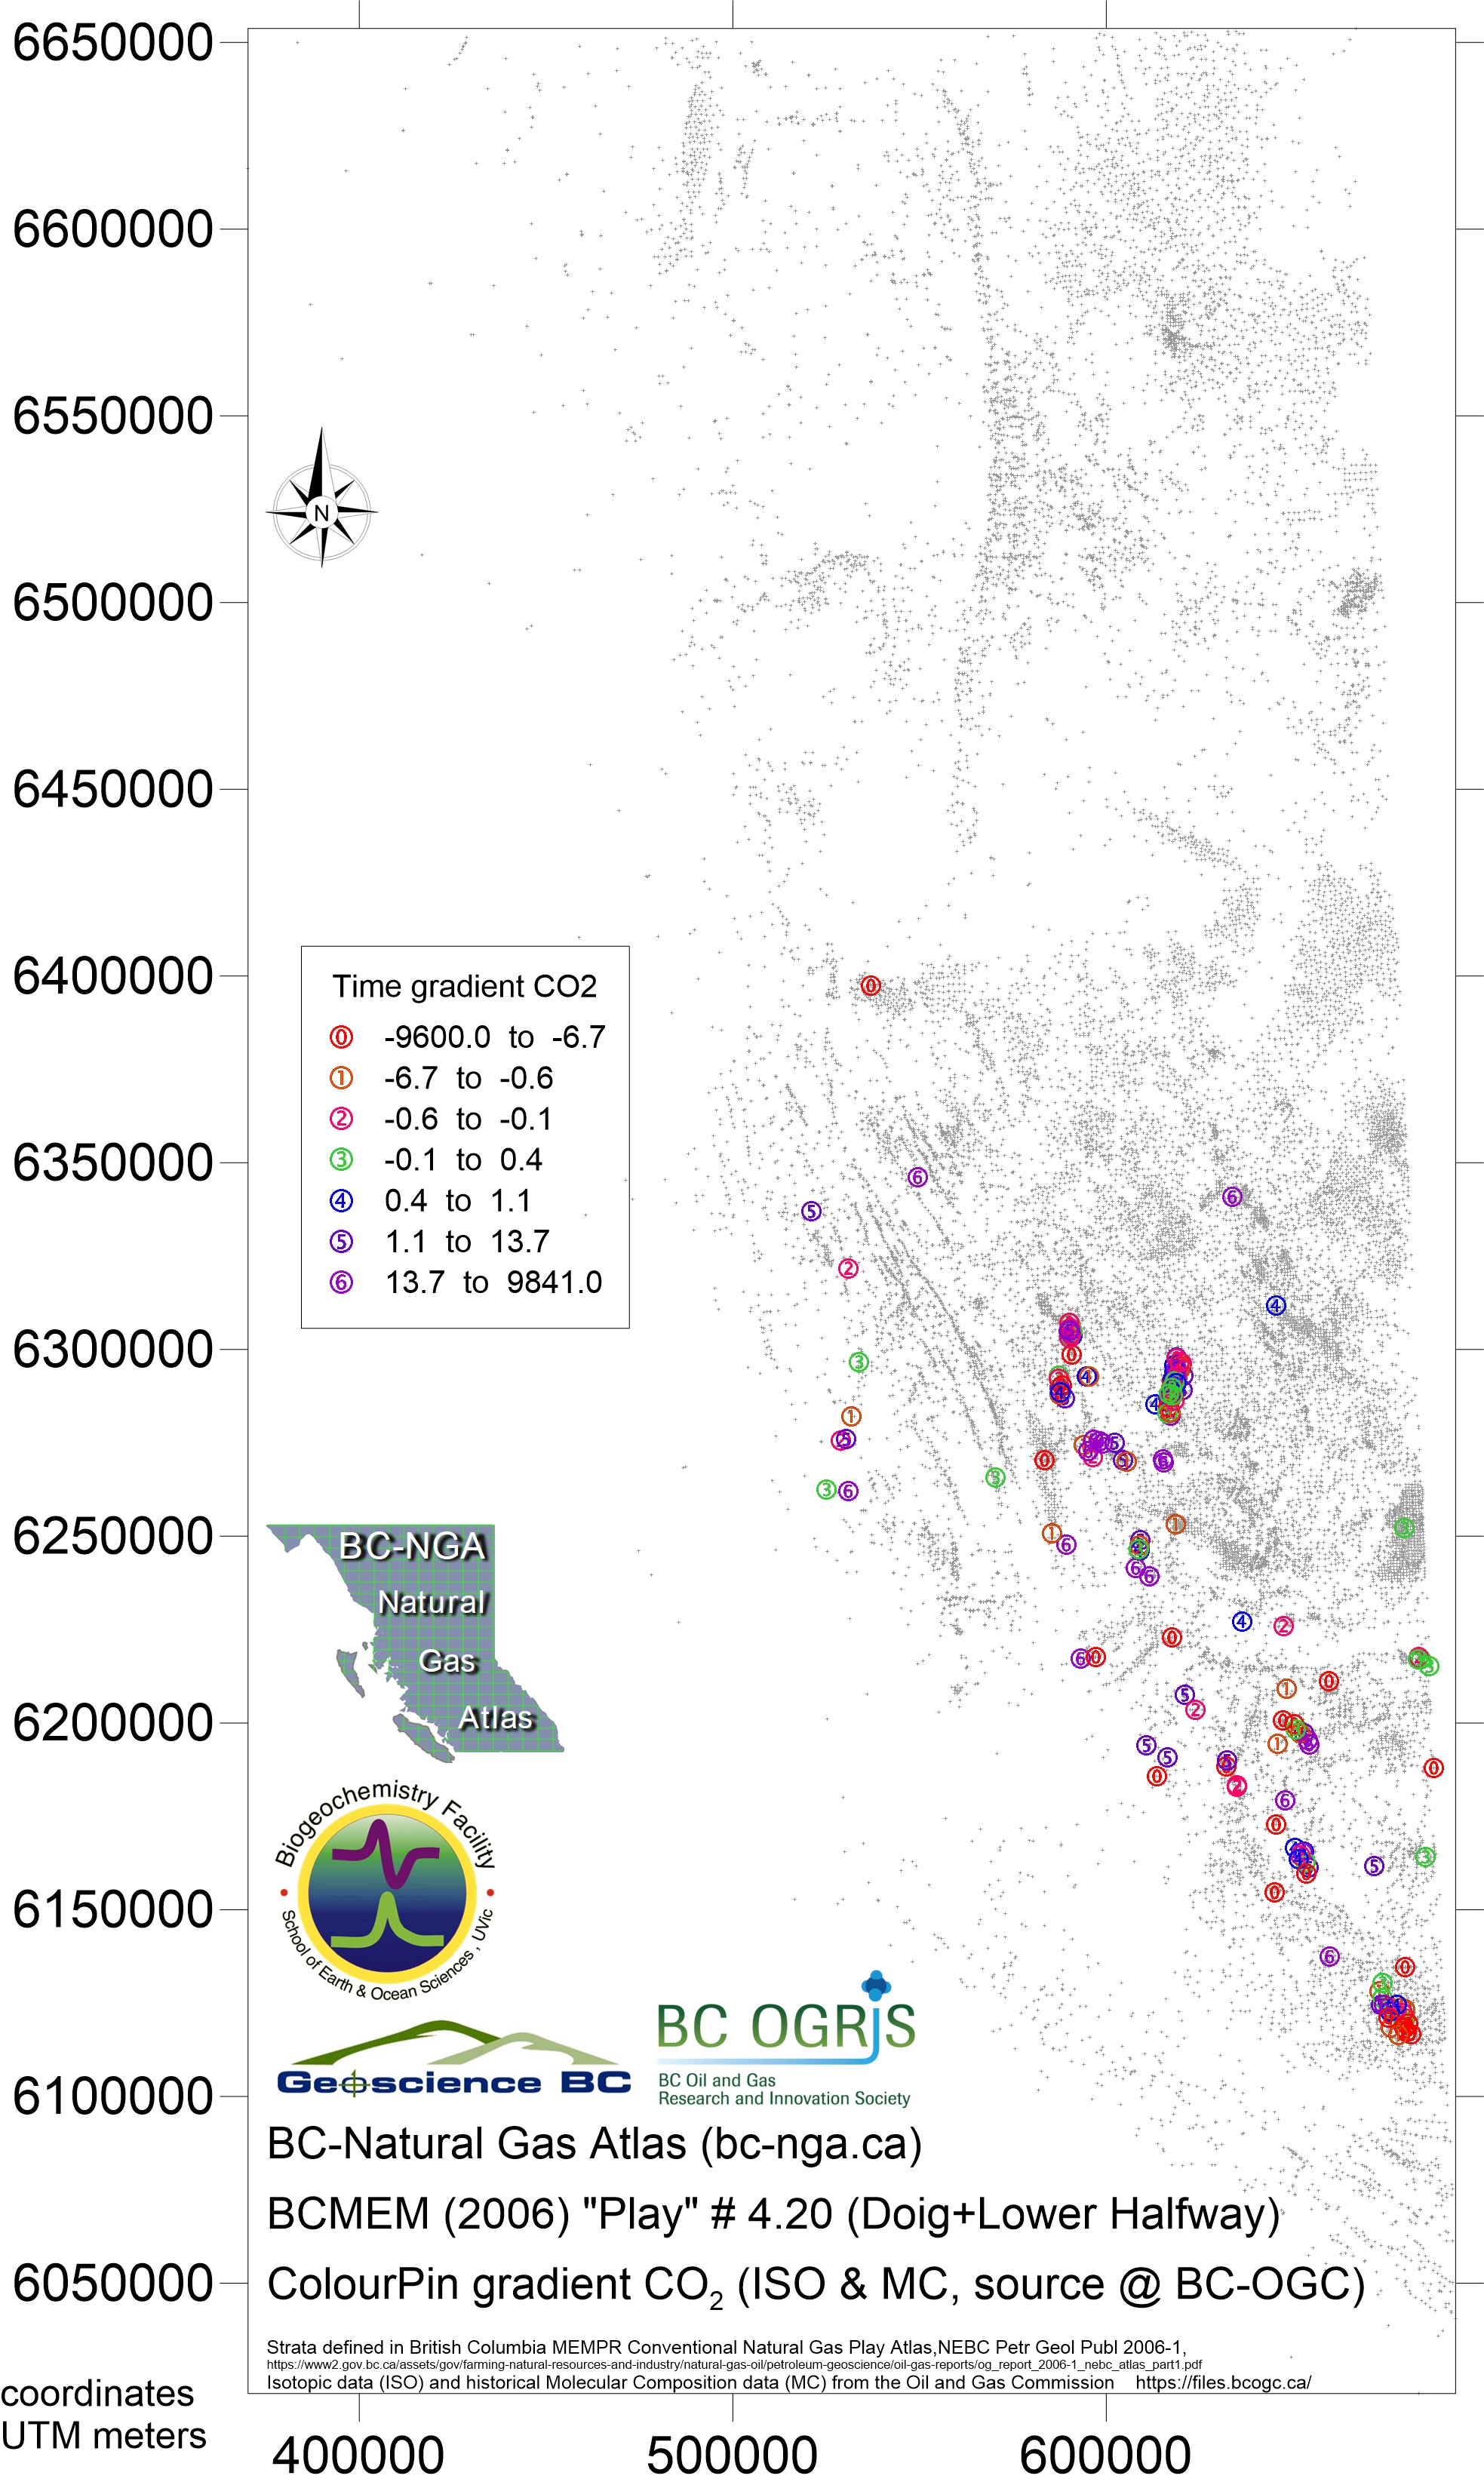
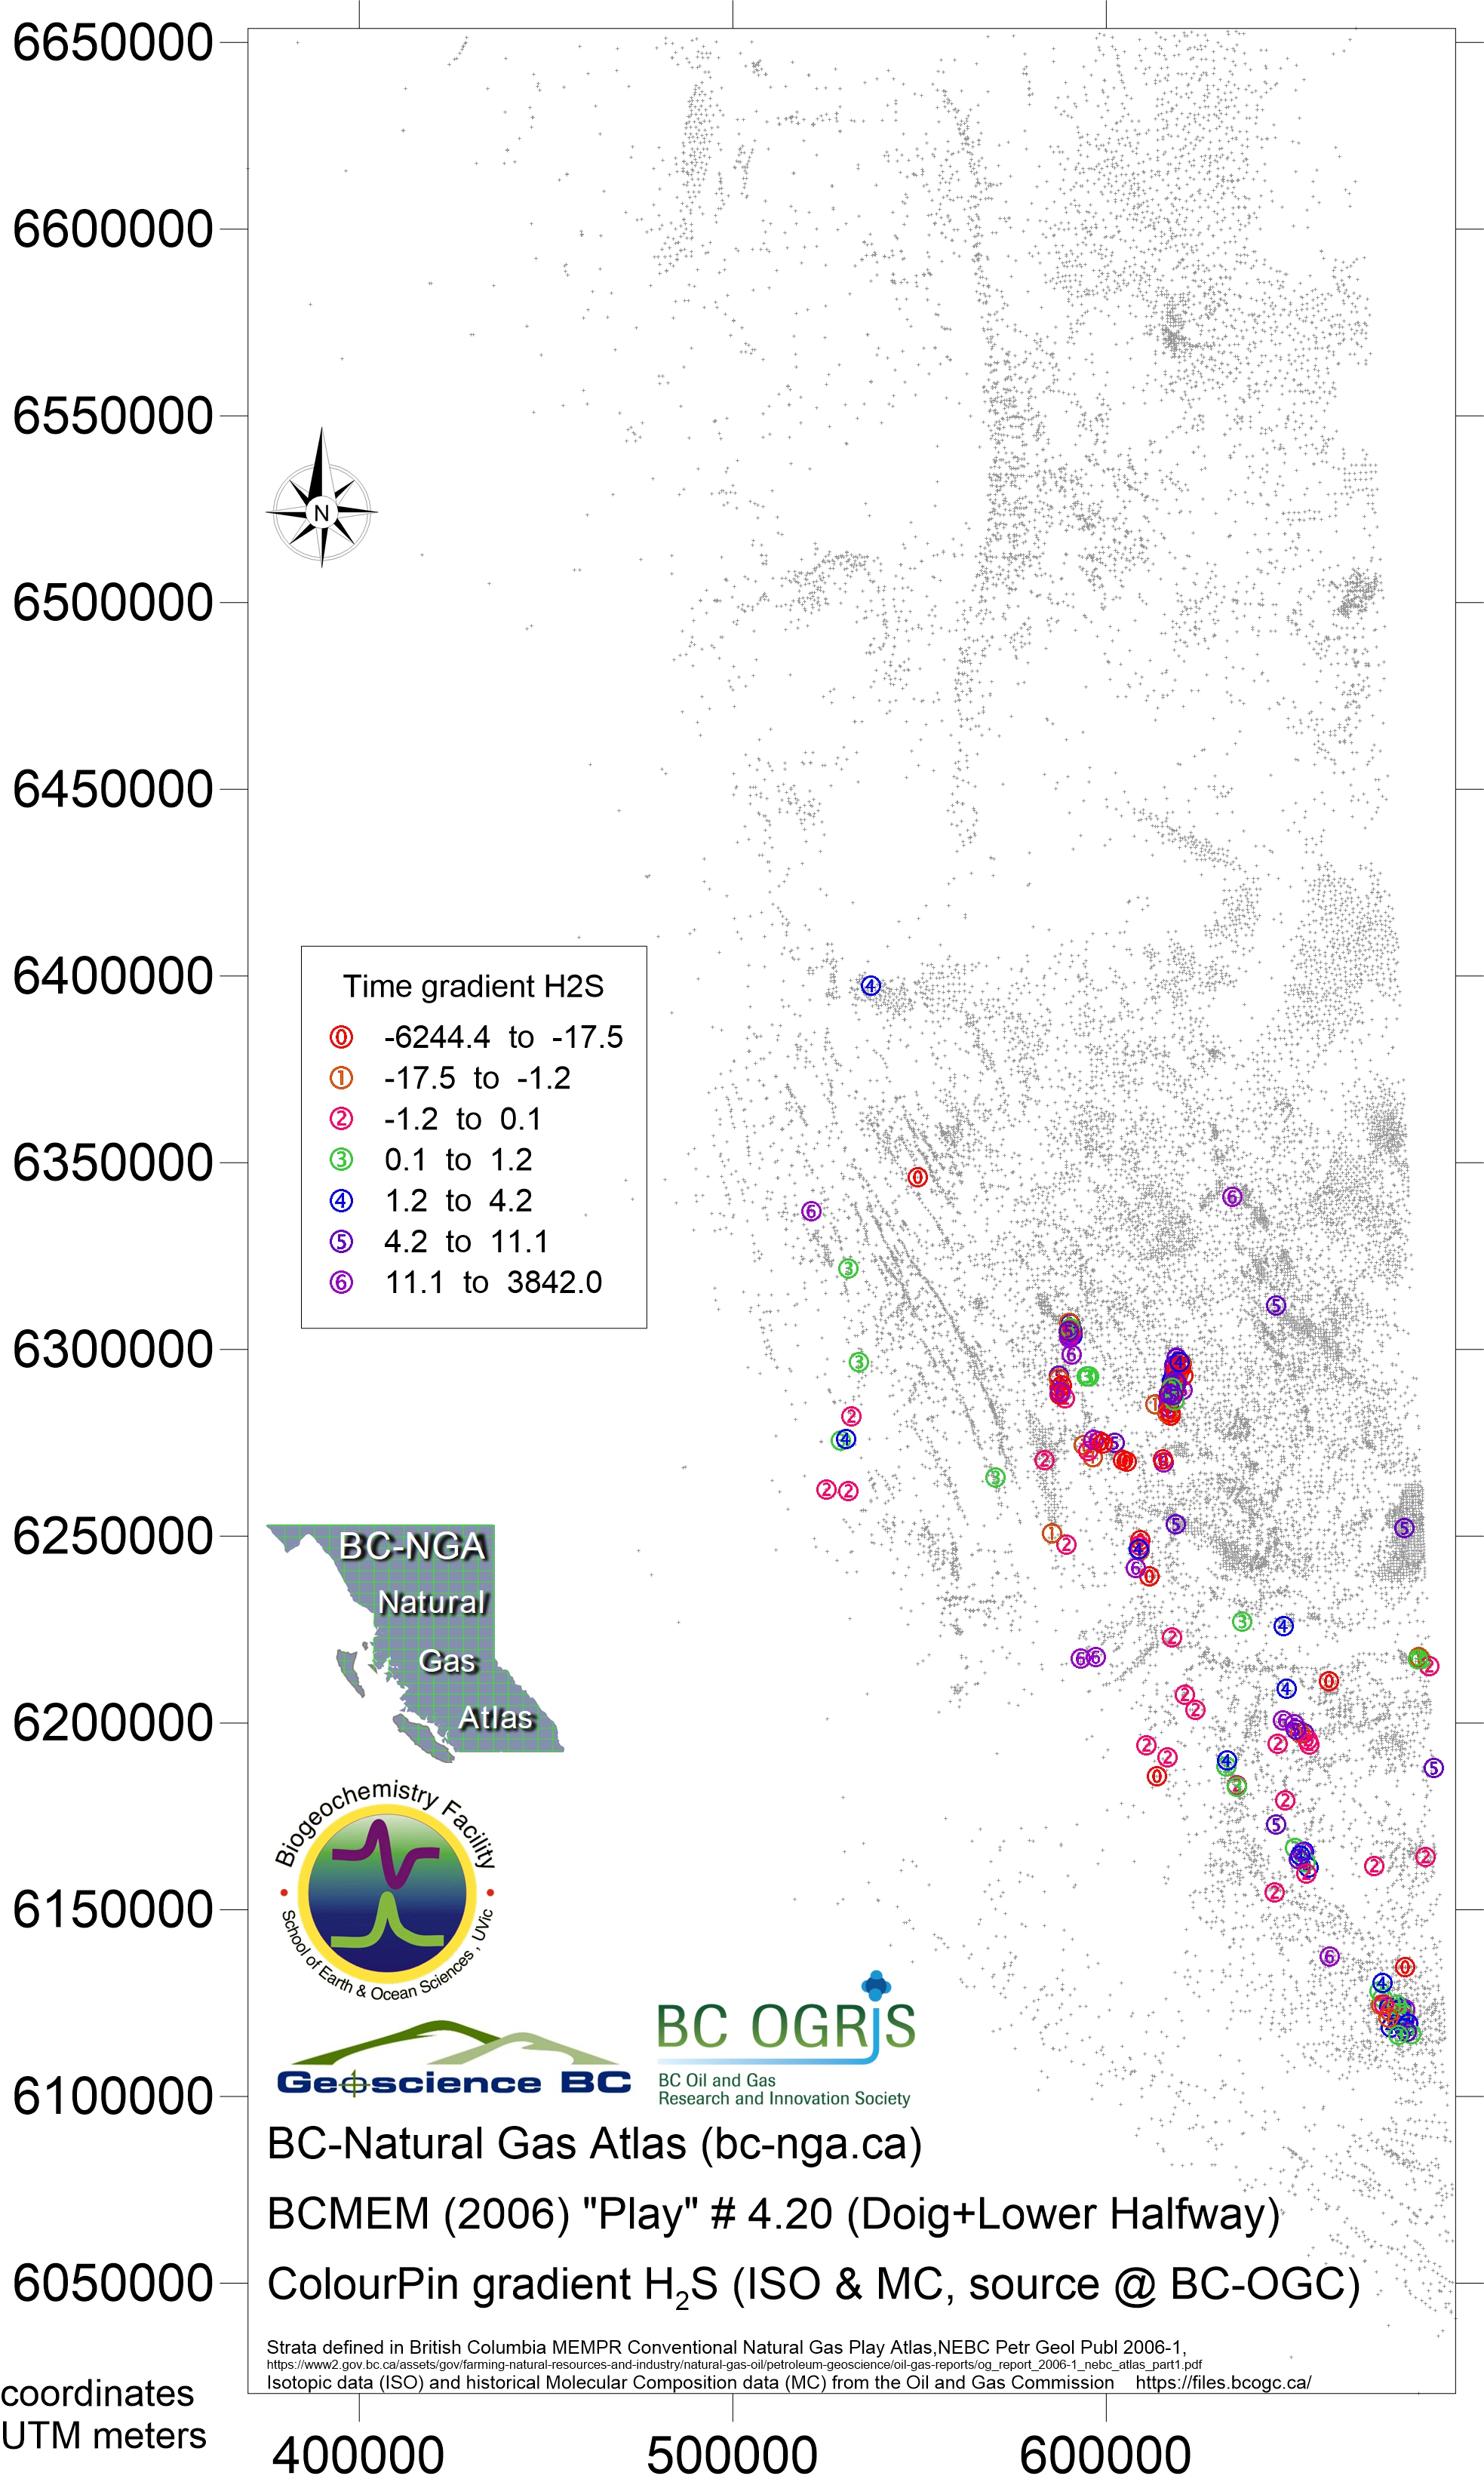
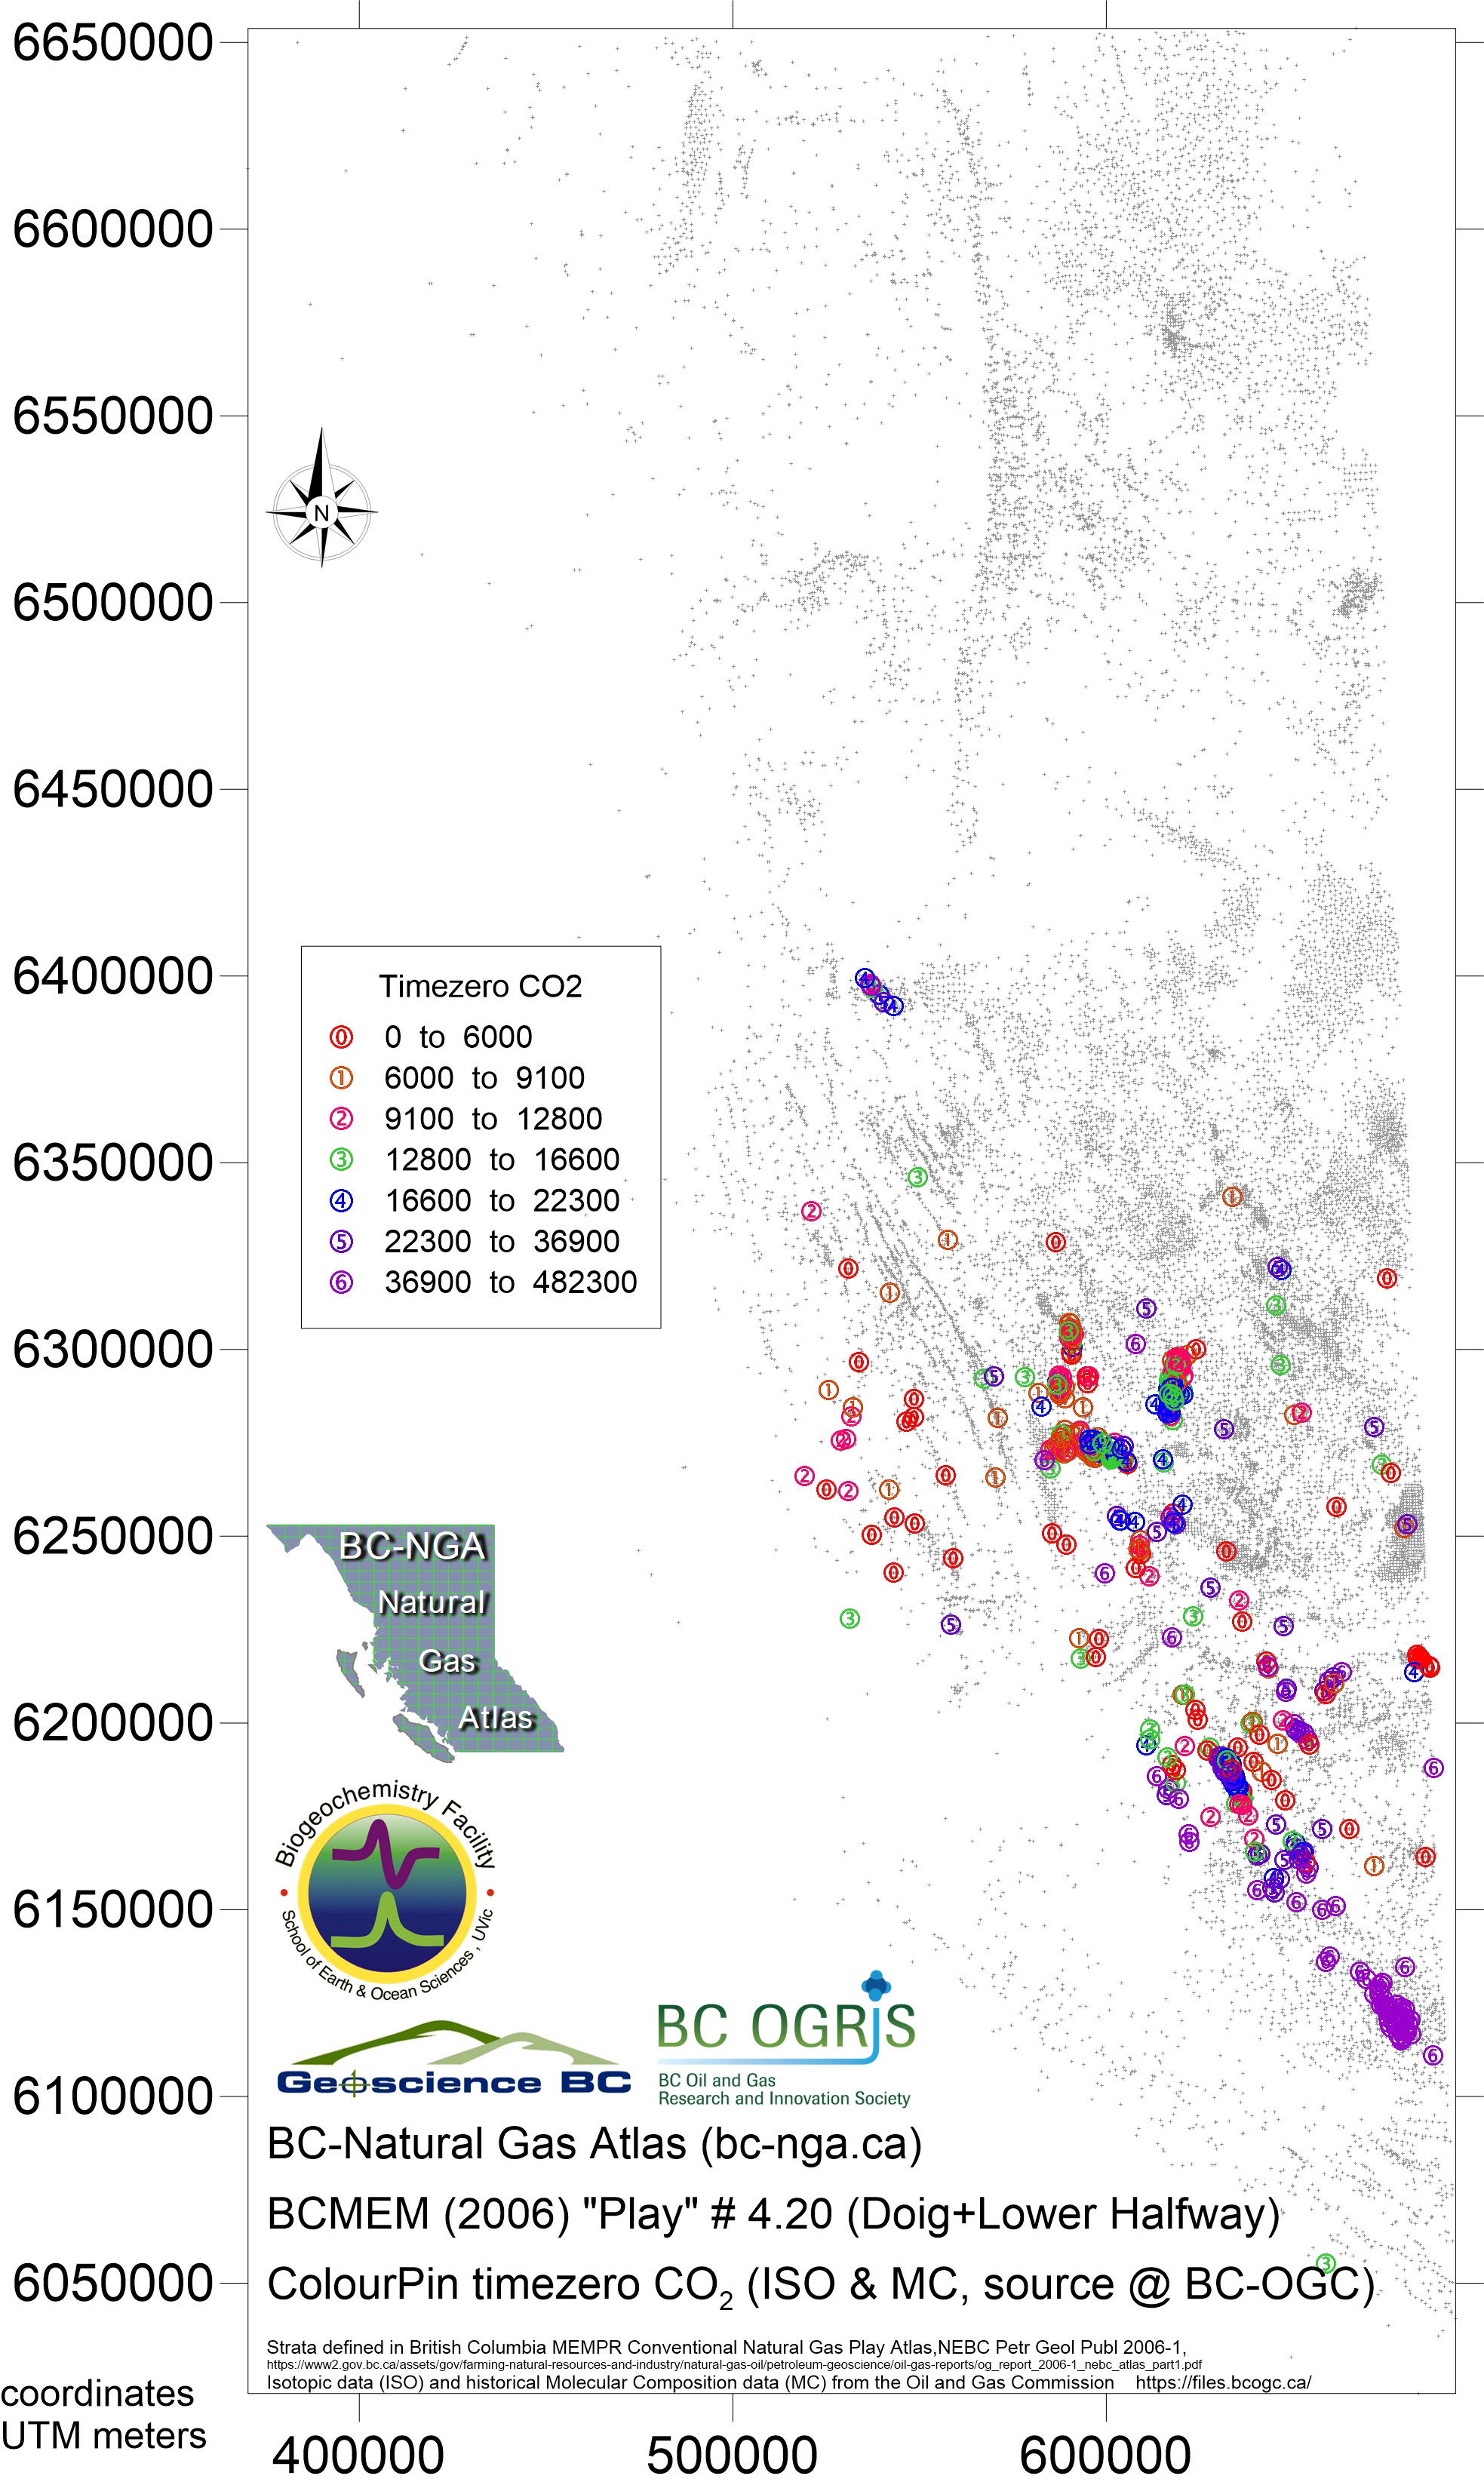
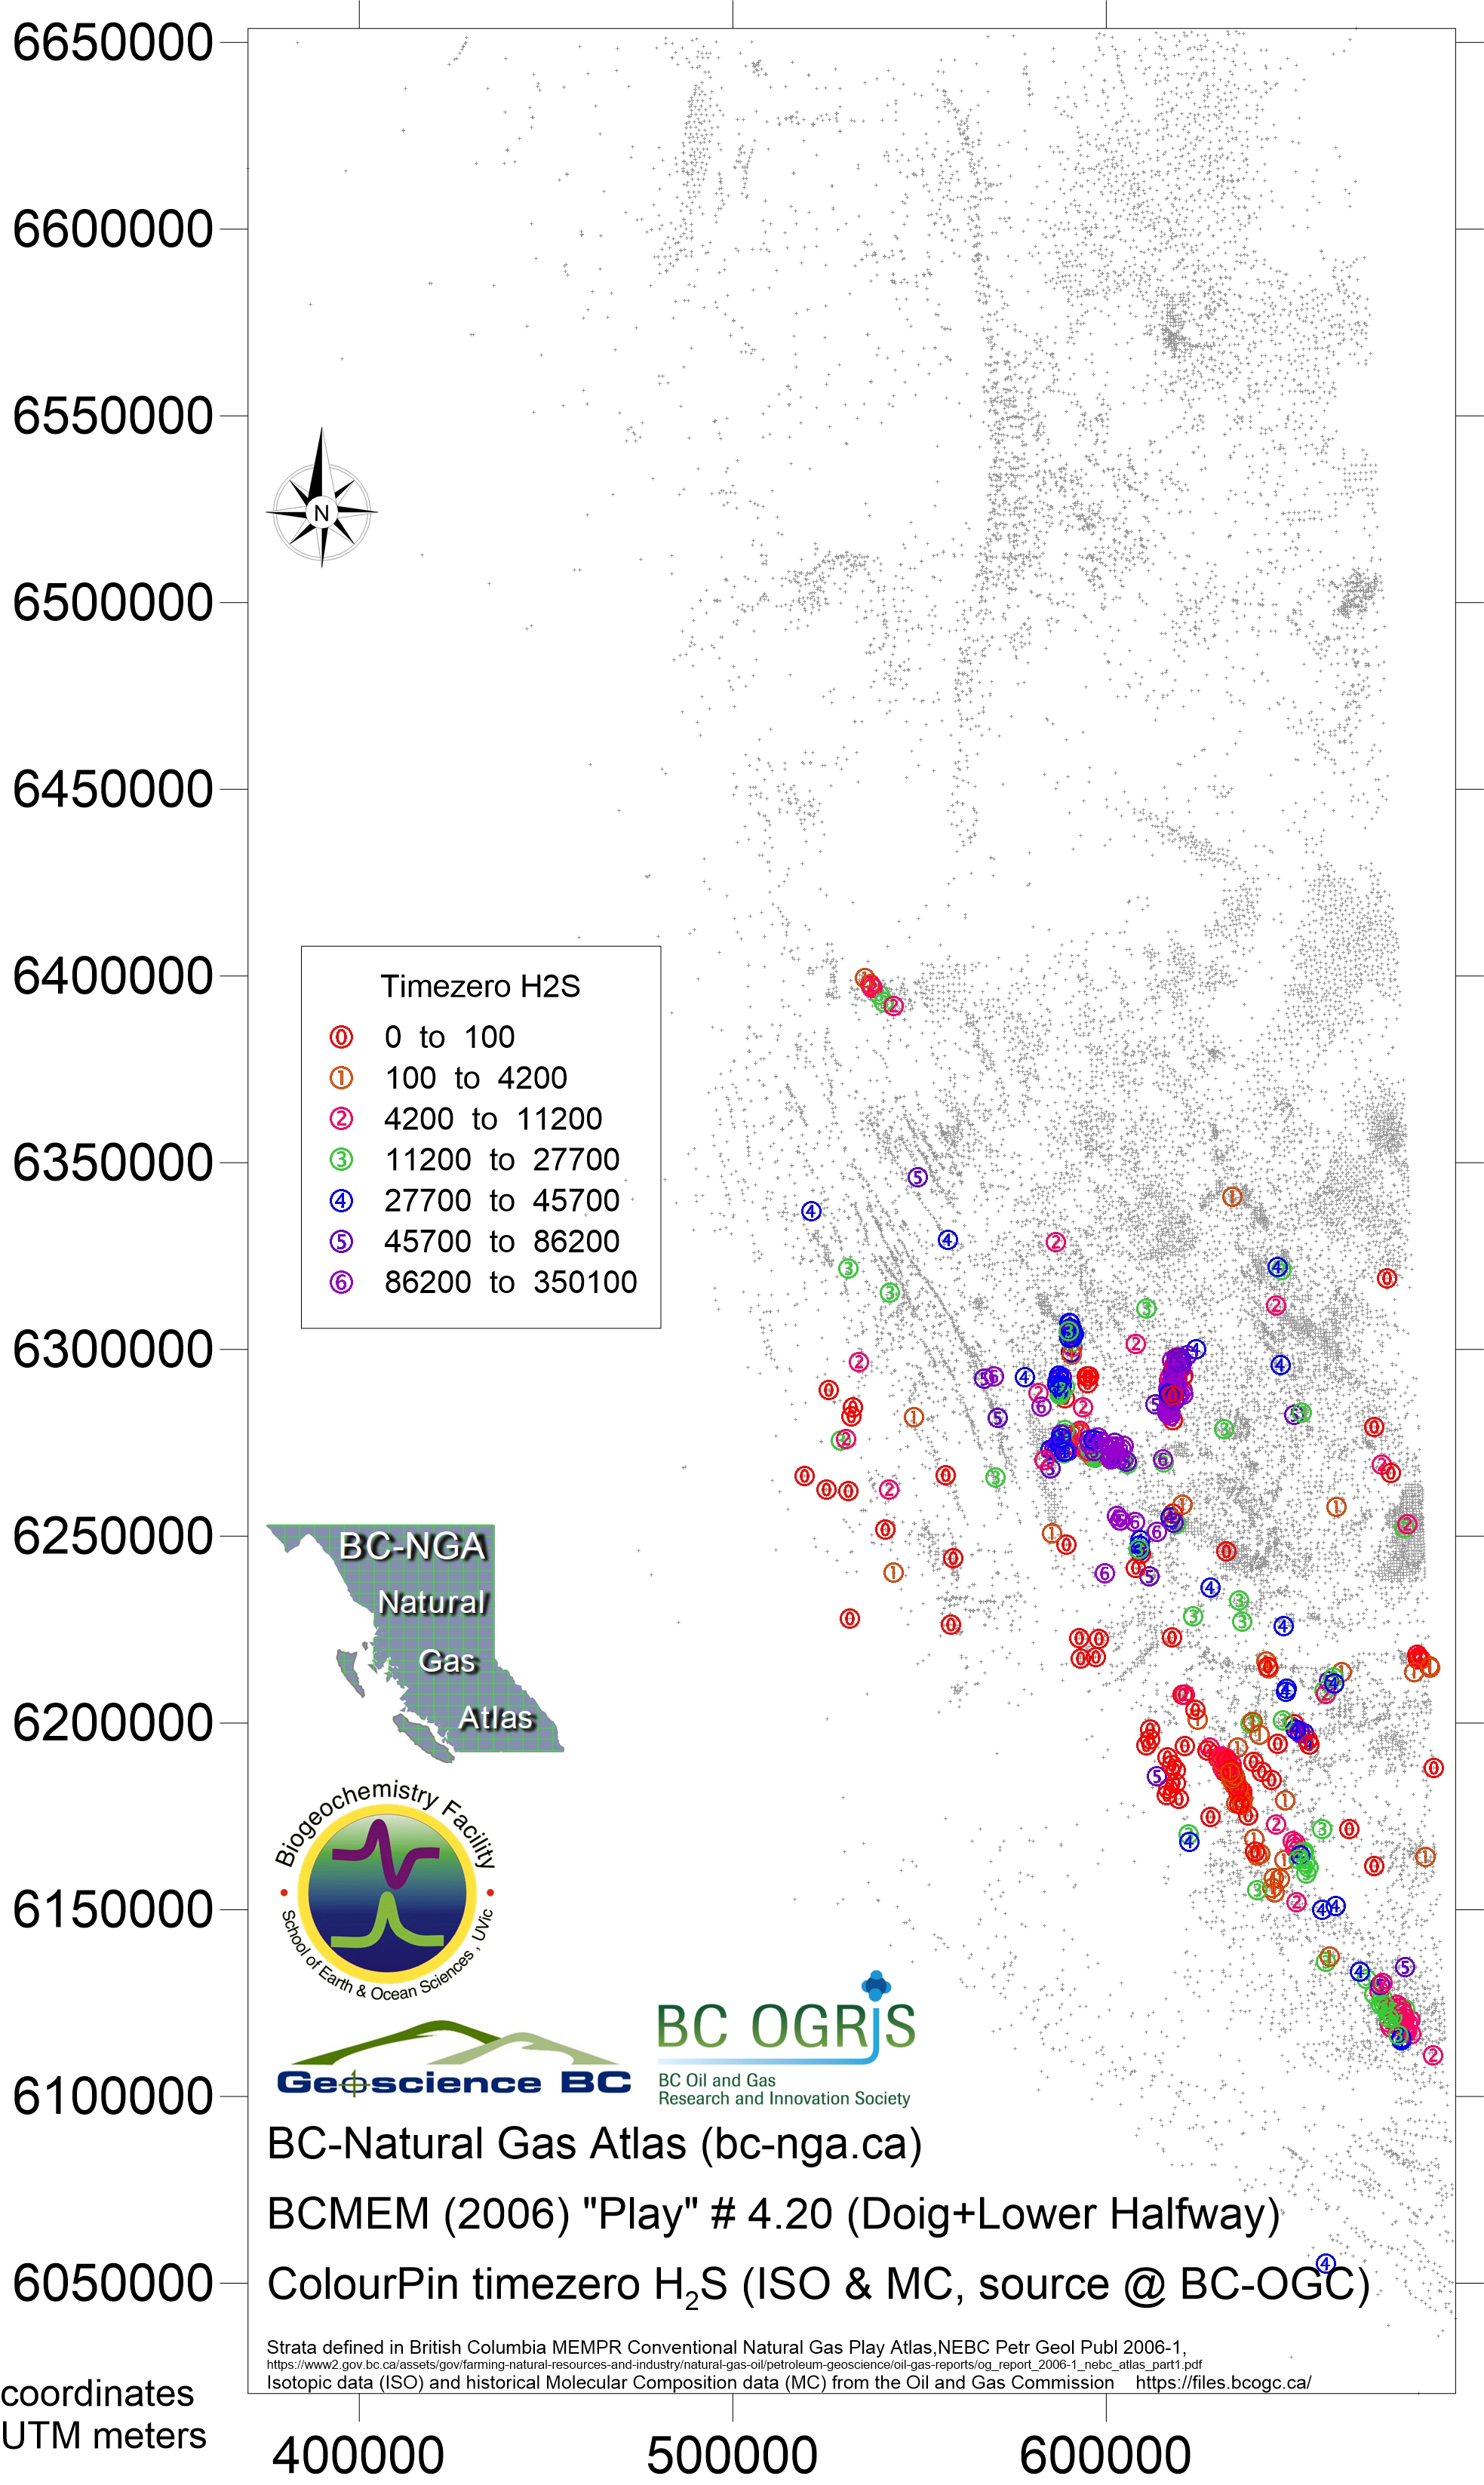
Play 4.20 Doig Formation and equivalents
(includes some lower Halfway Formation where group sampled)
- Map177 Nov 2018 play 4.20 Doig Bernard ratio
- Map178 Nov 2018 play 4.20 Doig dryness ratio
- Map179 Nov 2018 play 4.20 Doig iC4nC4 ratio
- Map180 Nov 2018 play 4.20 Doig ISO ratio
- Map181 Nov 2018 play 4.20 Doig H2S ppm
- Map182 Nov 2018 play 4.20 Doig CH4 ppm
- Map183 Nov 2018 play 4.20 DoigC2H6 ppm
- Map184 Nov 2018 play 4.20 DoigC3H8 ppm
- Map185 Nov 2018 play 4.20 Doig iC4H10 ppm
- Map186 Nov 2018 play 4.20 Doig nC4H10 ppm
- Map187 Nov 2018 play 4.20 Doig iC5H12 ppm
- Map188 Nov 2018 play 4.20 Doig nC5H12 ppm
- Map189 Nov 2018 play 4.20 Doig C6H14 plus ppm
- Map190 Nov 2018 play 4.20 Doig CO2 ppm
- Map191 Nov 2018 play 4.20 Doig δ13CH4
- Map192 Nov 2018 play 4.20 Doig δ13C2H6
- Map193 Nov 2018 play 4.20 Doig δ13C3H8
- Map194 Nov 2018 play 4.20 Doig δ13iC4H10
- Map195 Nov 2018 play 4.20 Doig δ13nC4H10
- Map196 Nov 2018 play 4.20 Doig time series gradient Bernard ratio
- Map197 Nov 2018 play 4.20 Doig time series gradient CO2
- Map198 Nov 2018 play 4.20 Doig time series gradient H2S
- Map199 Nov 2018 play 4.20 Doig time series start point Bernard ratio
- Map200 Nov 2018 play 4.20 Doig time series start point CO2
- Map201 Nov 2018 play 4.20 Doig time series start point H2S
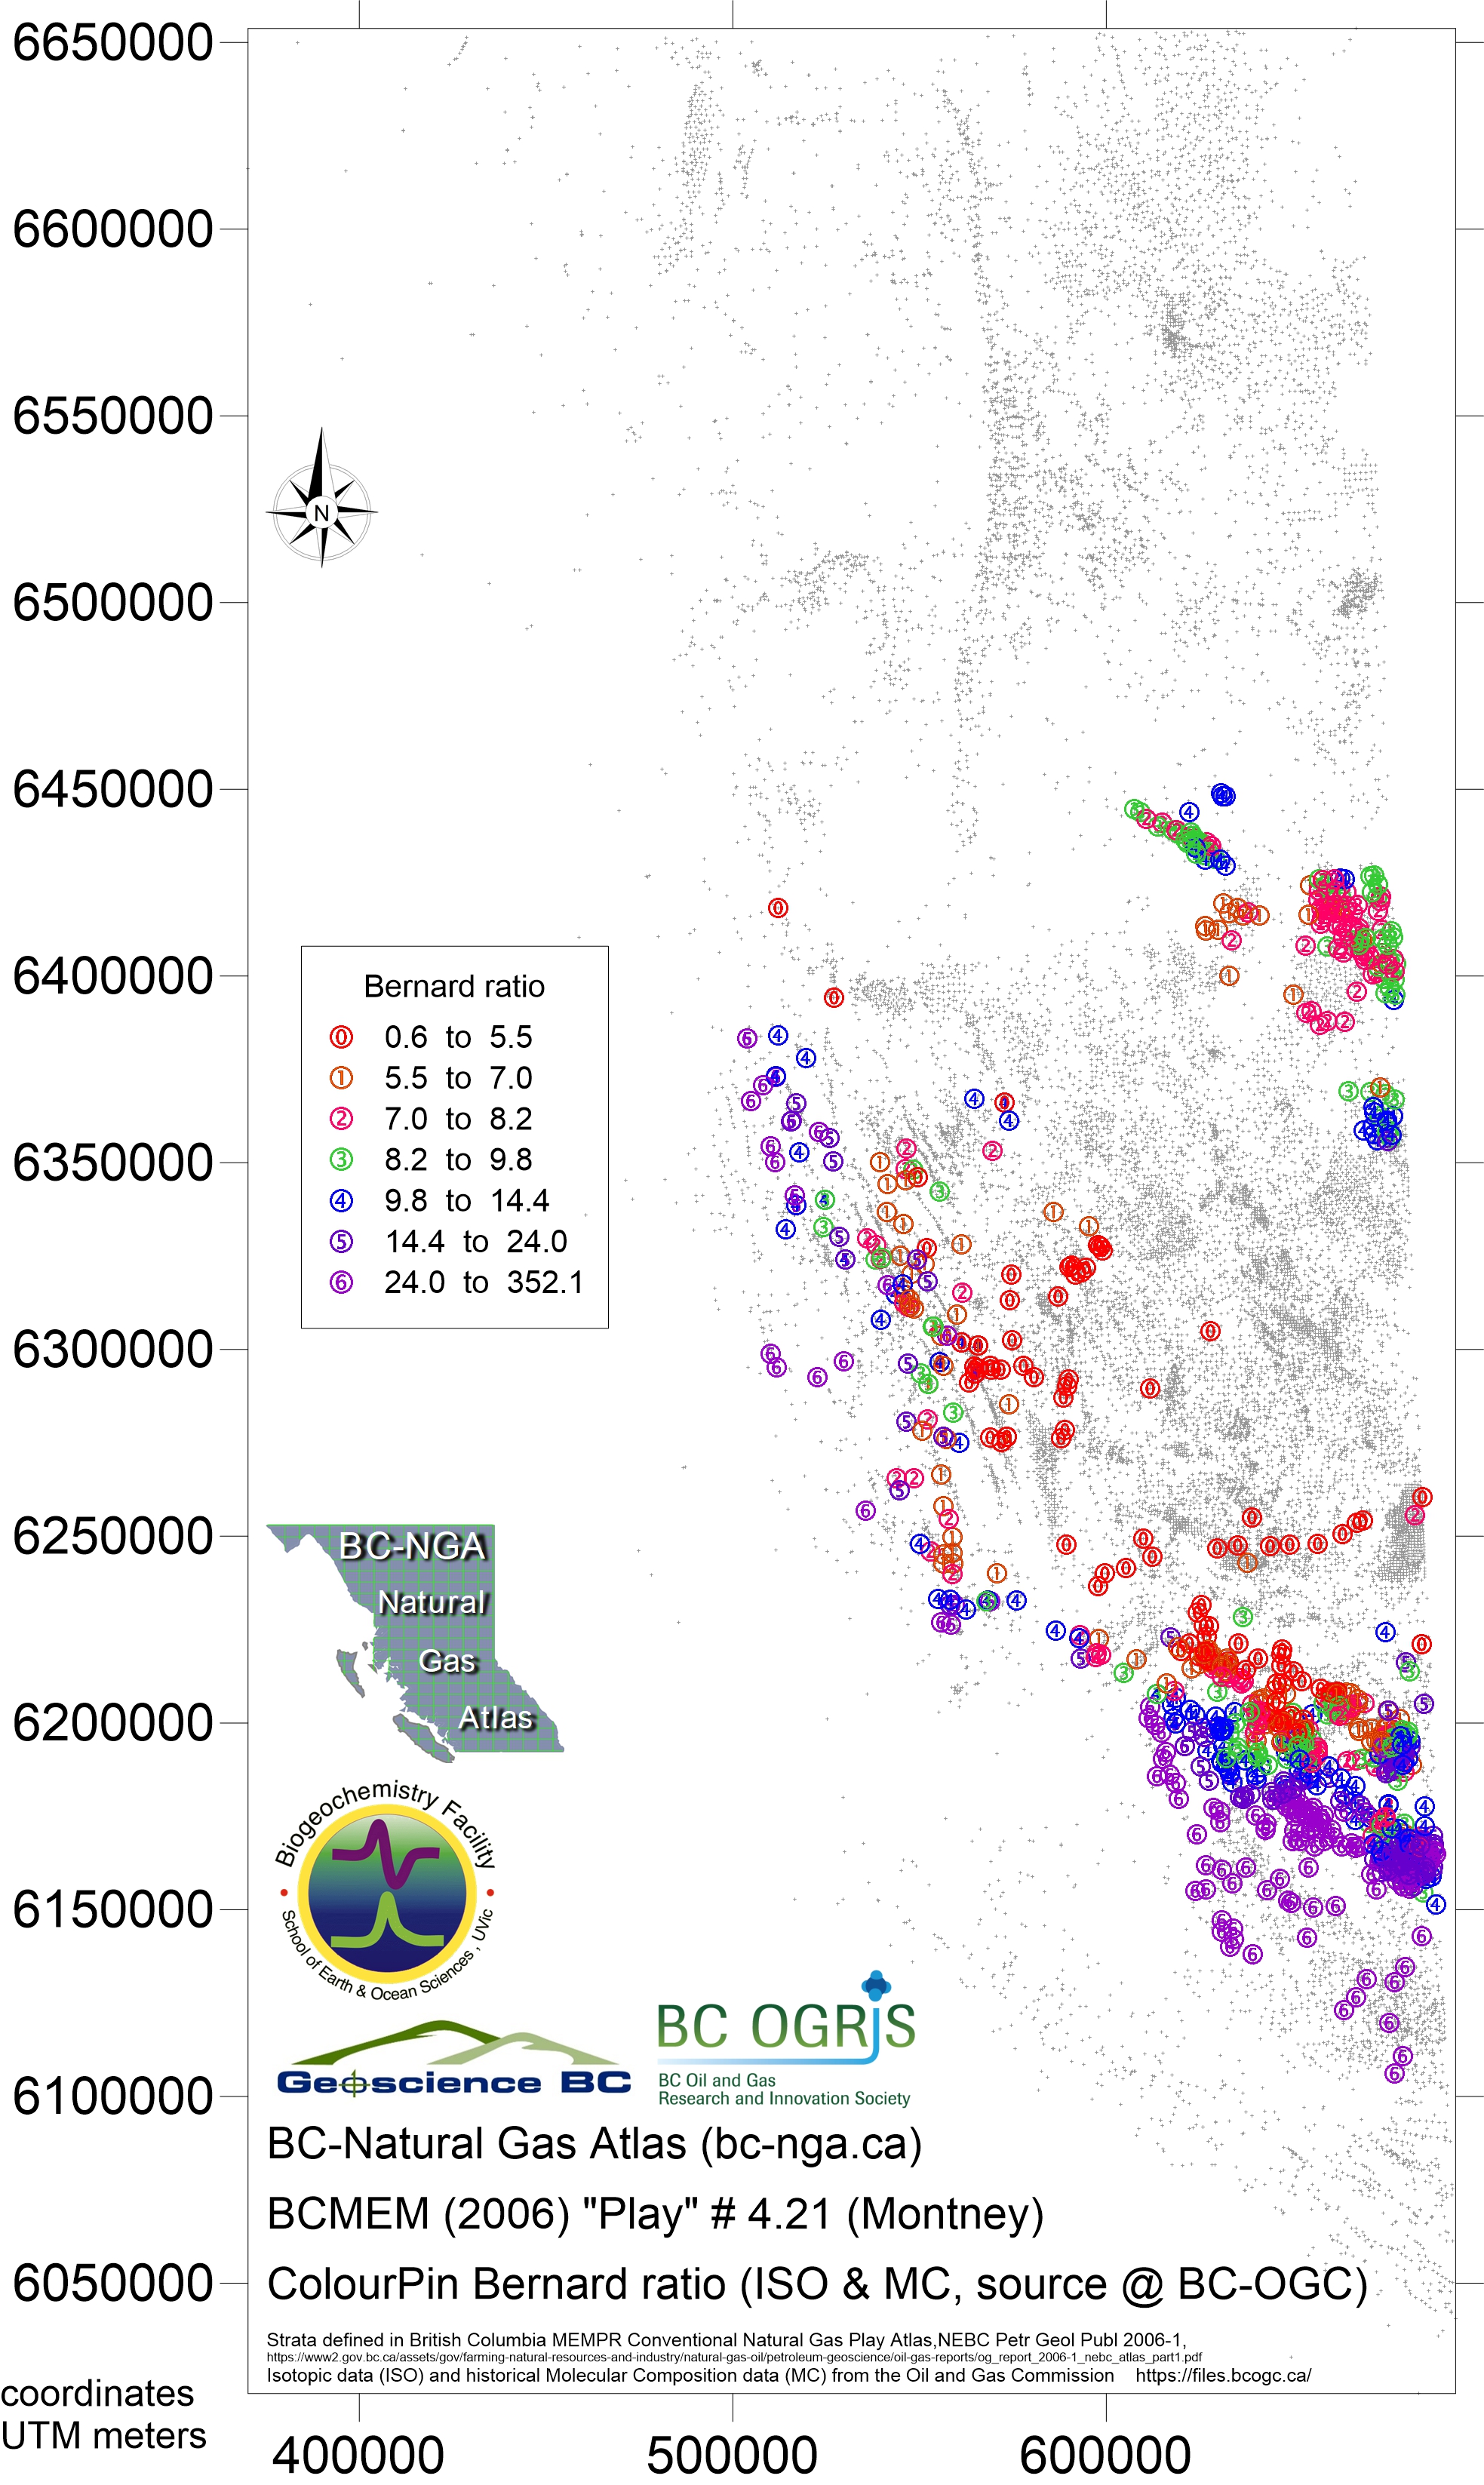
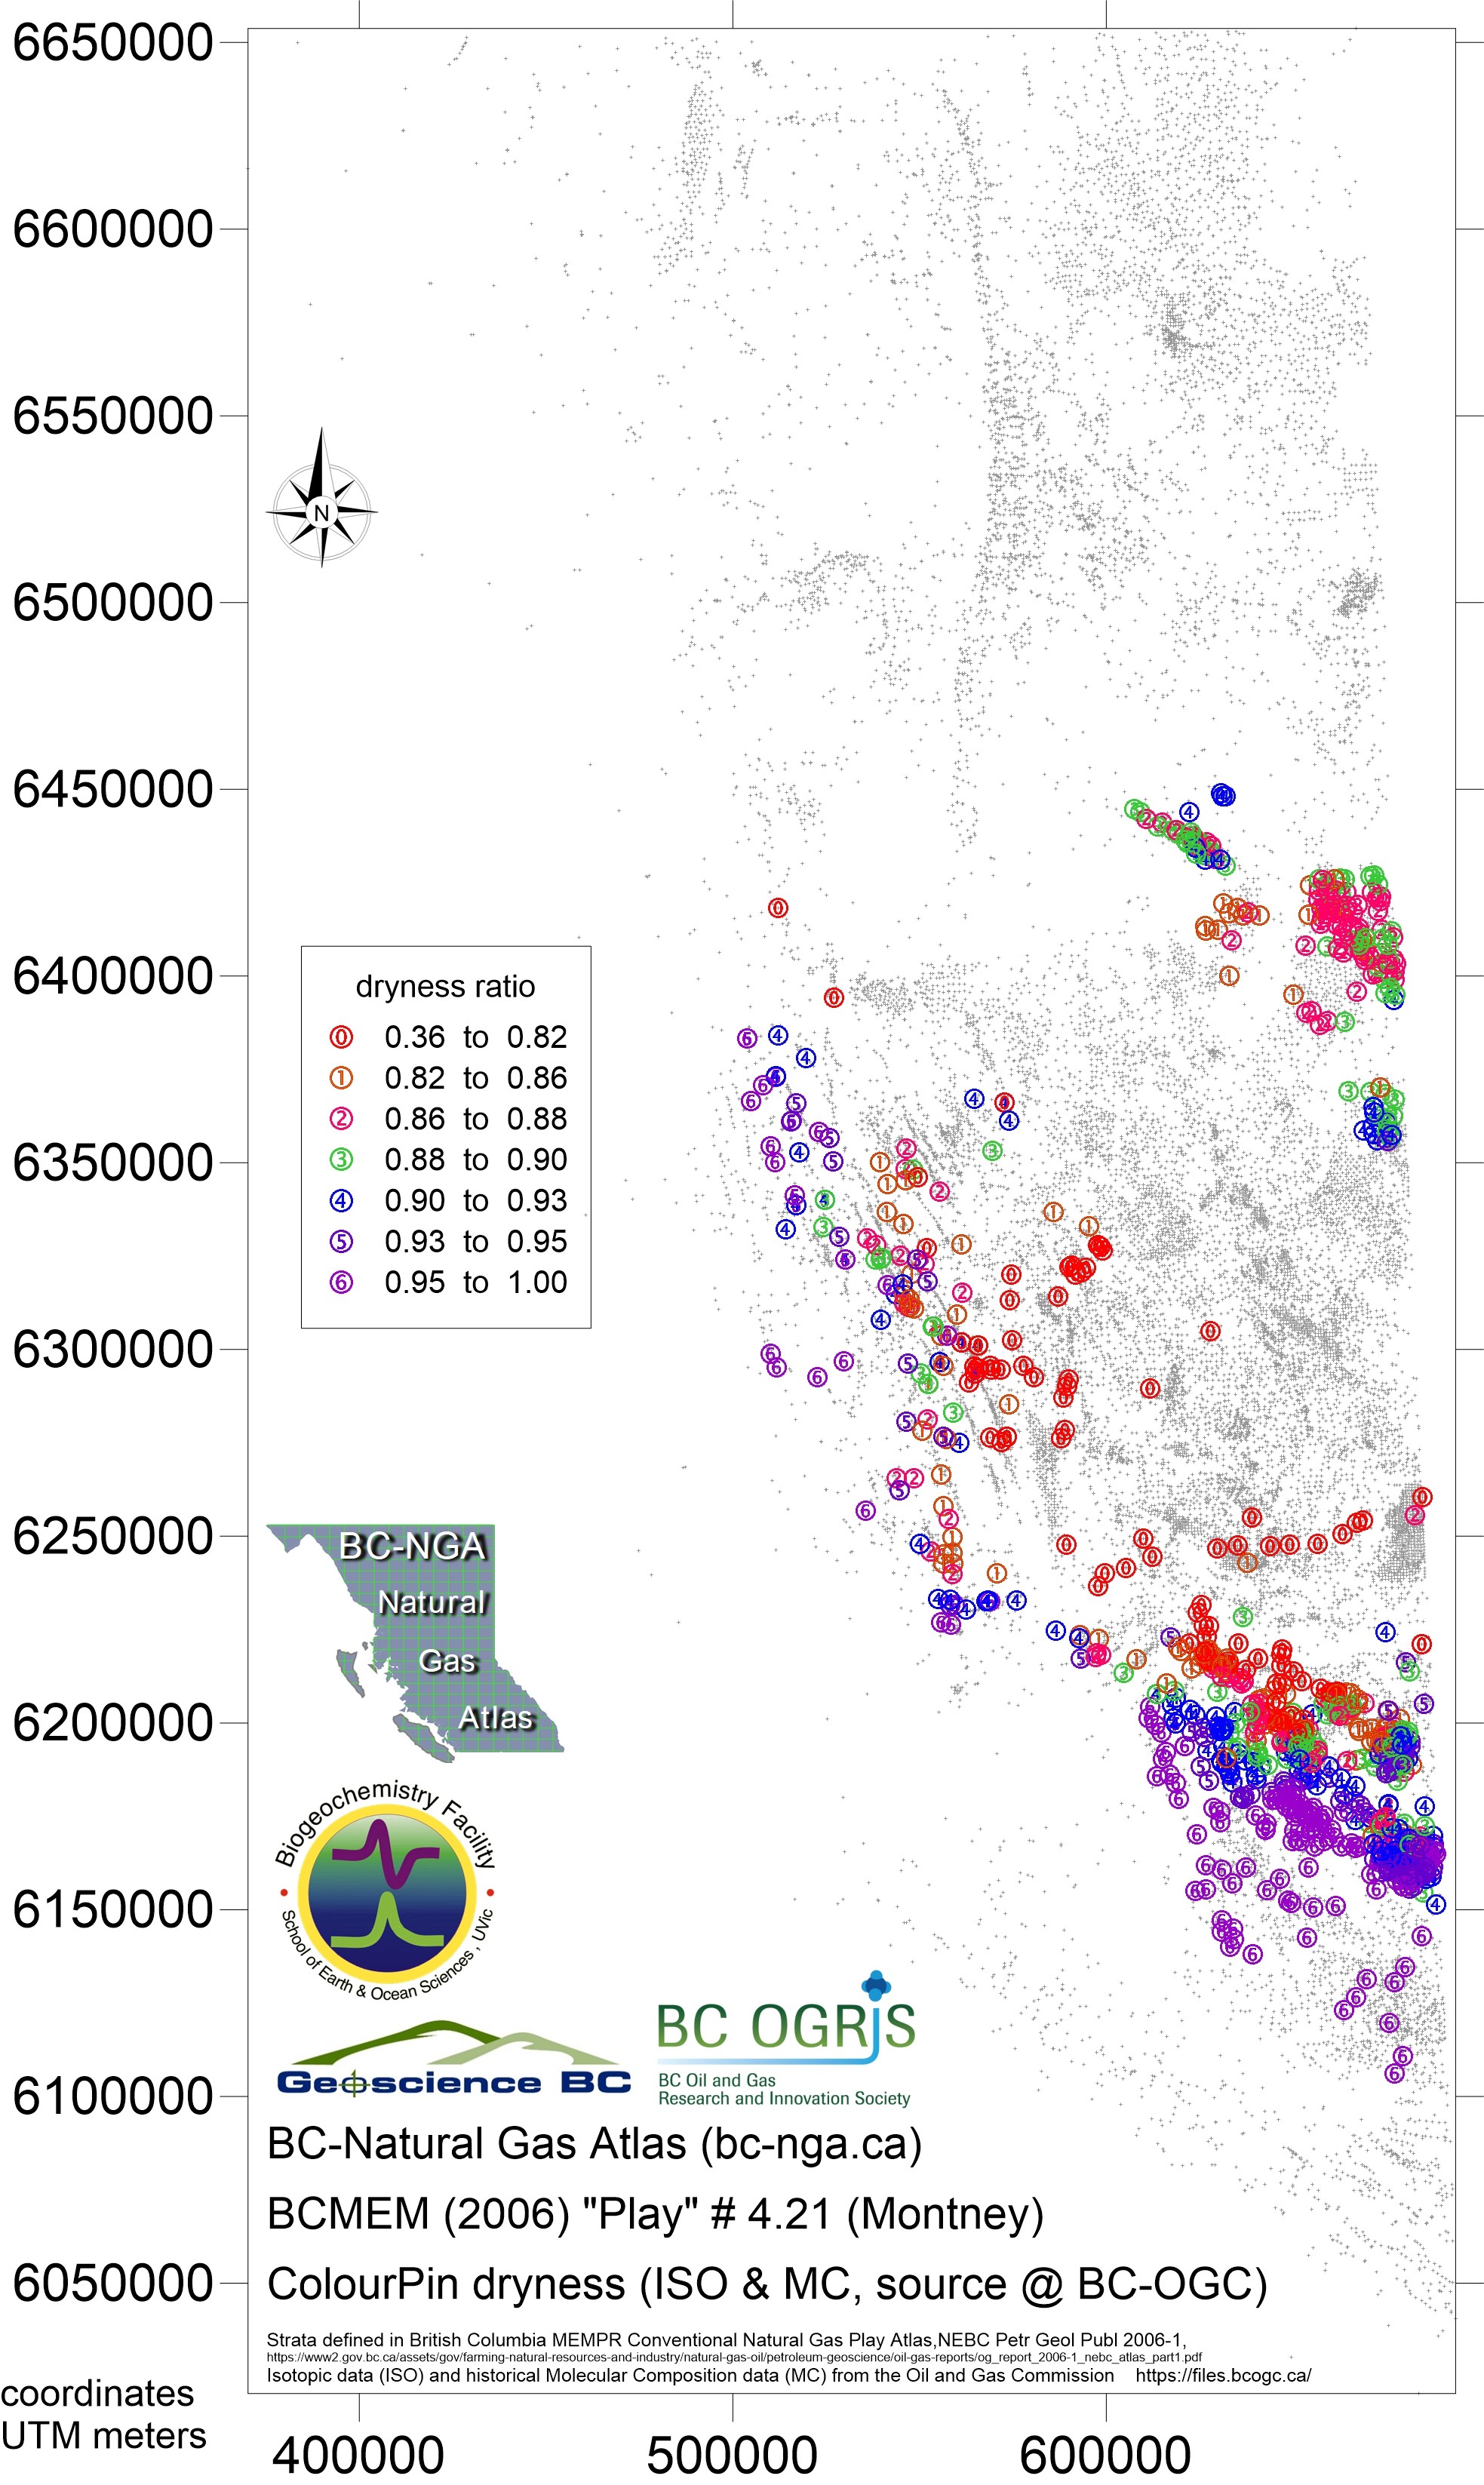
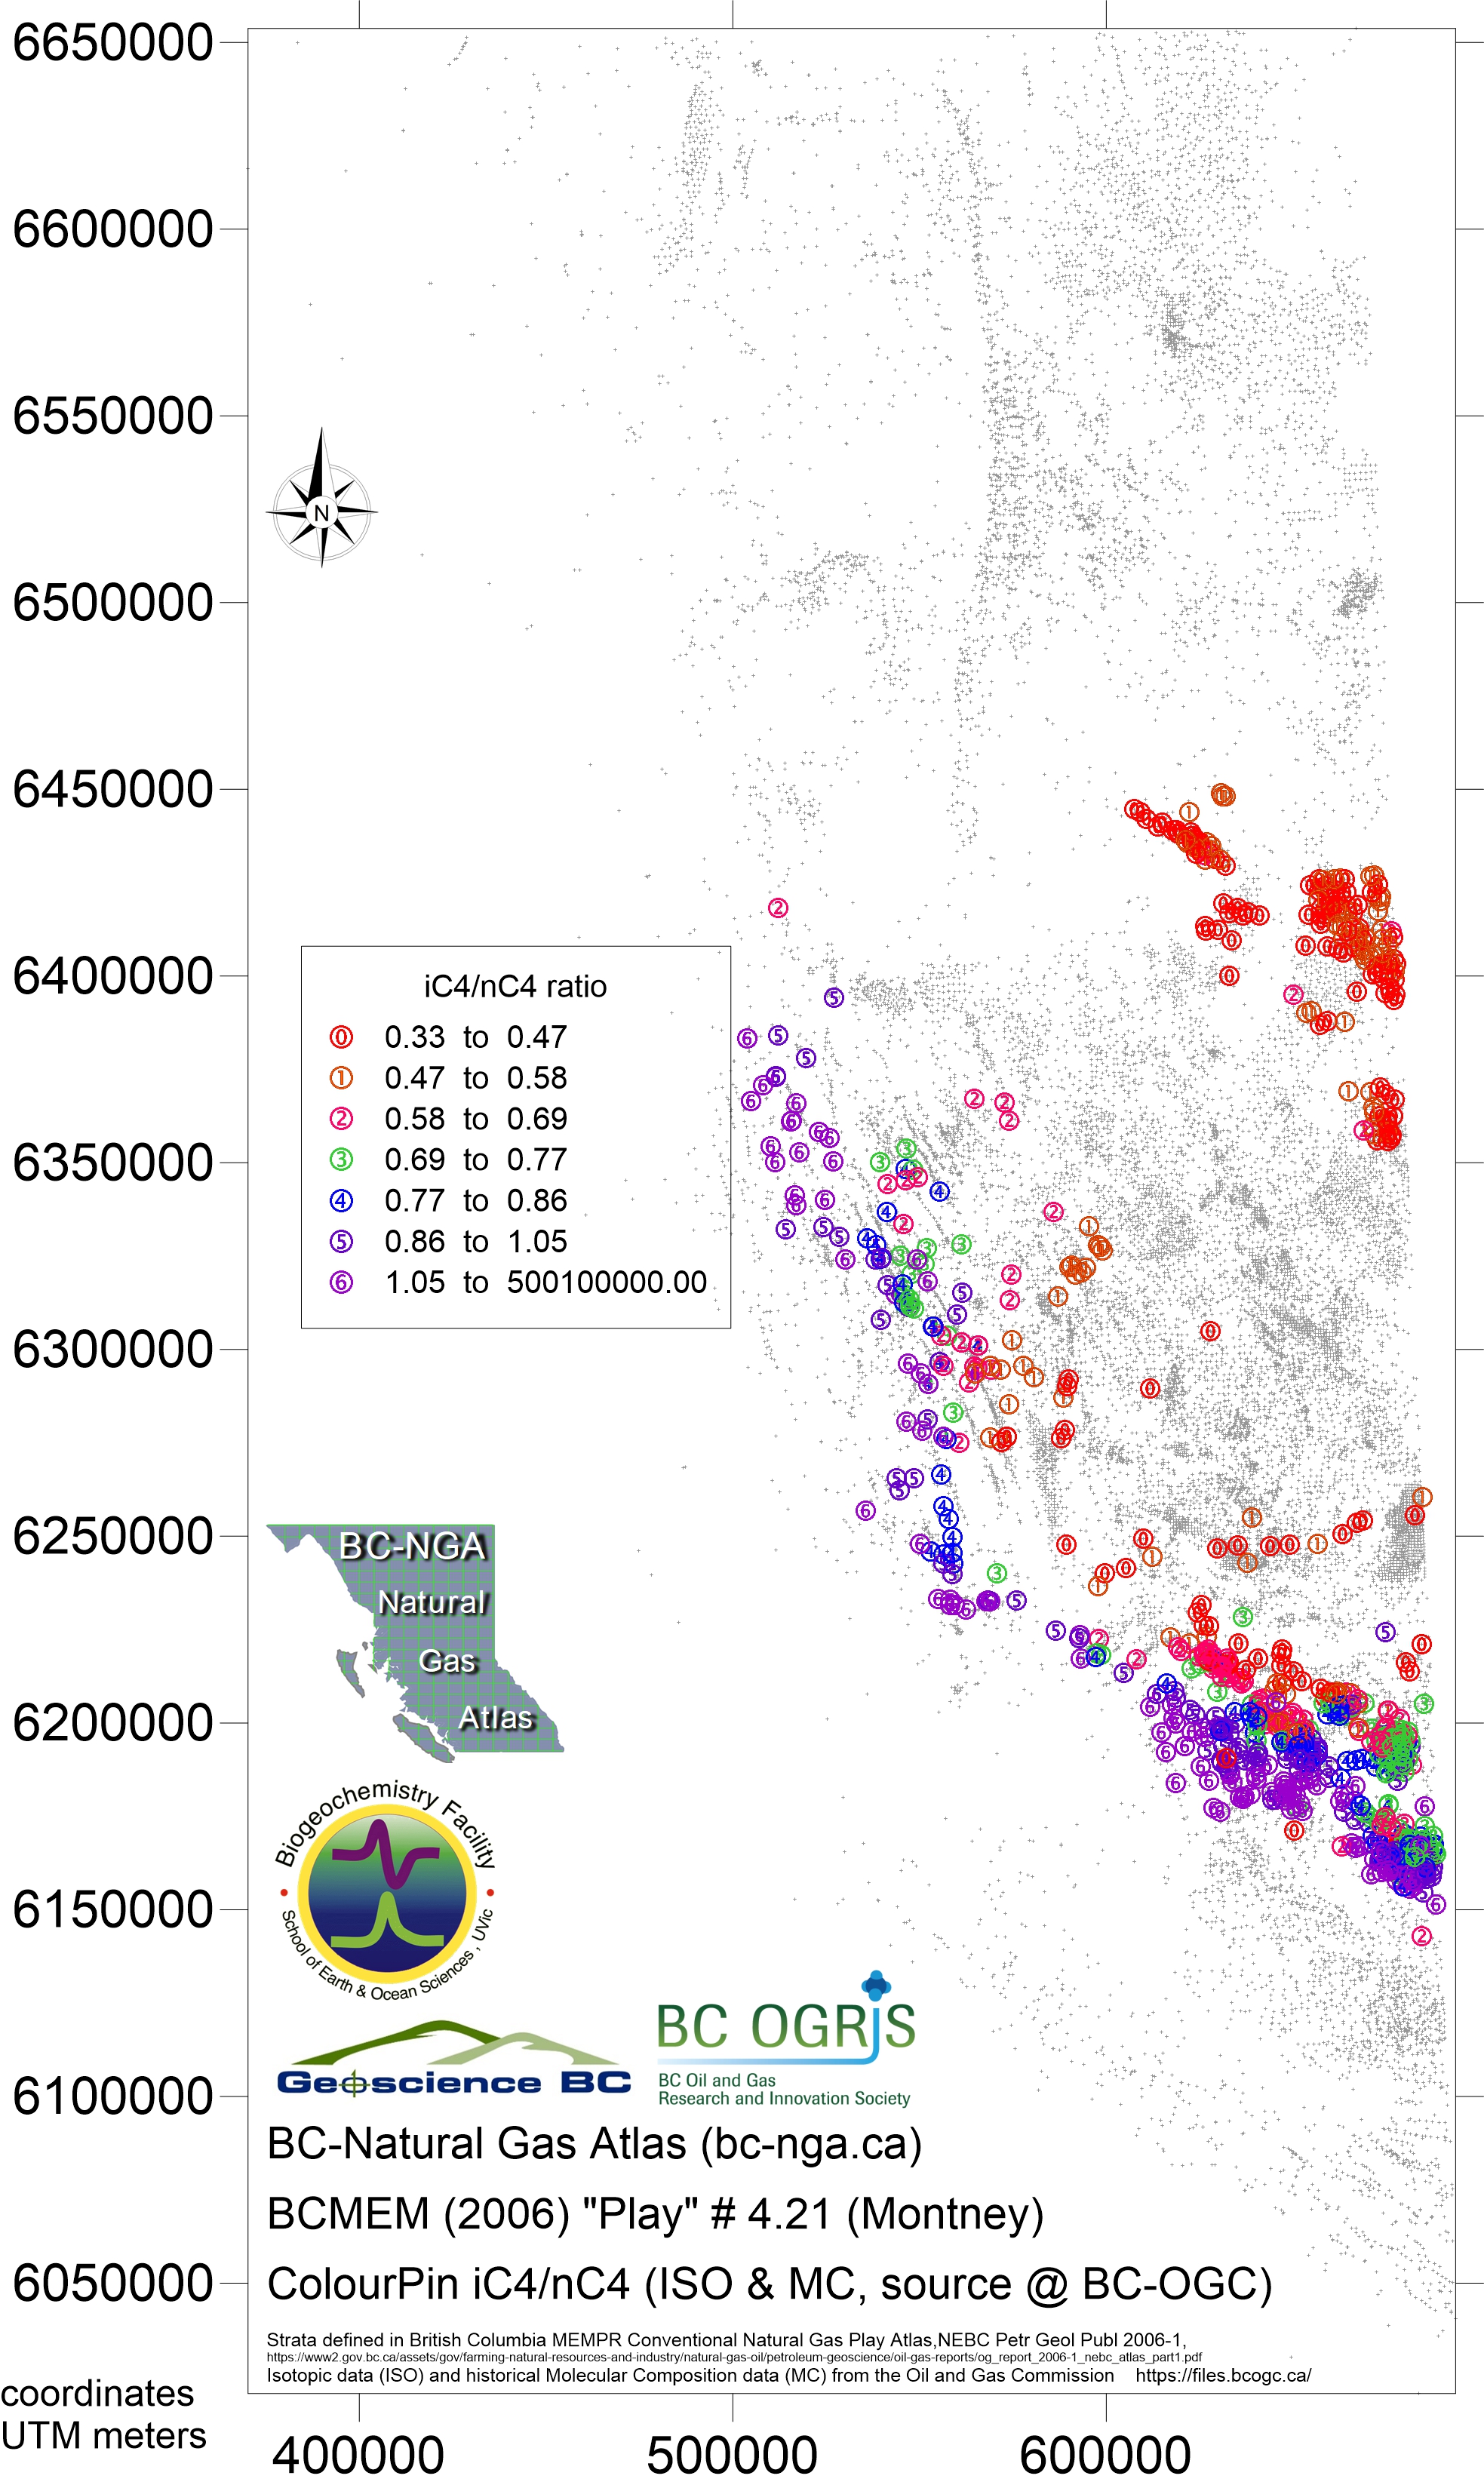
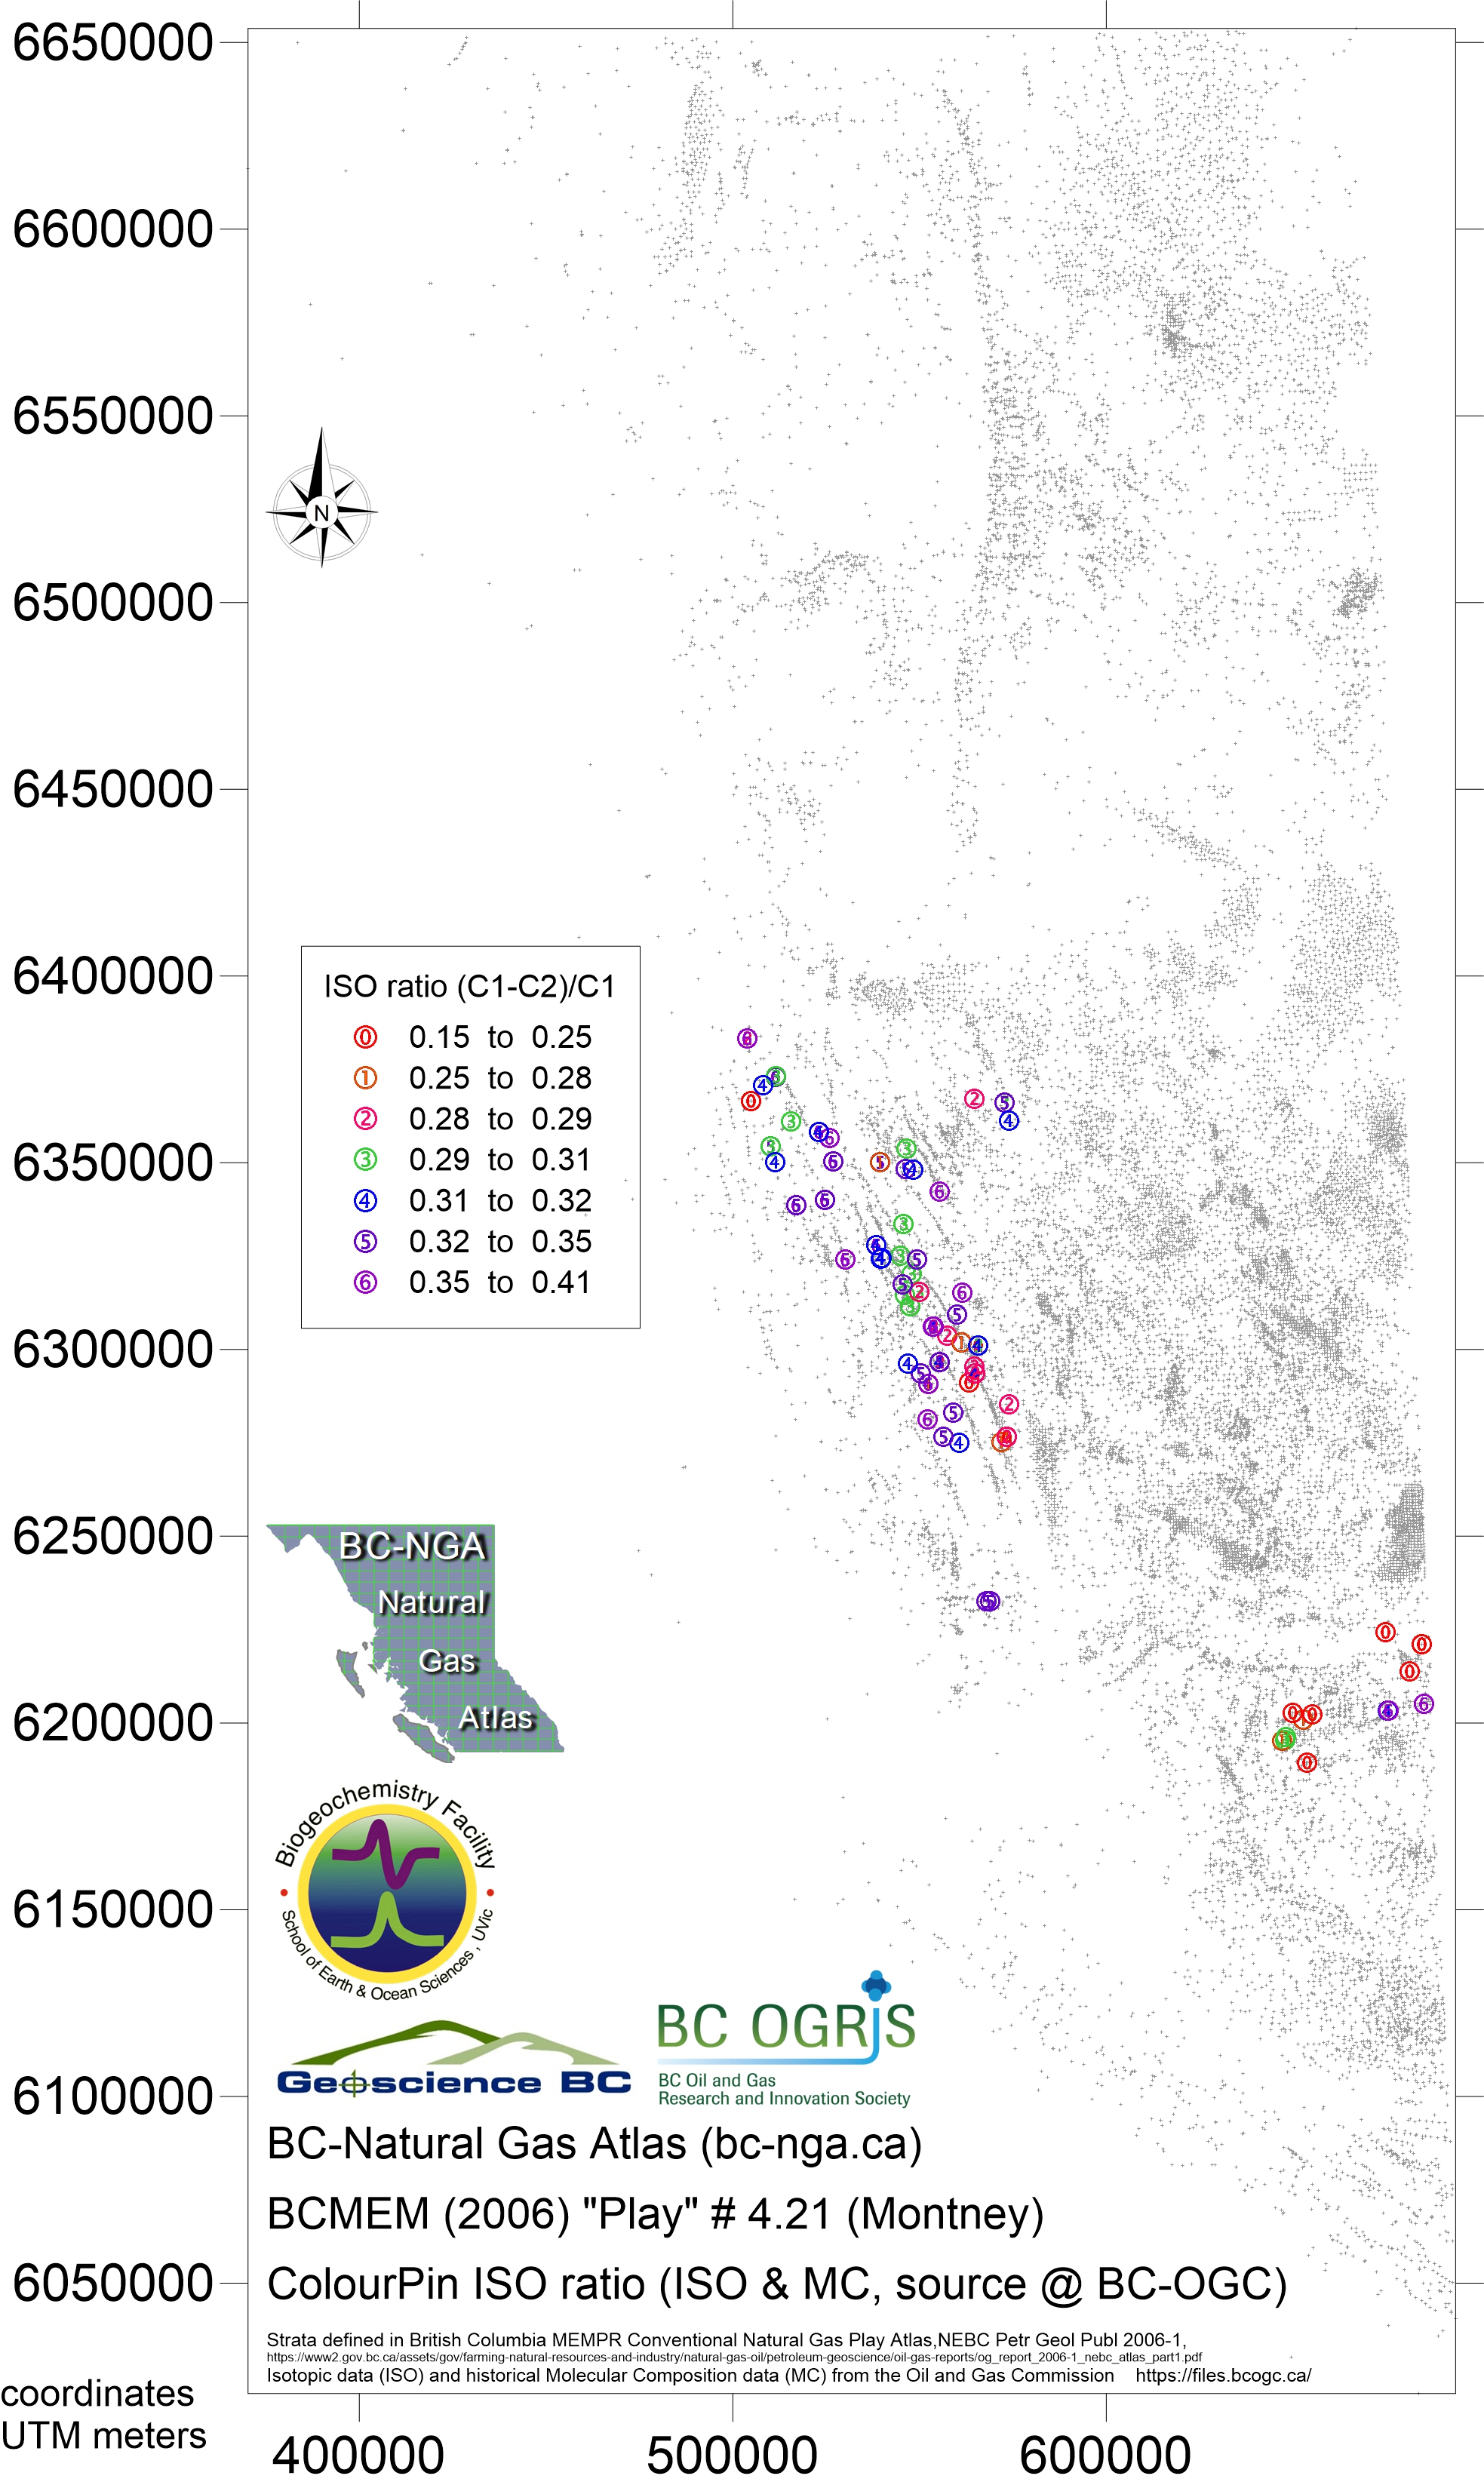
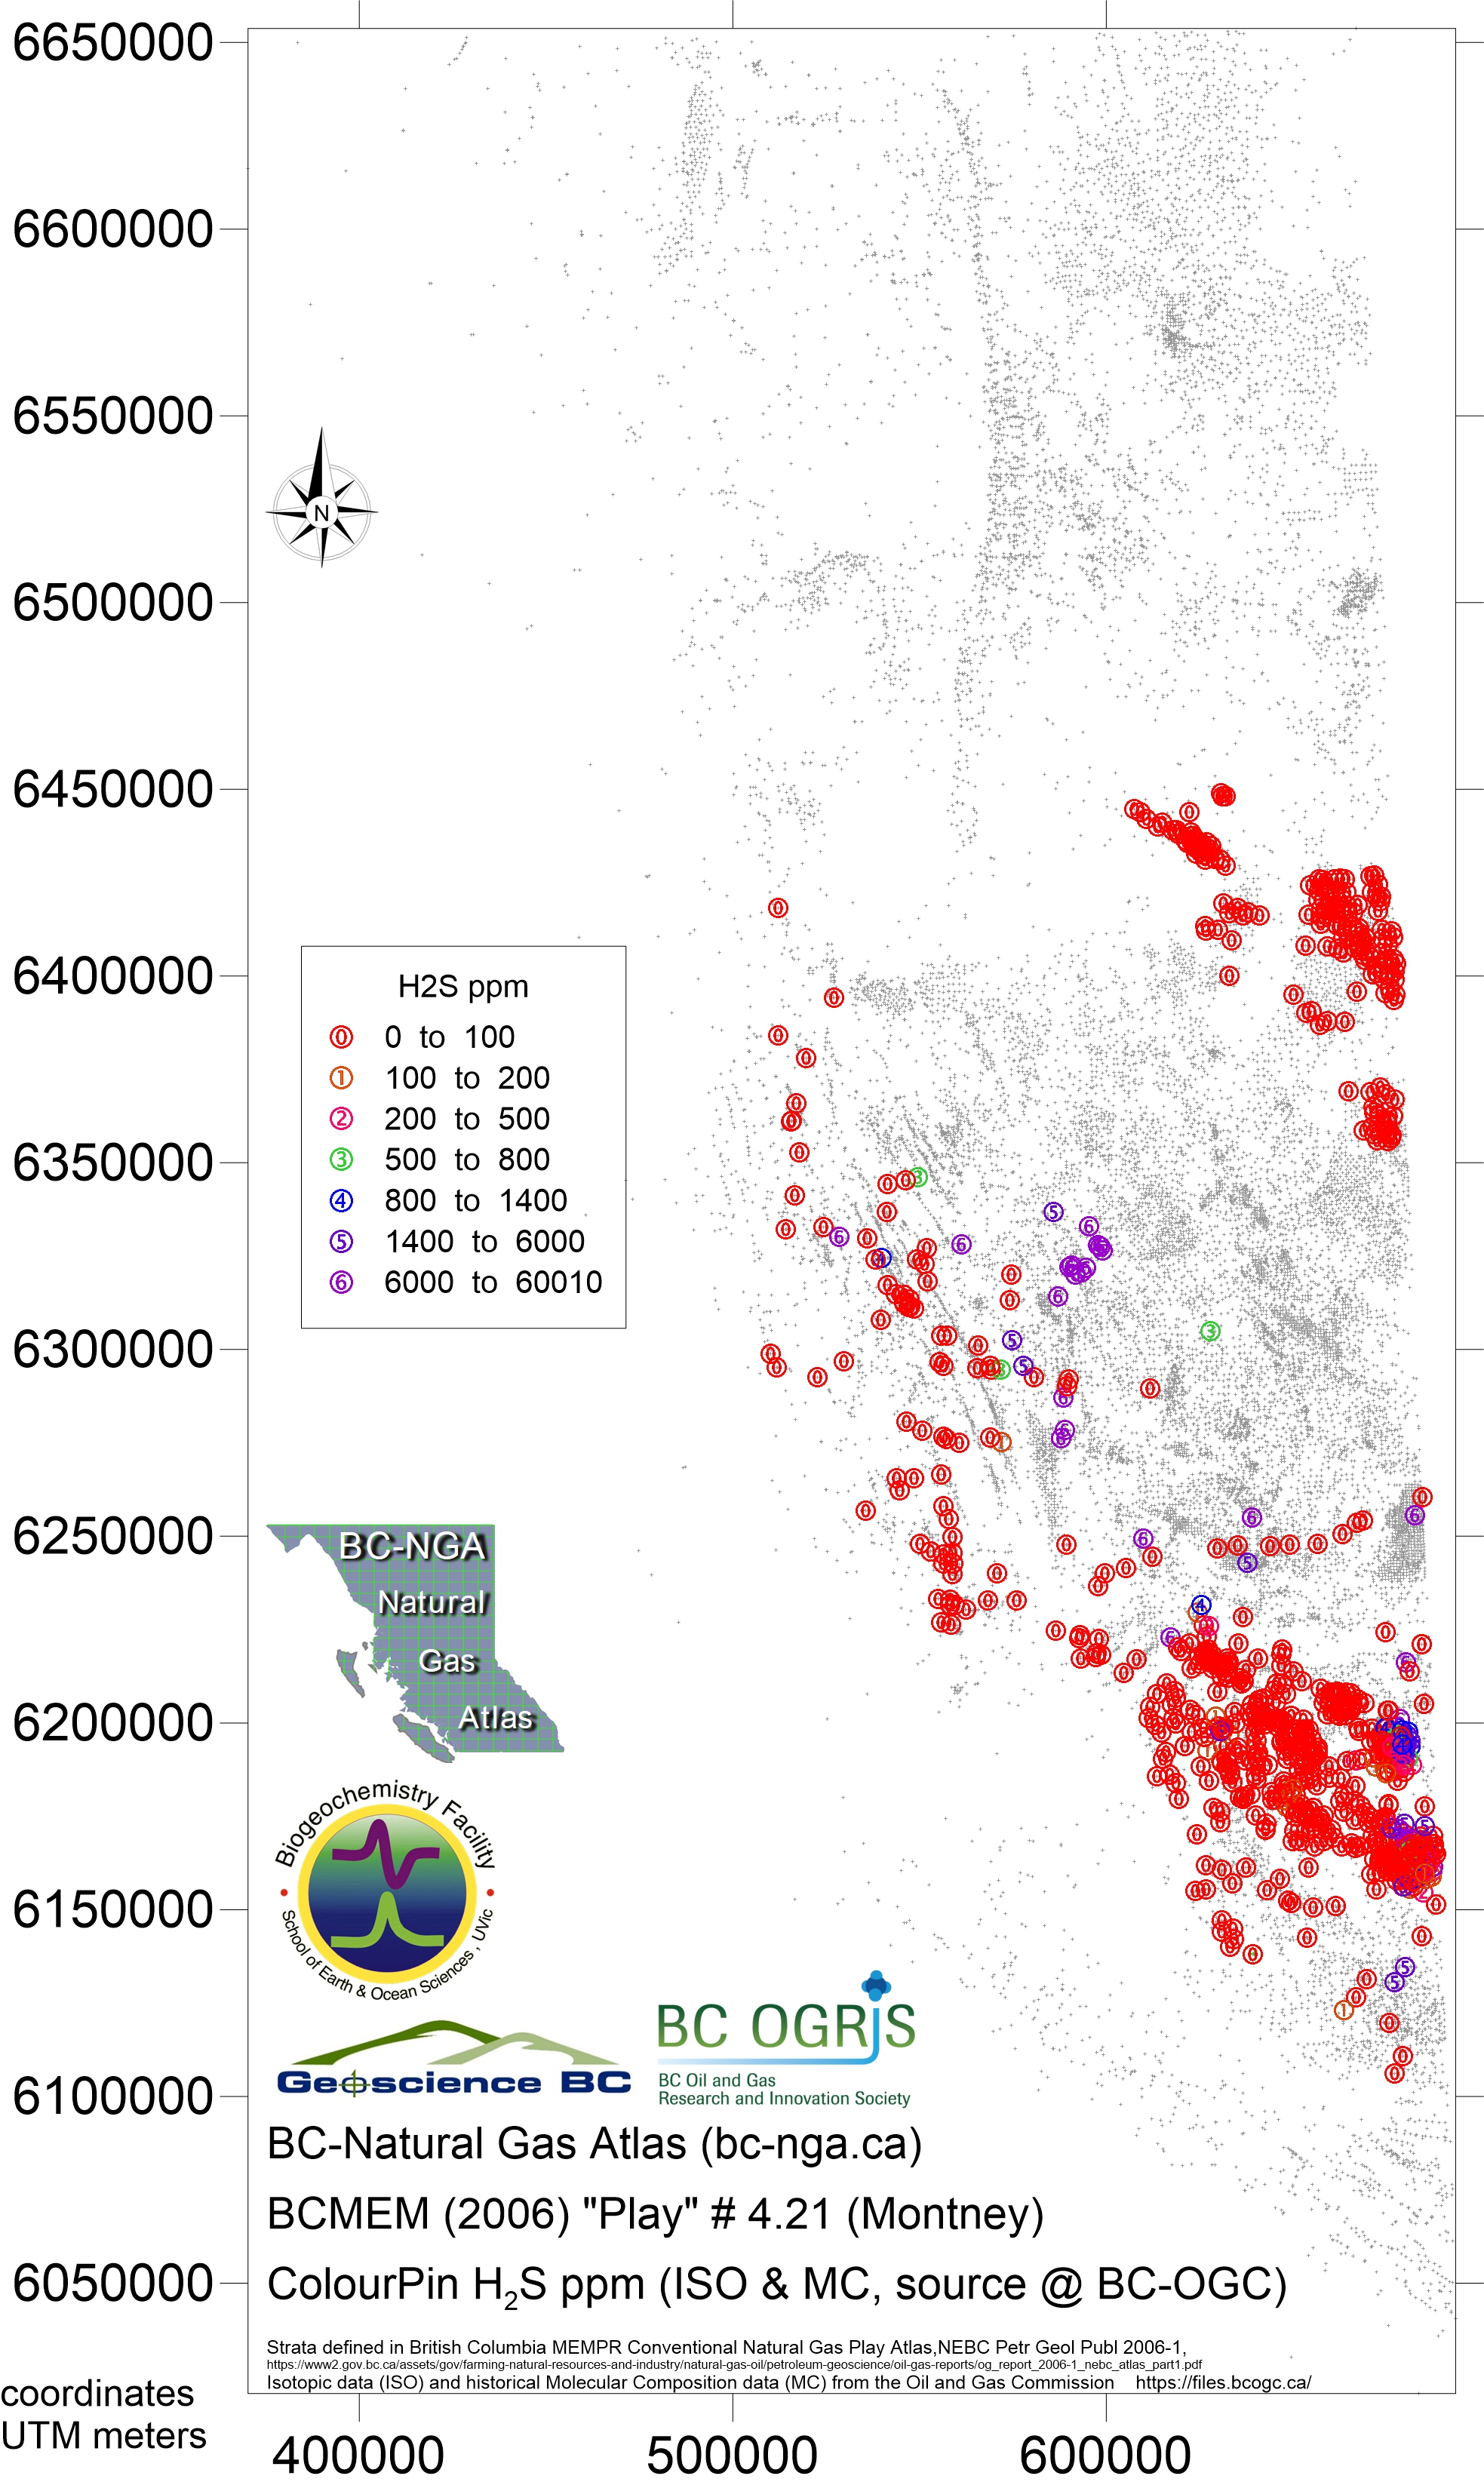
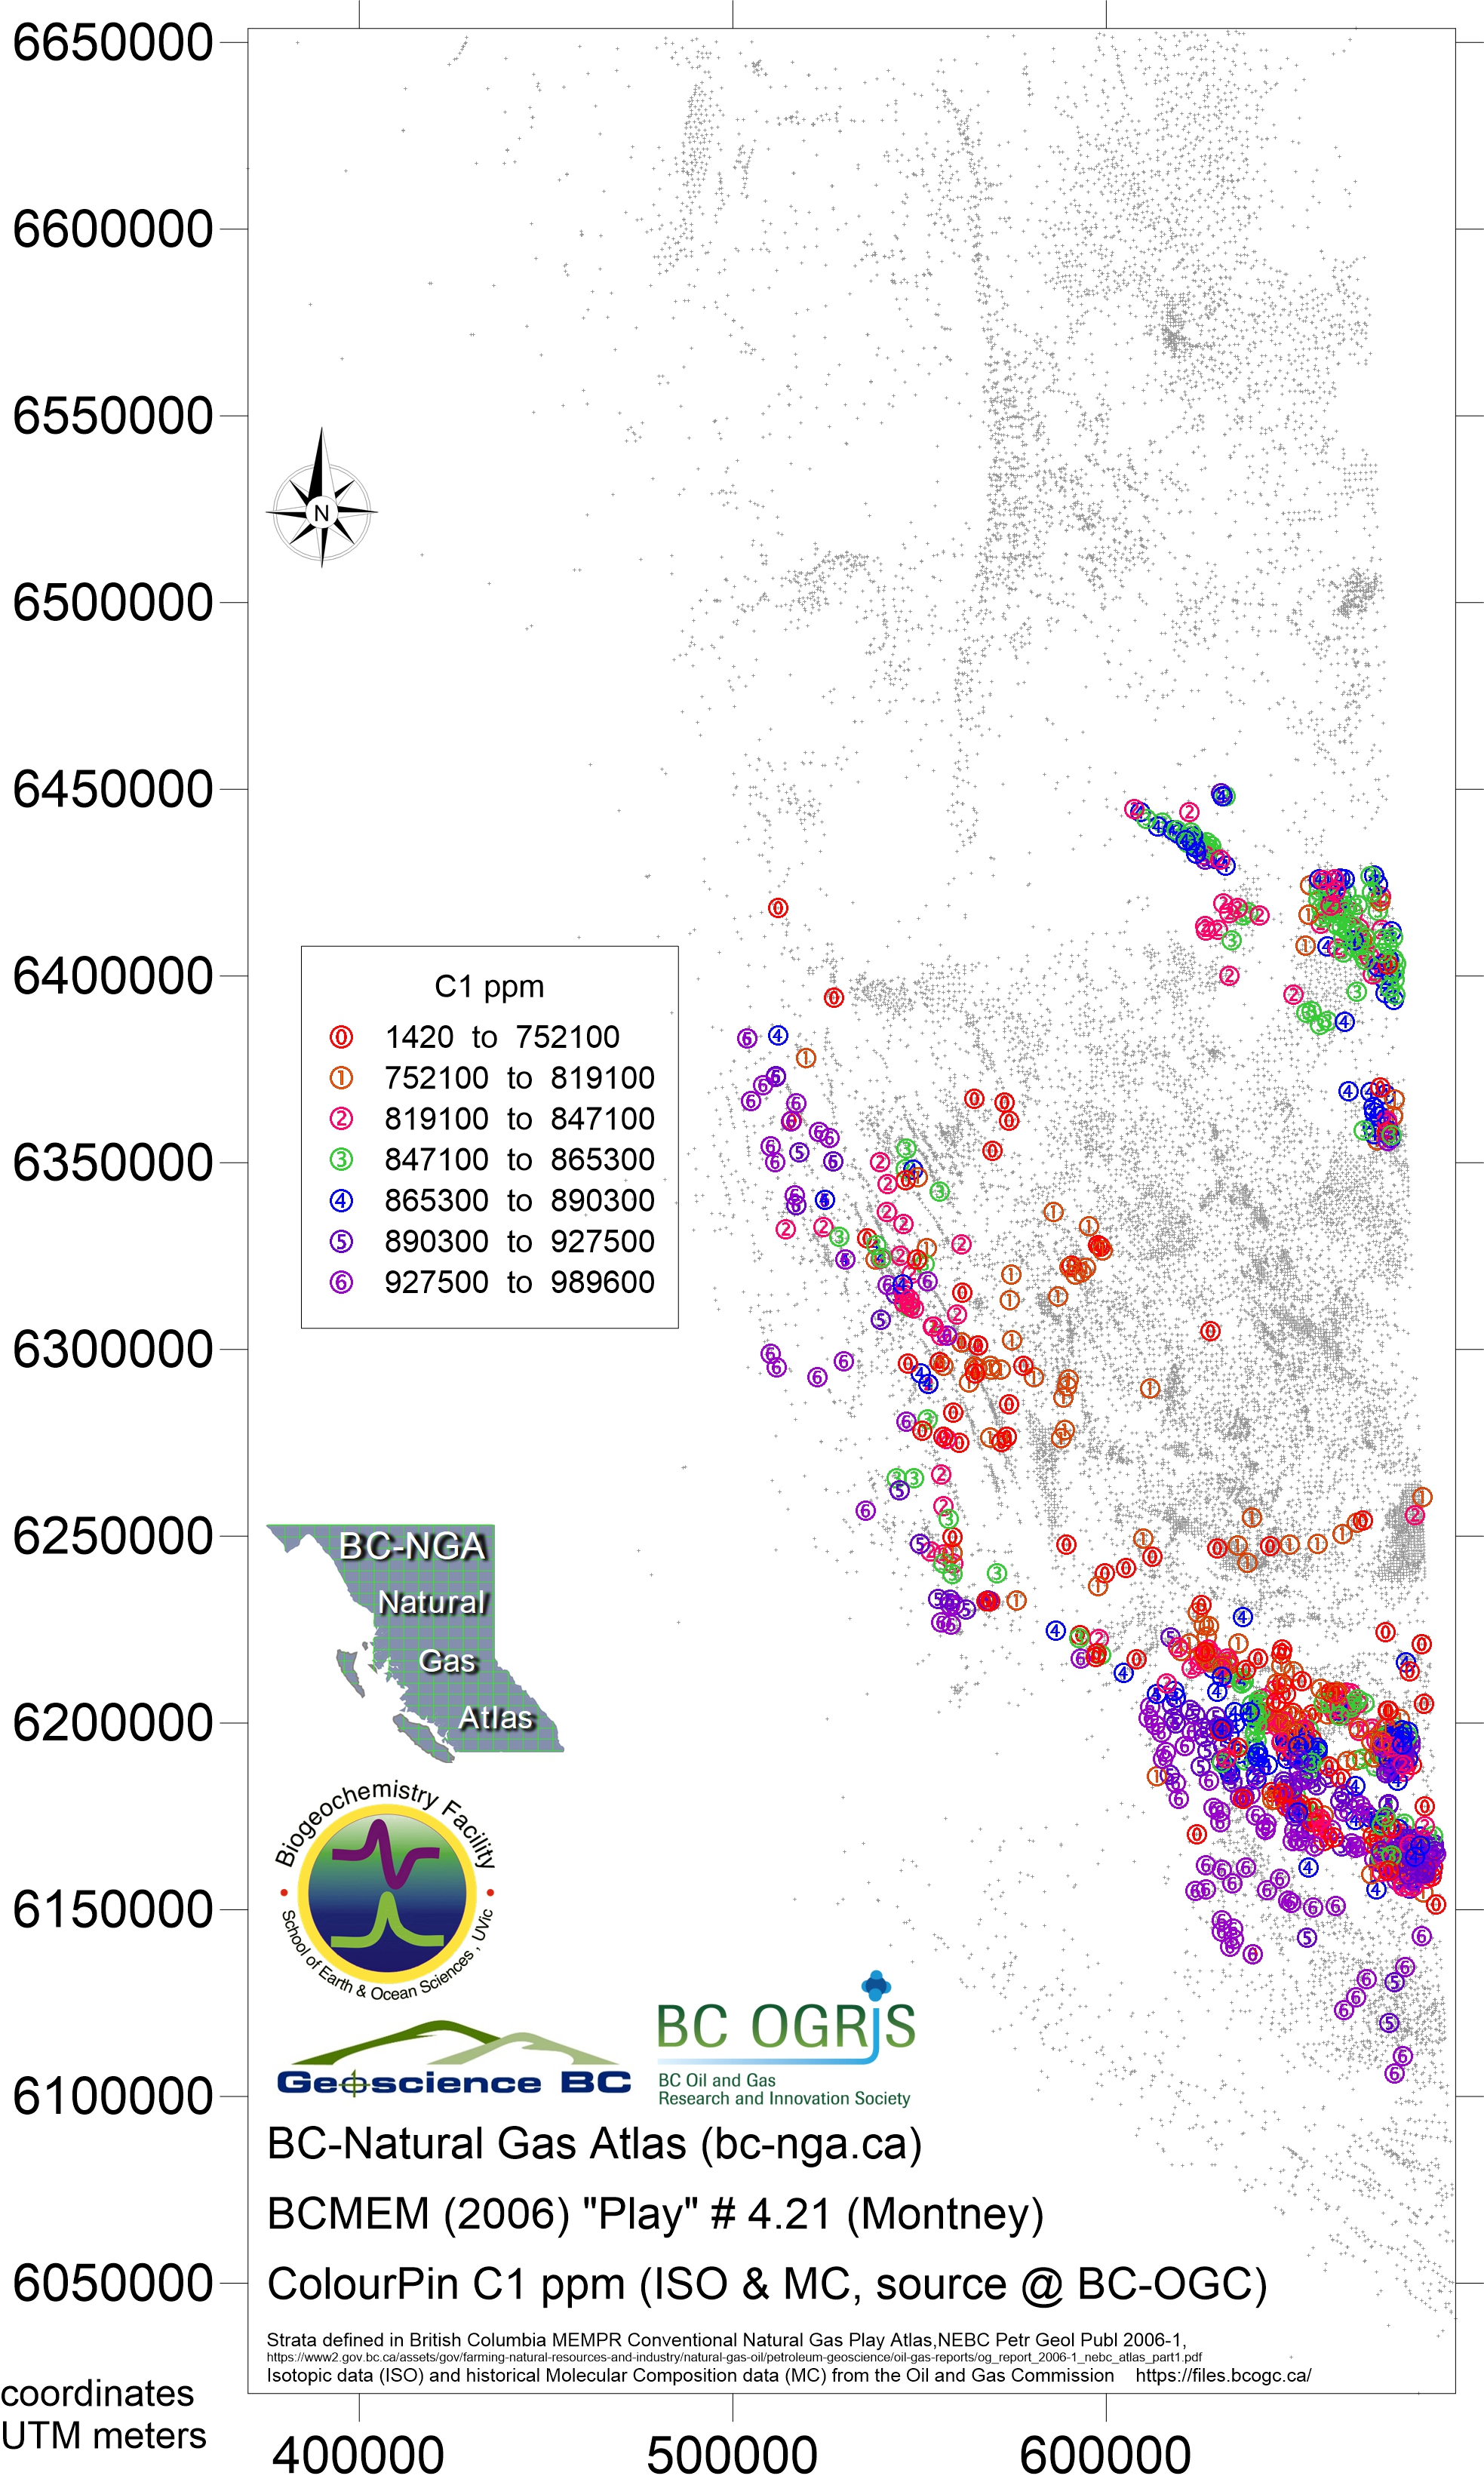
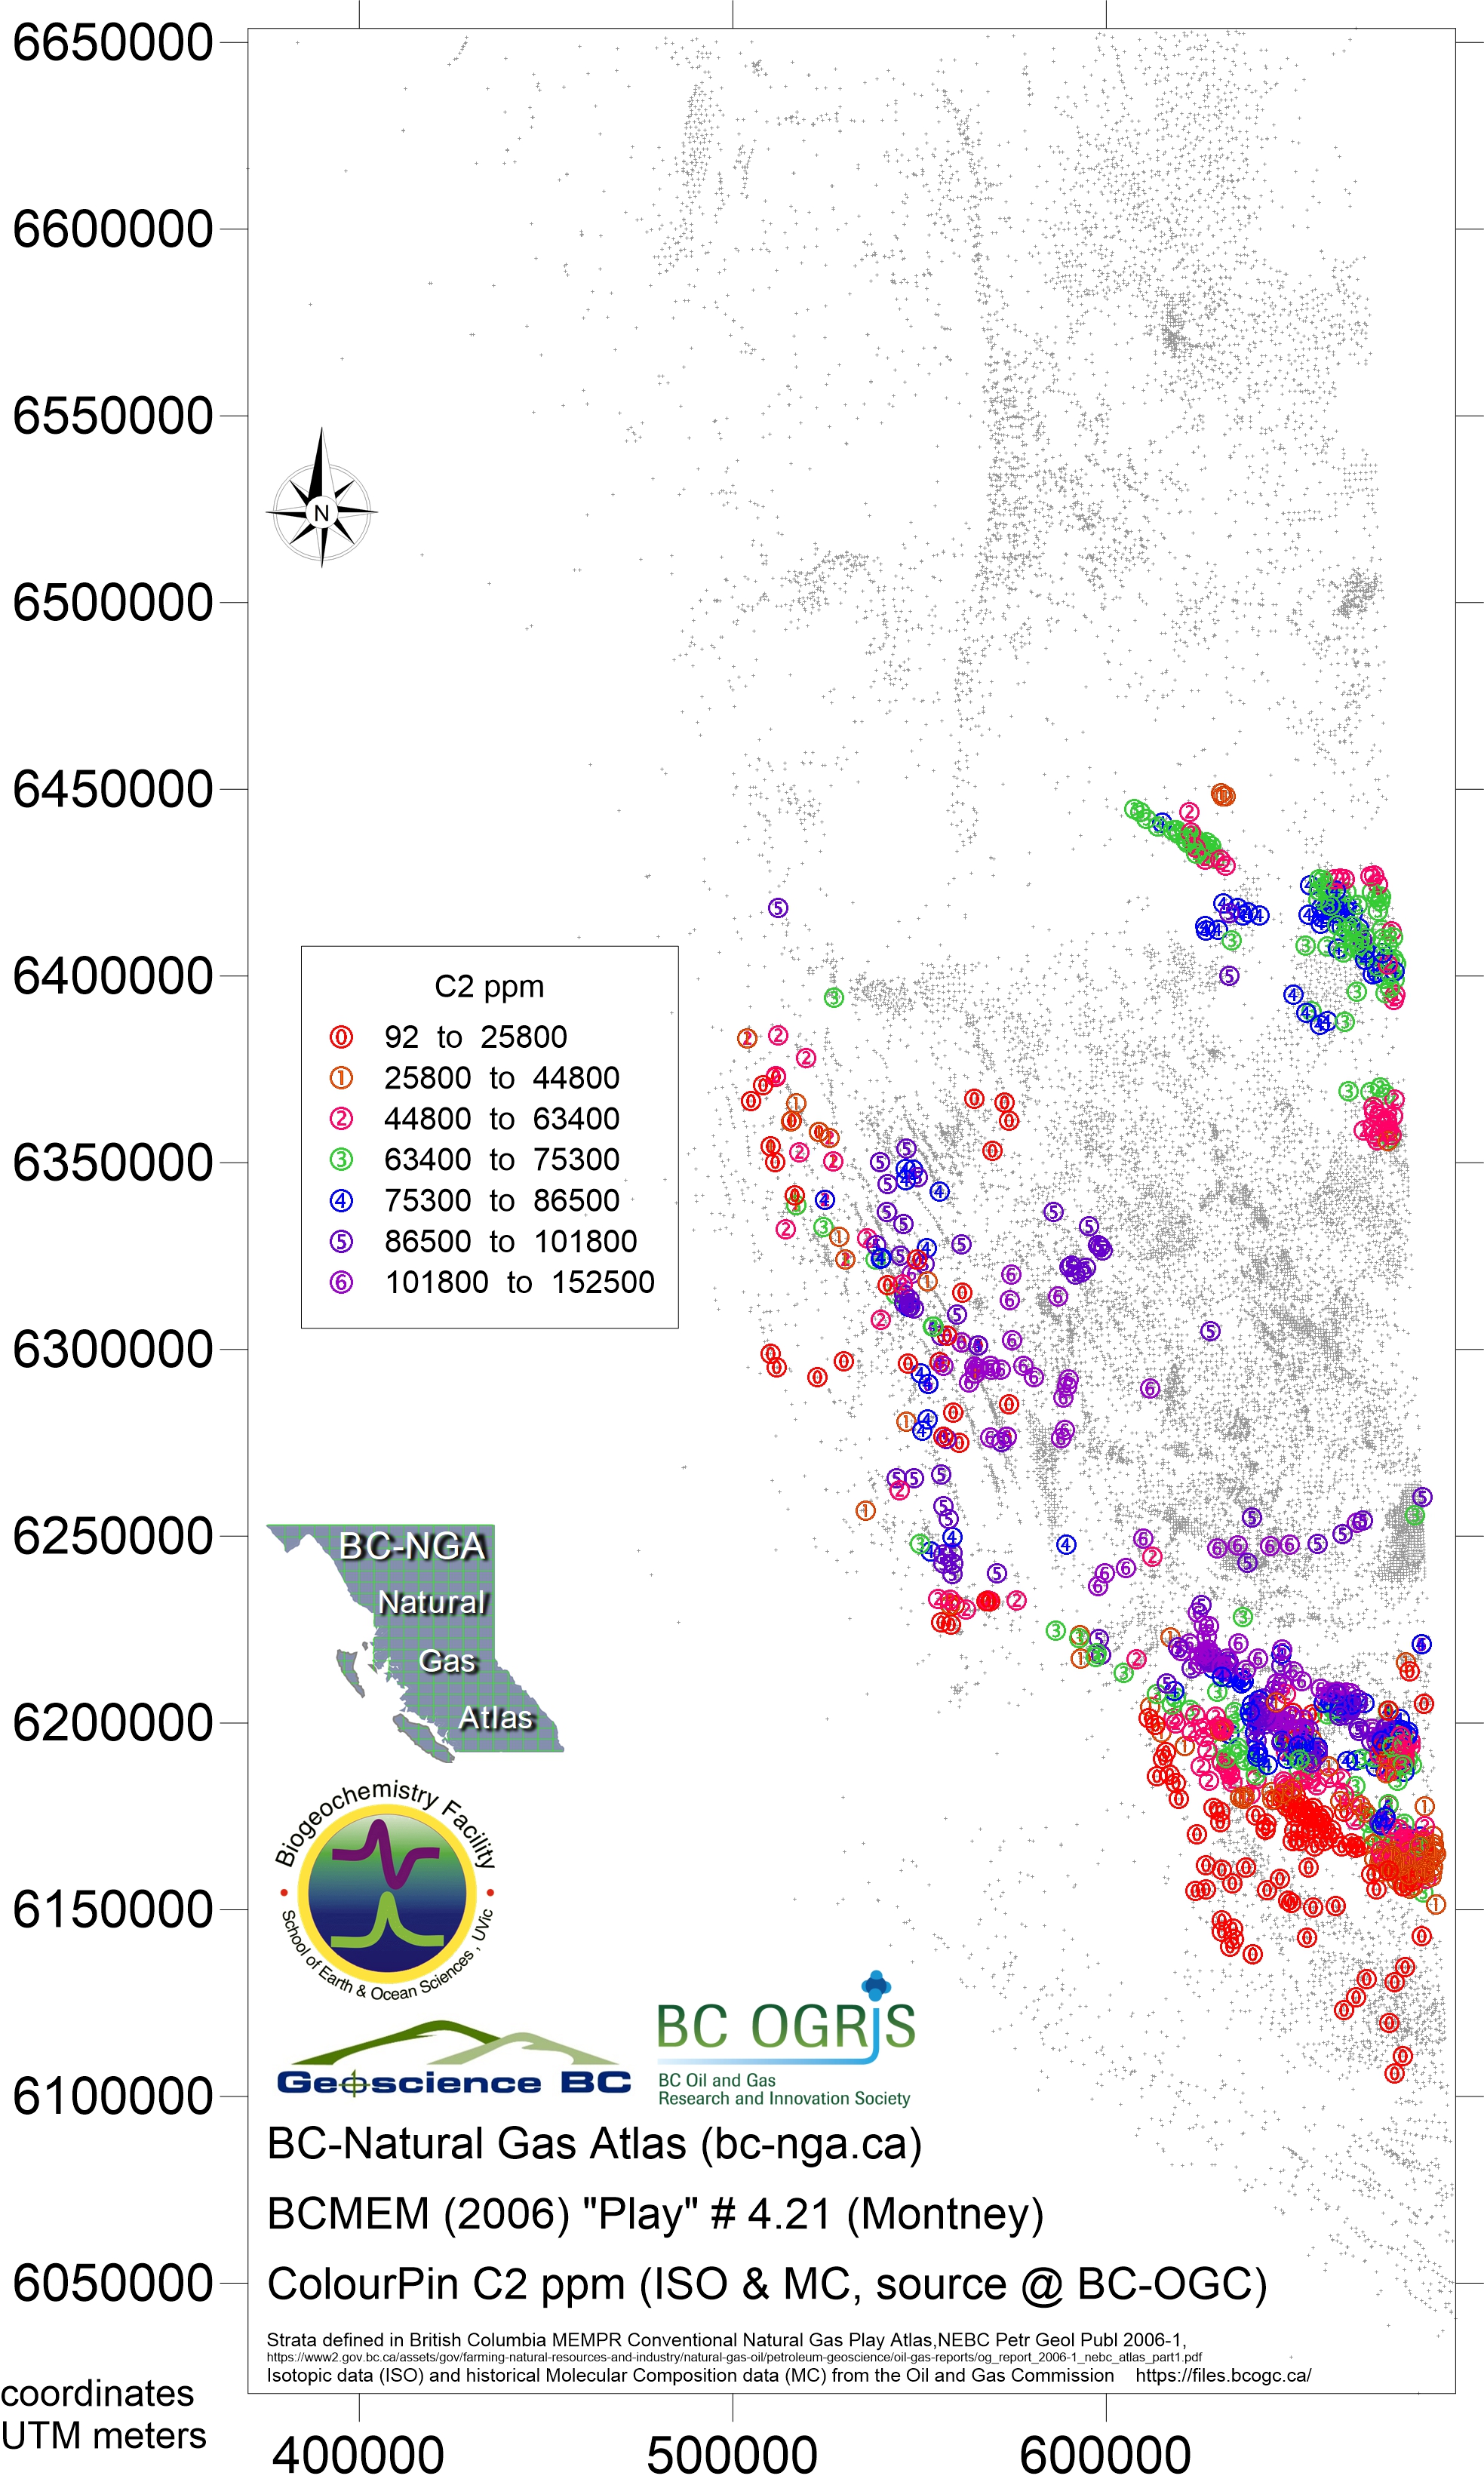
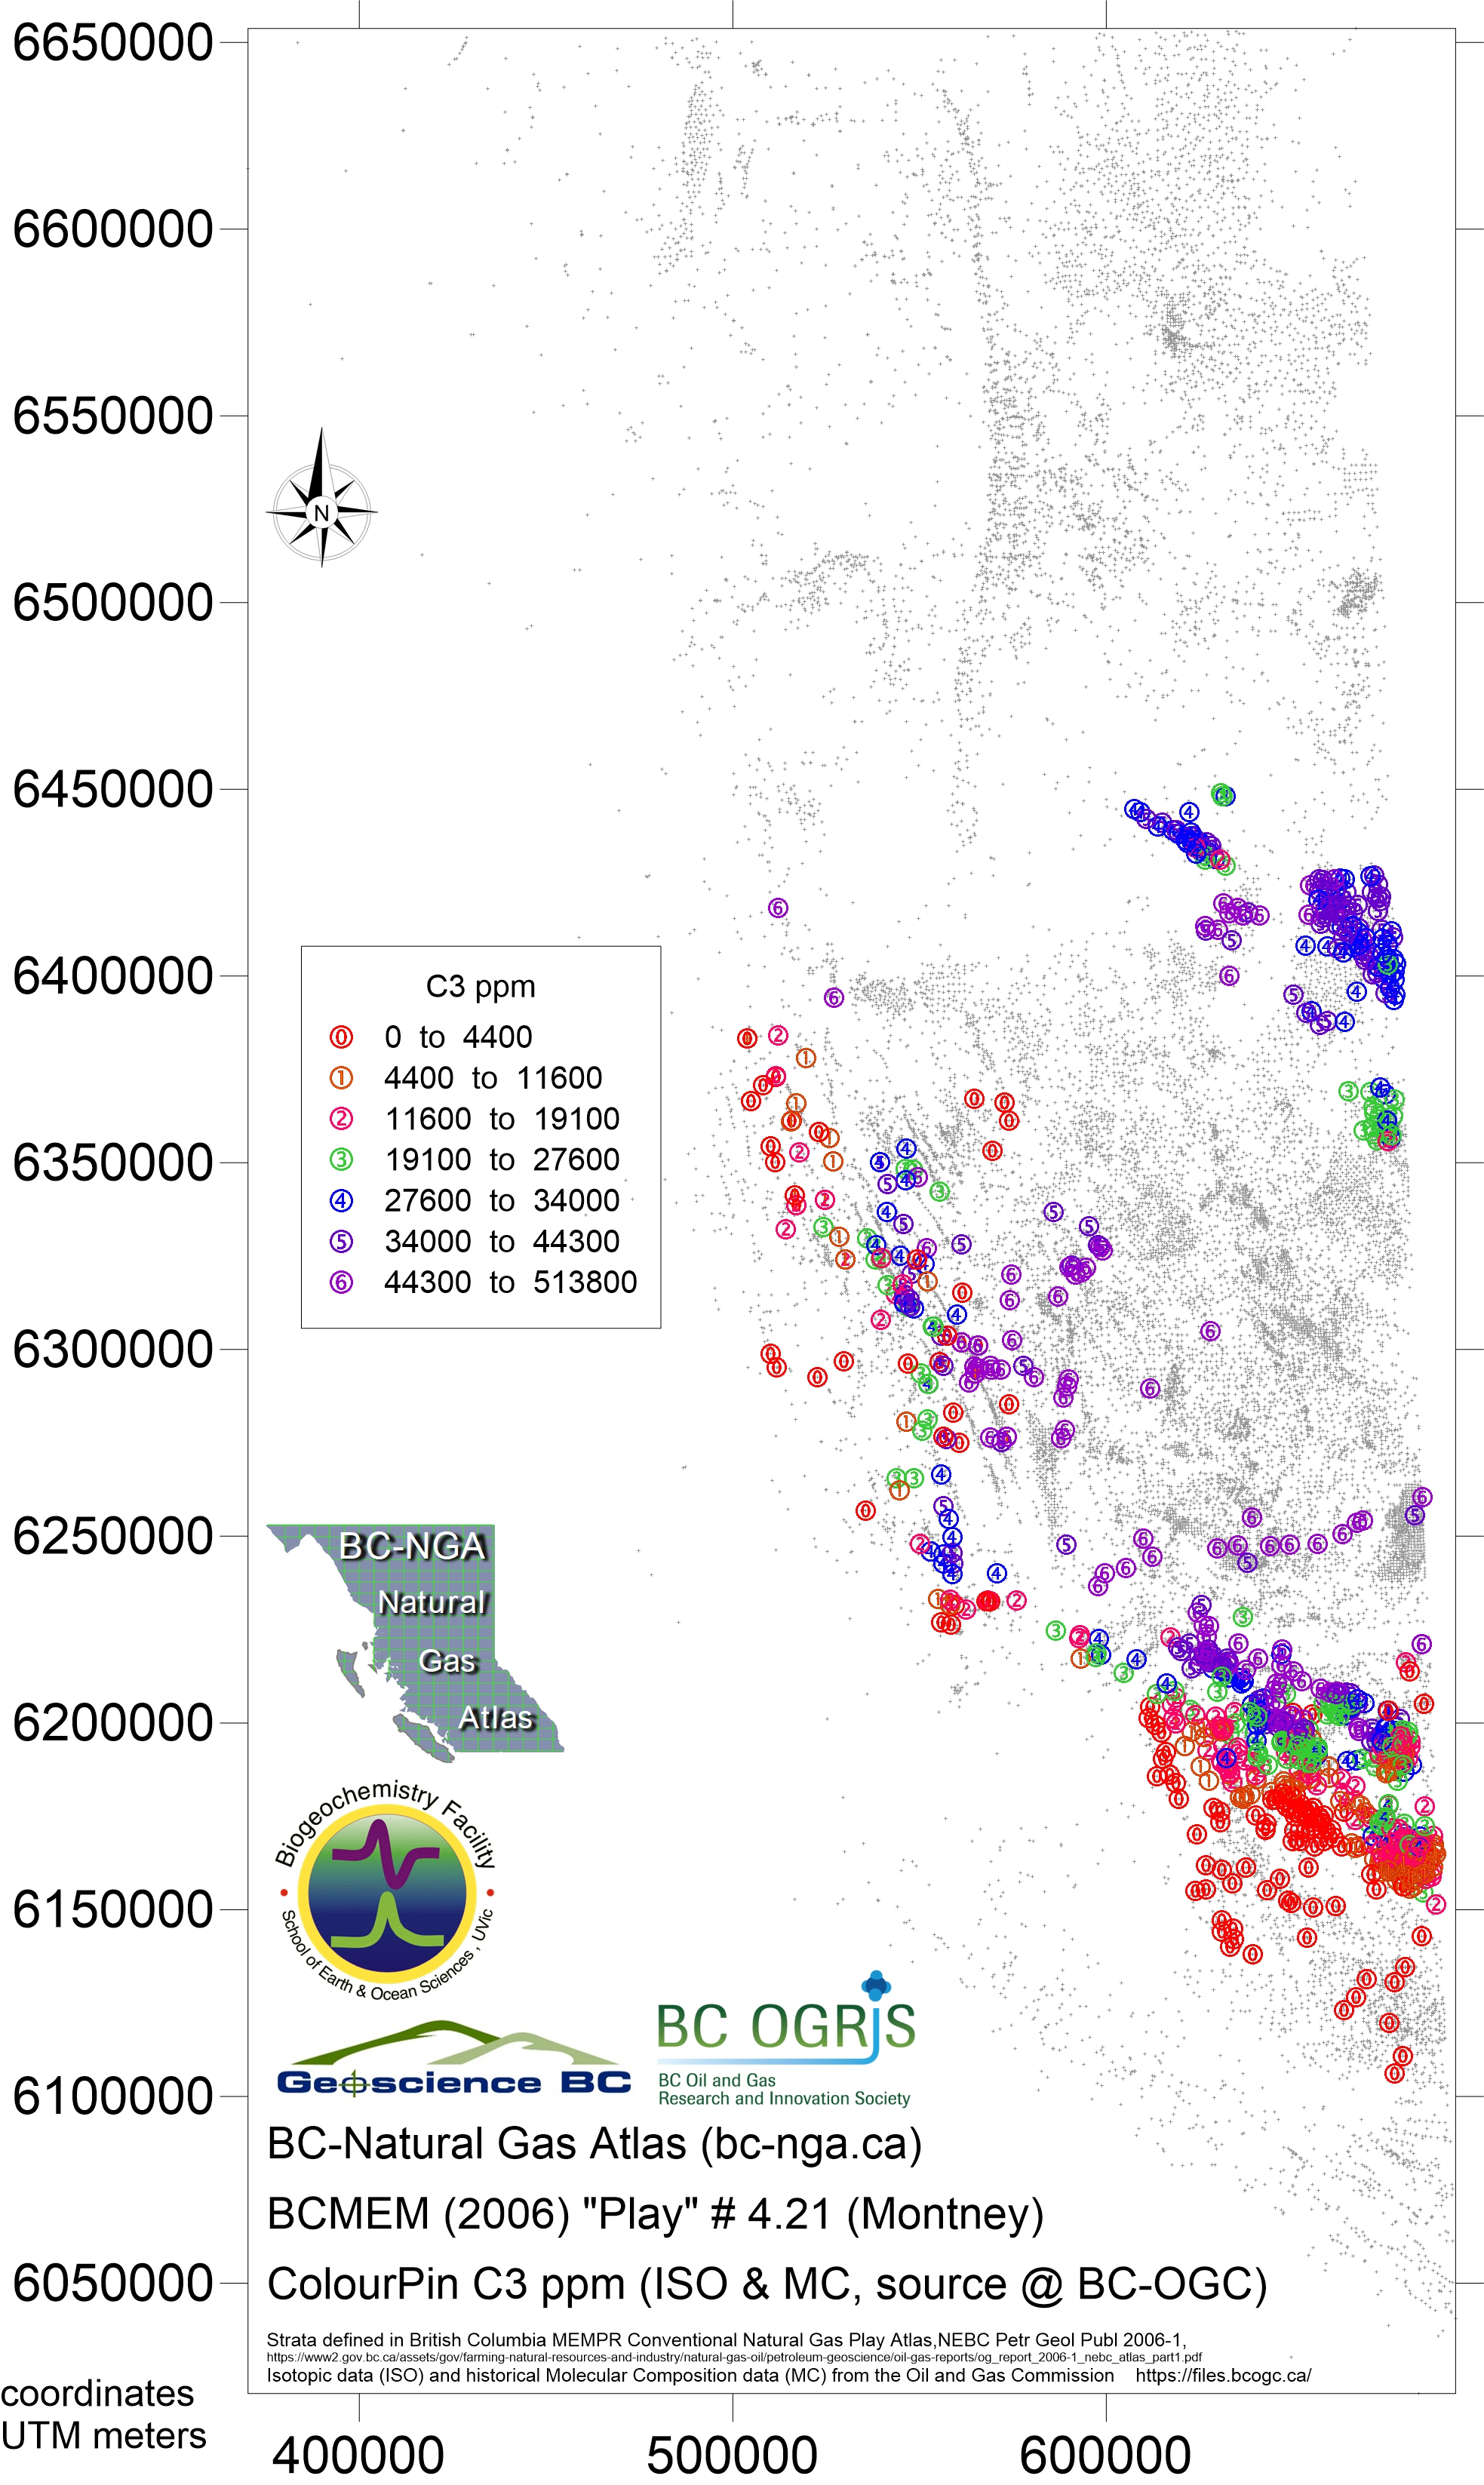
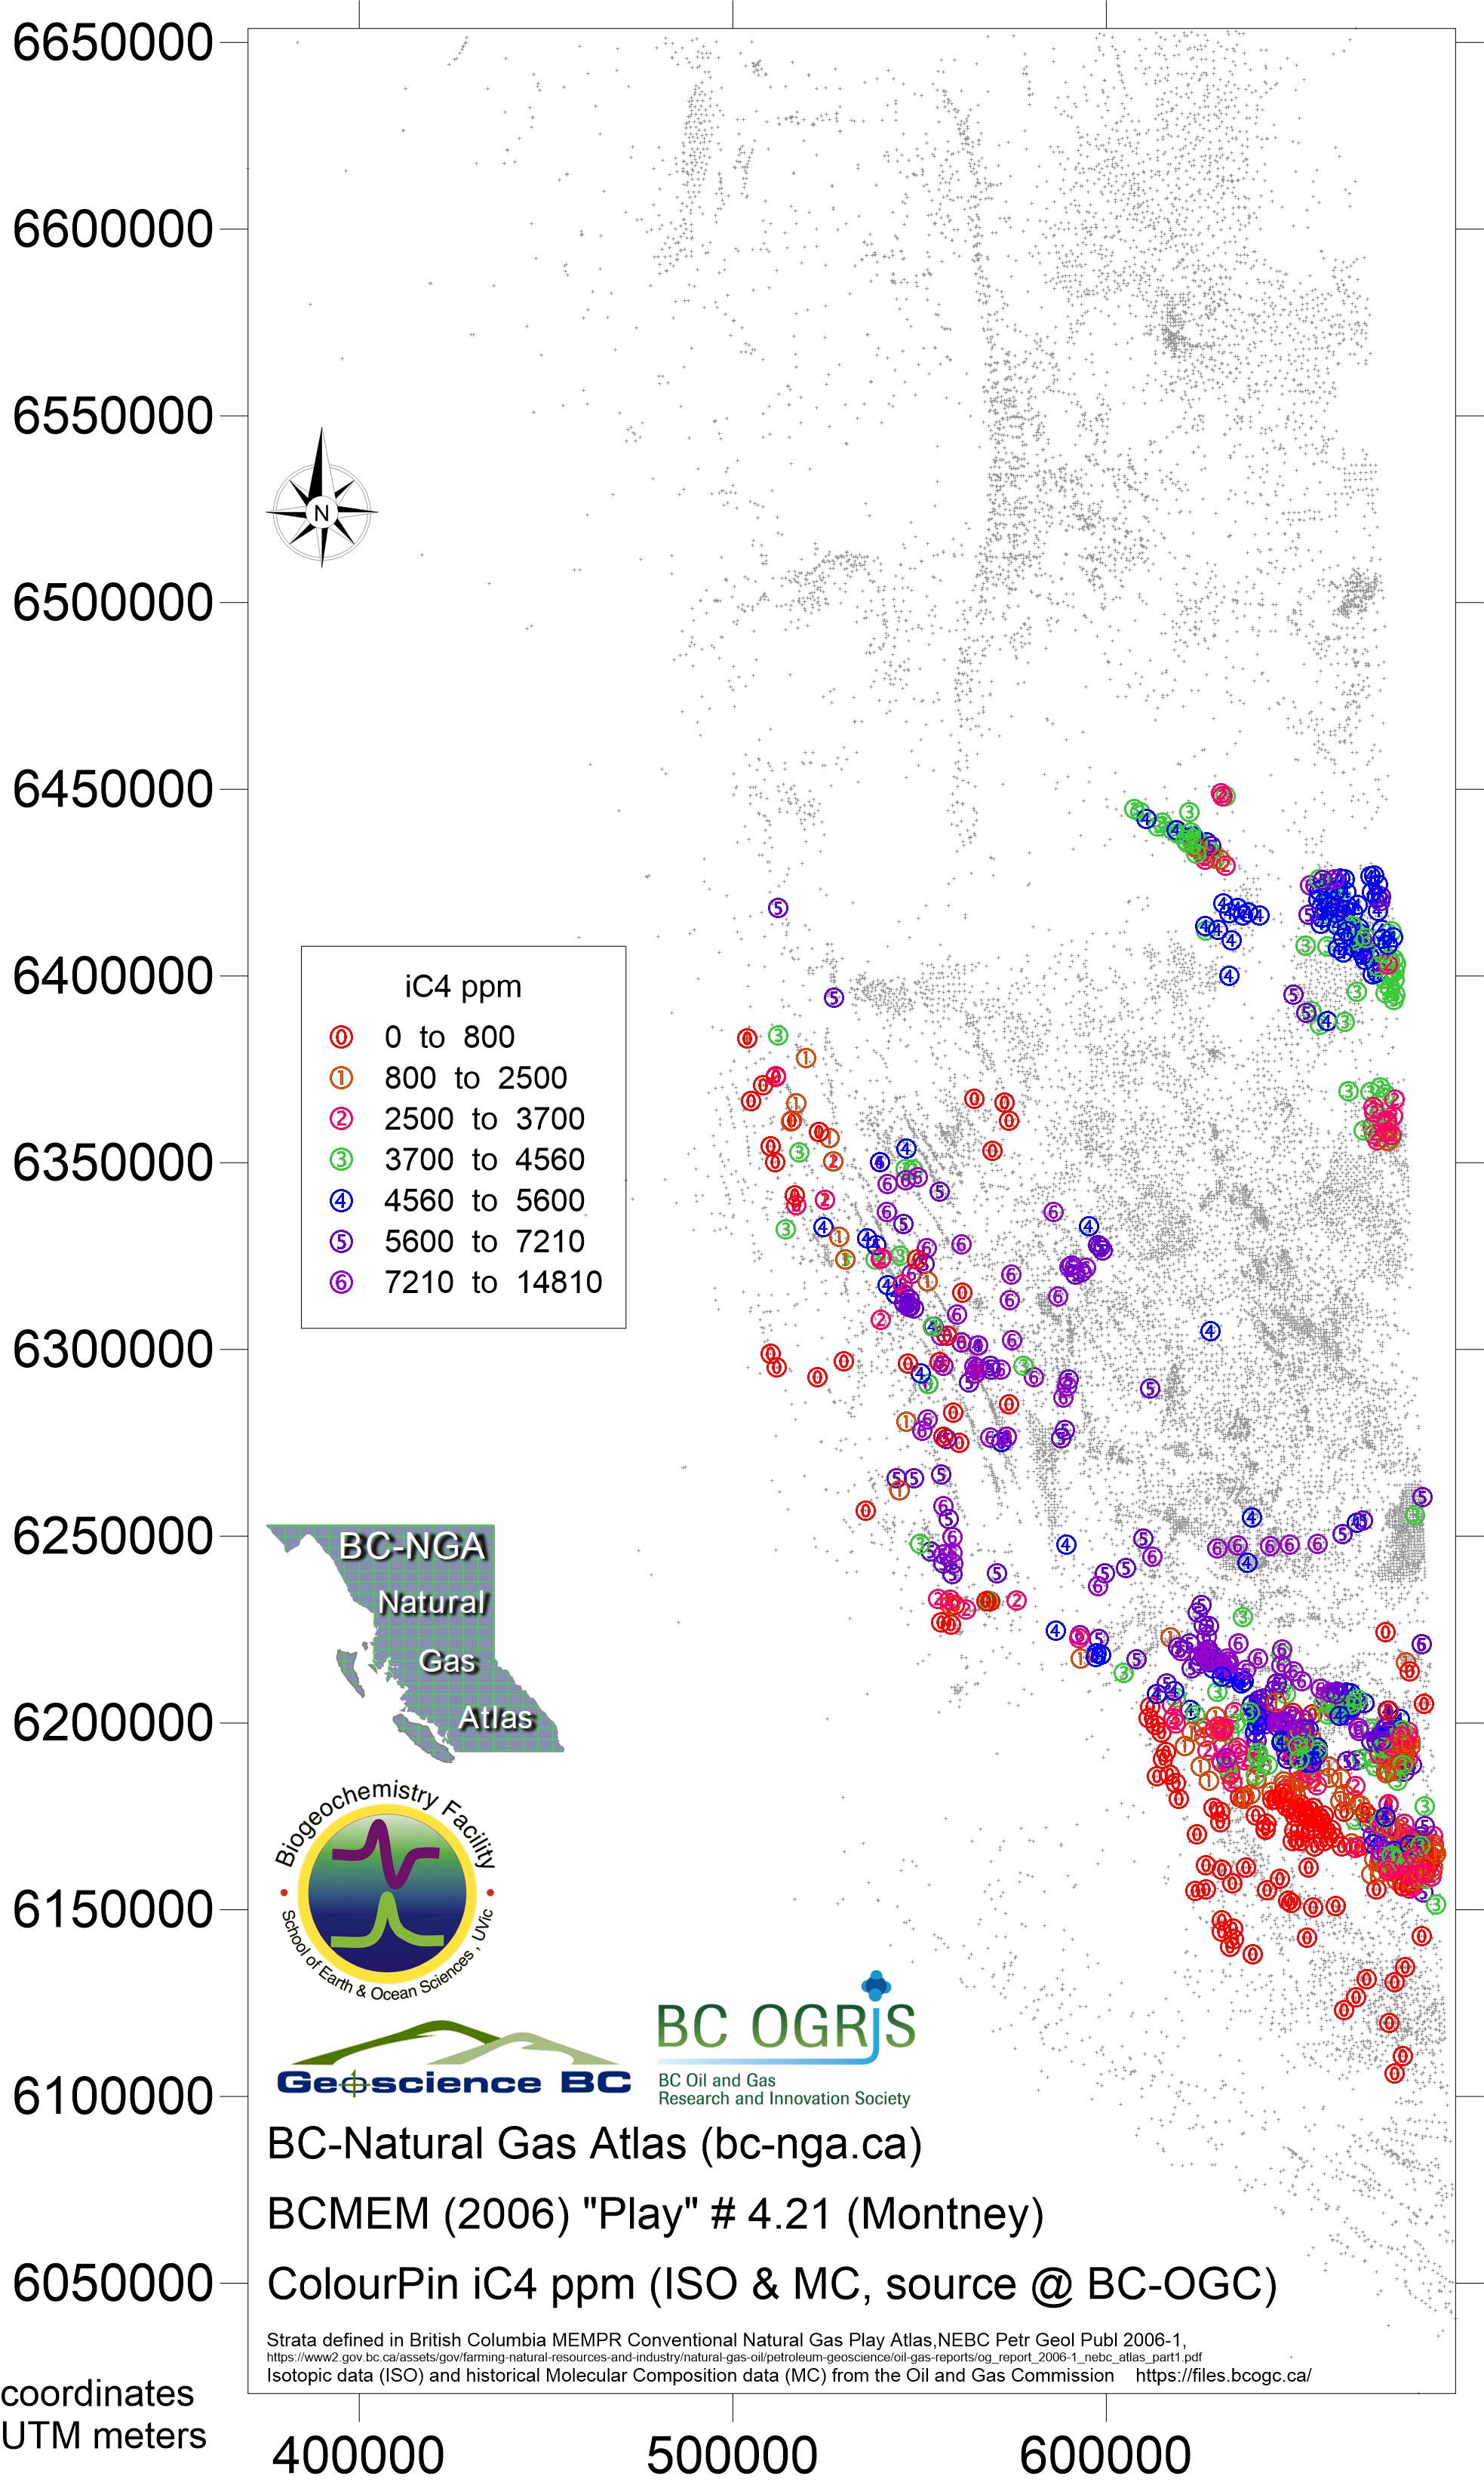
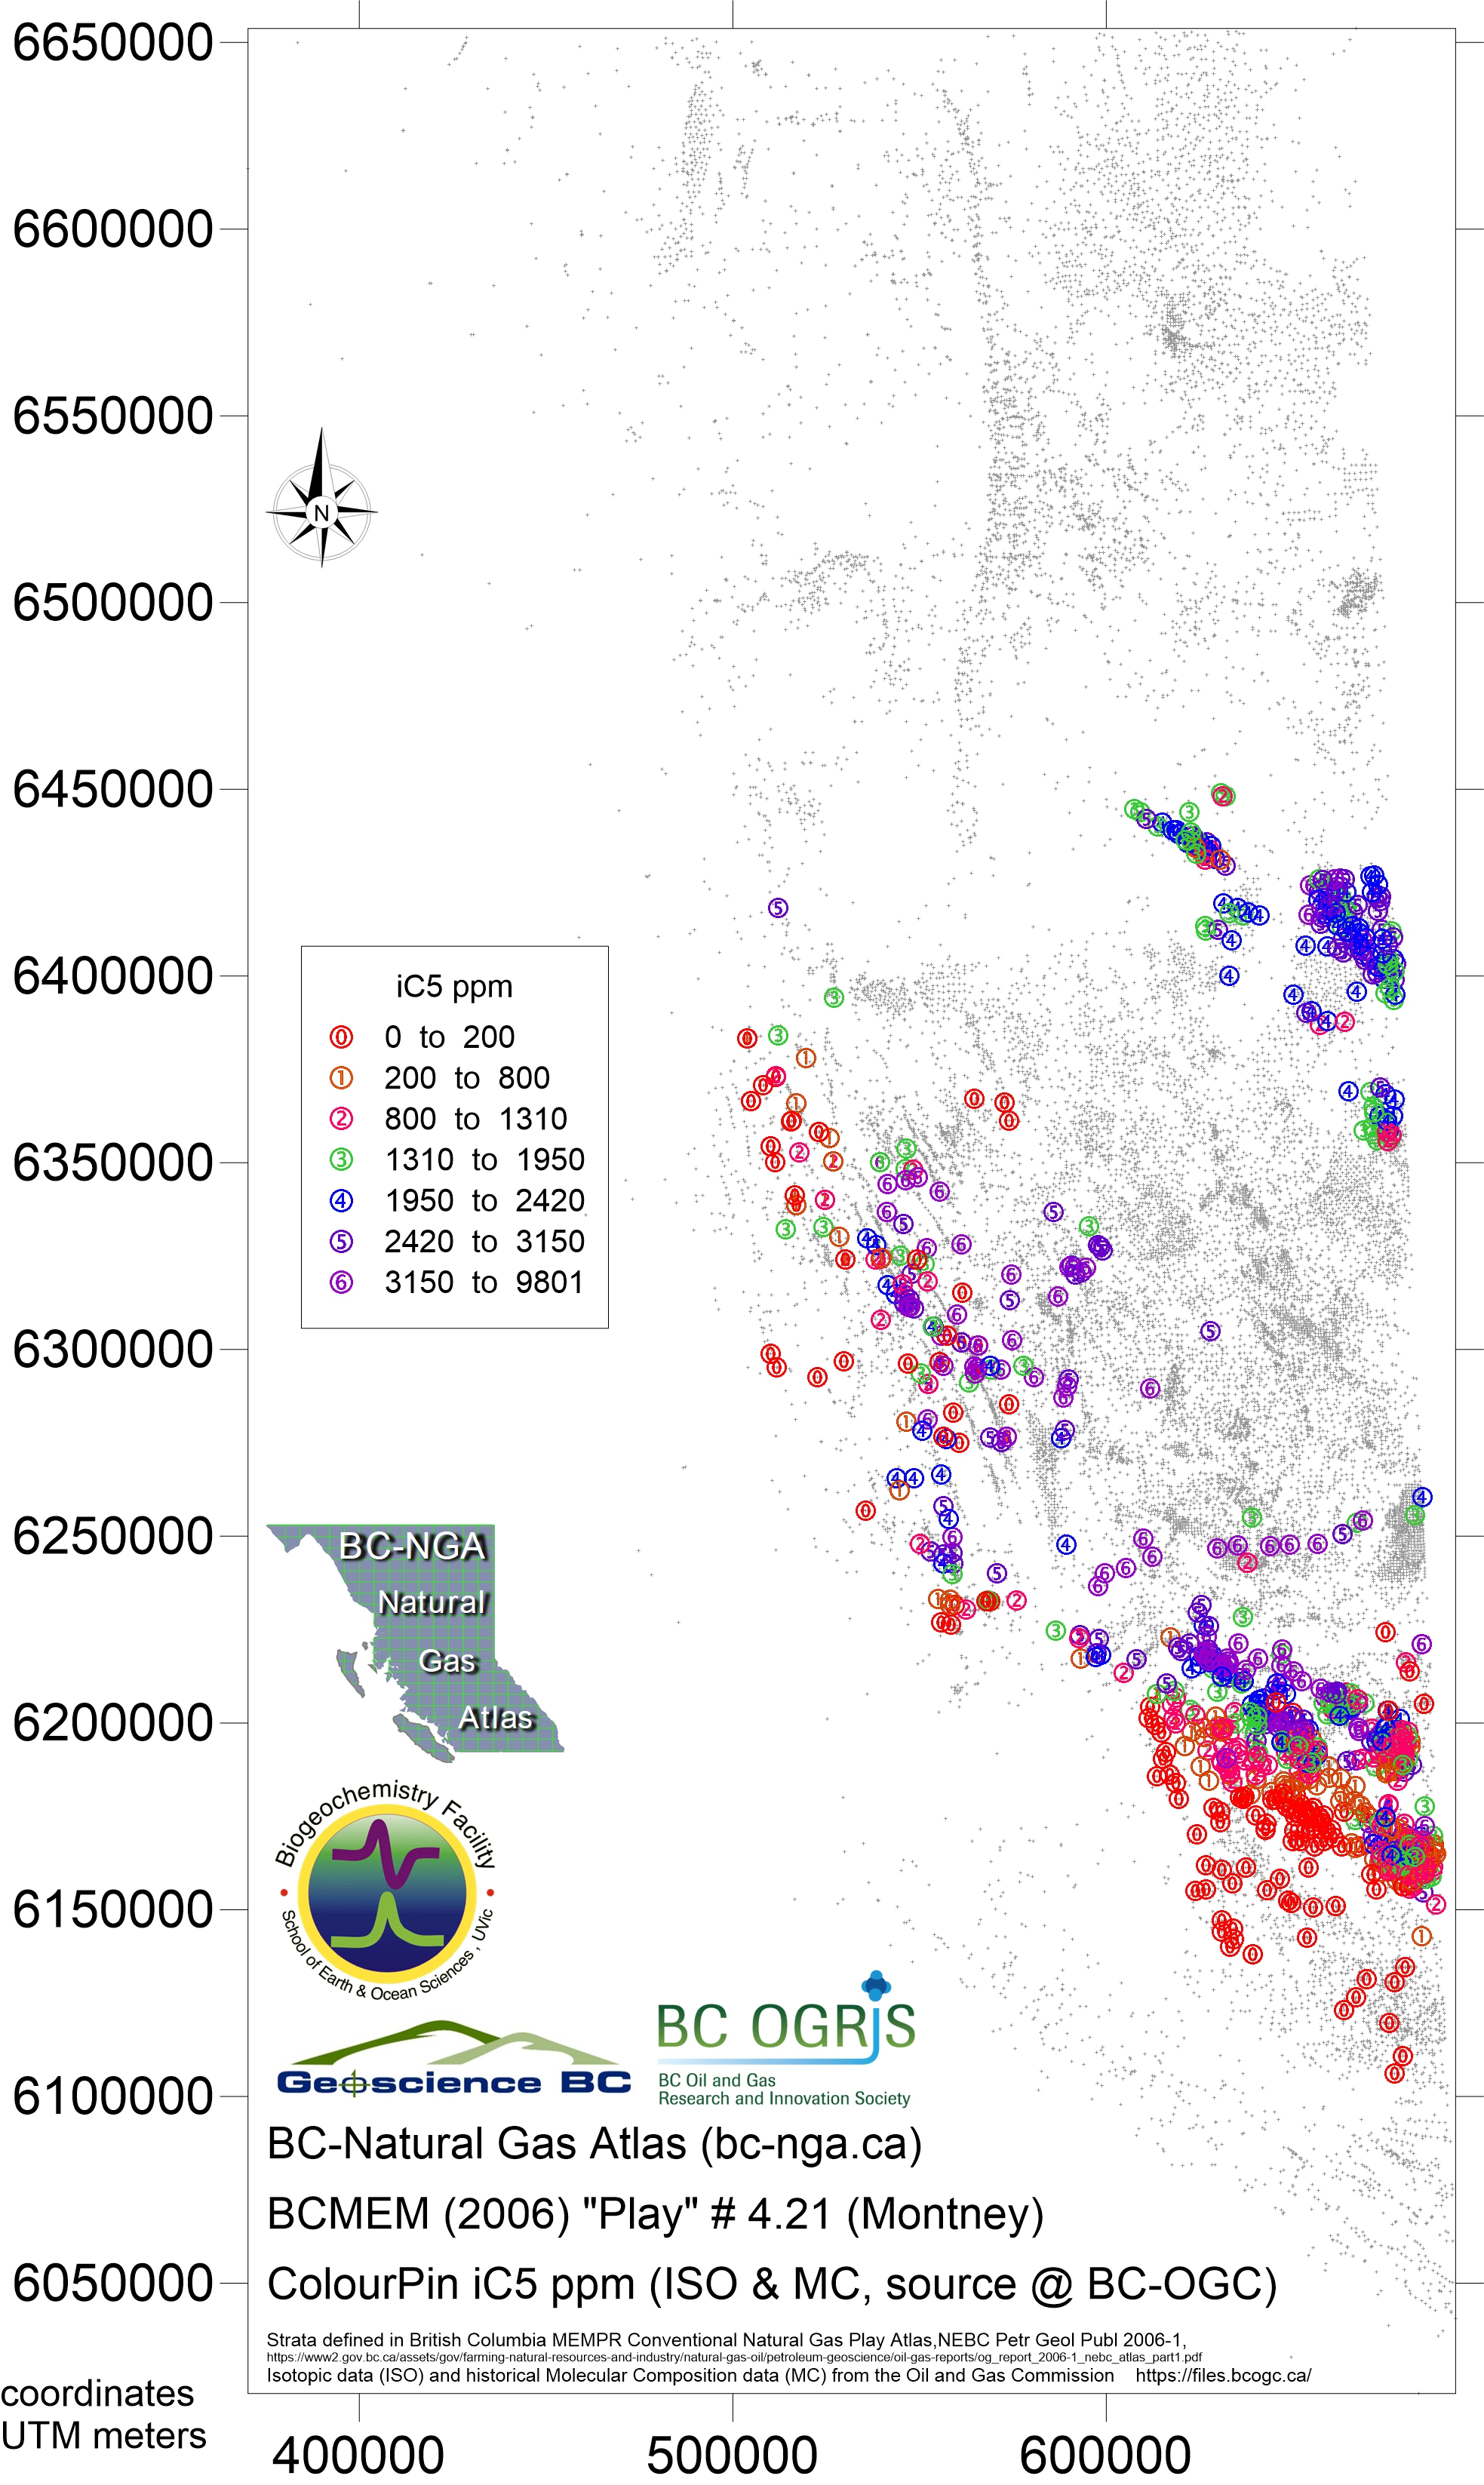
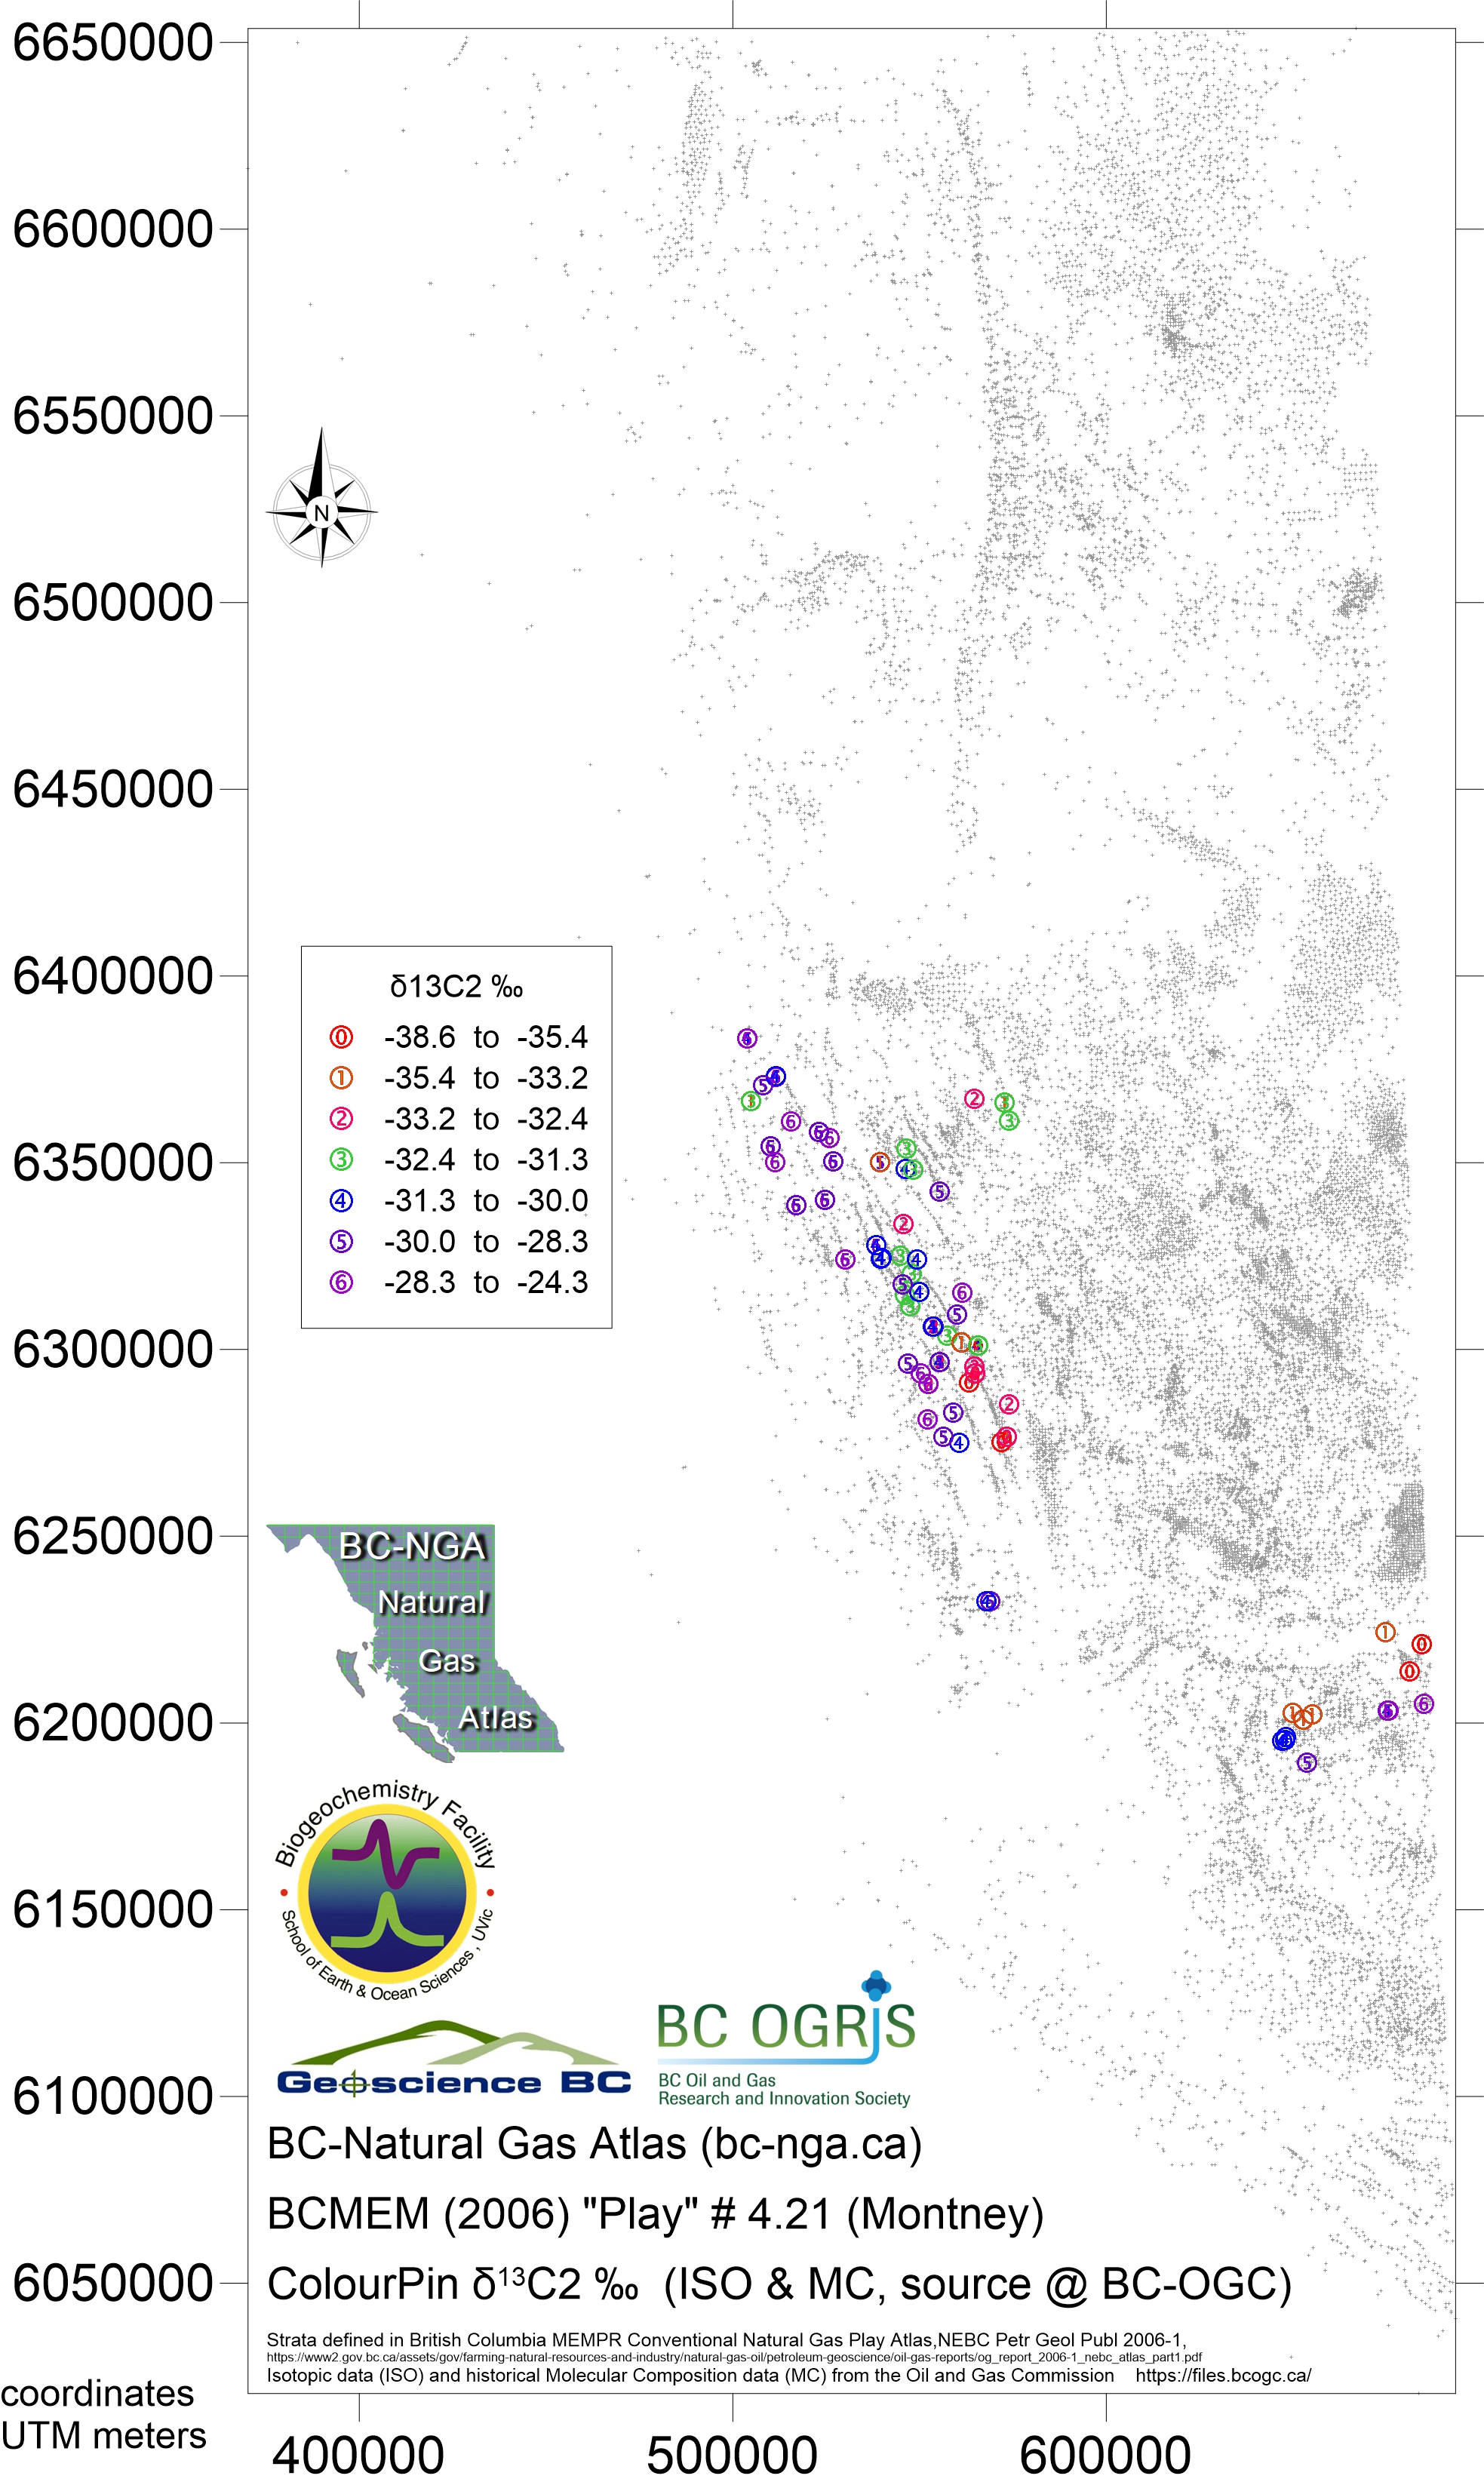
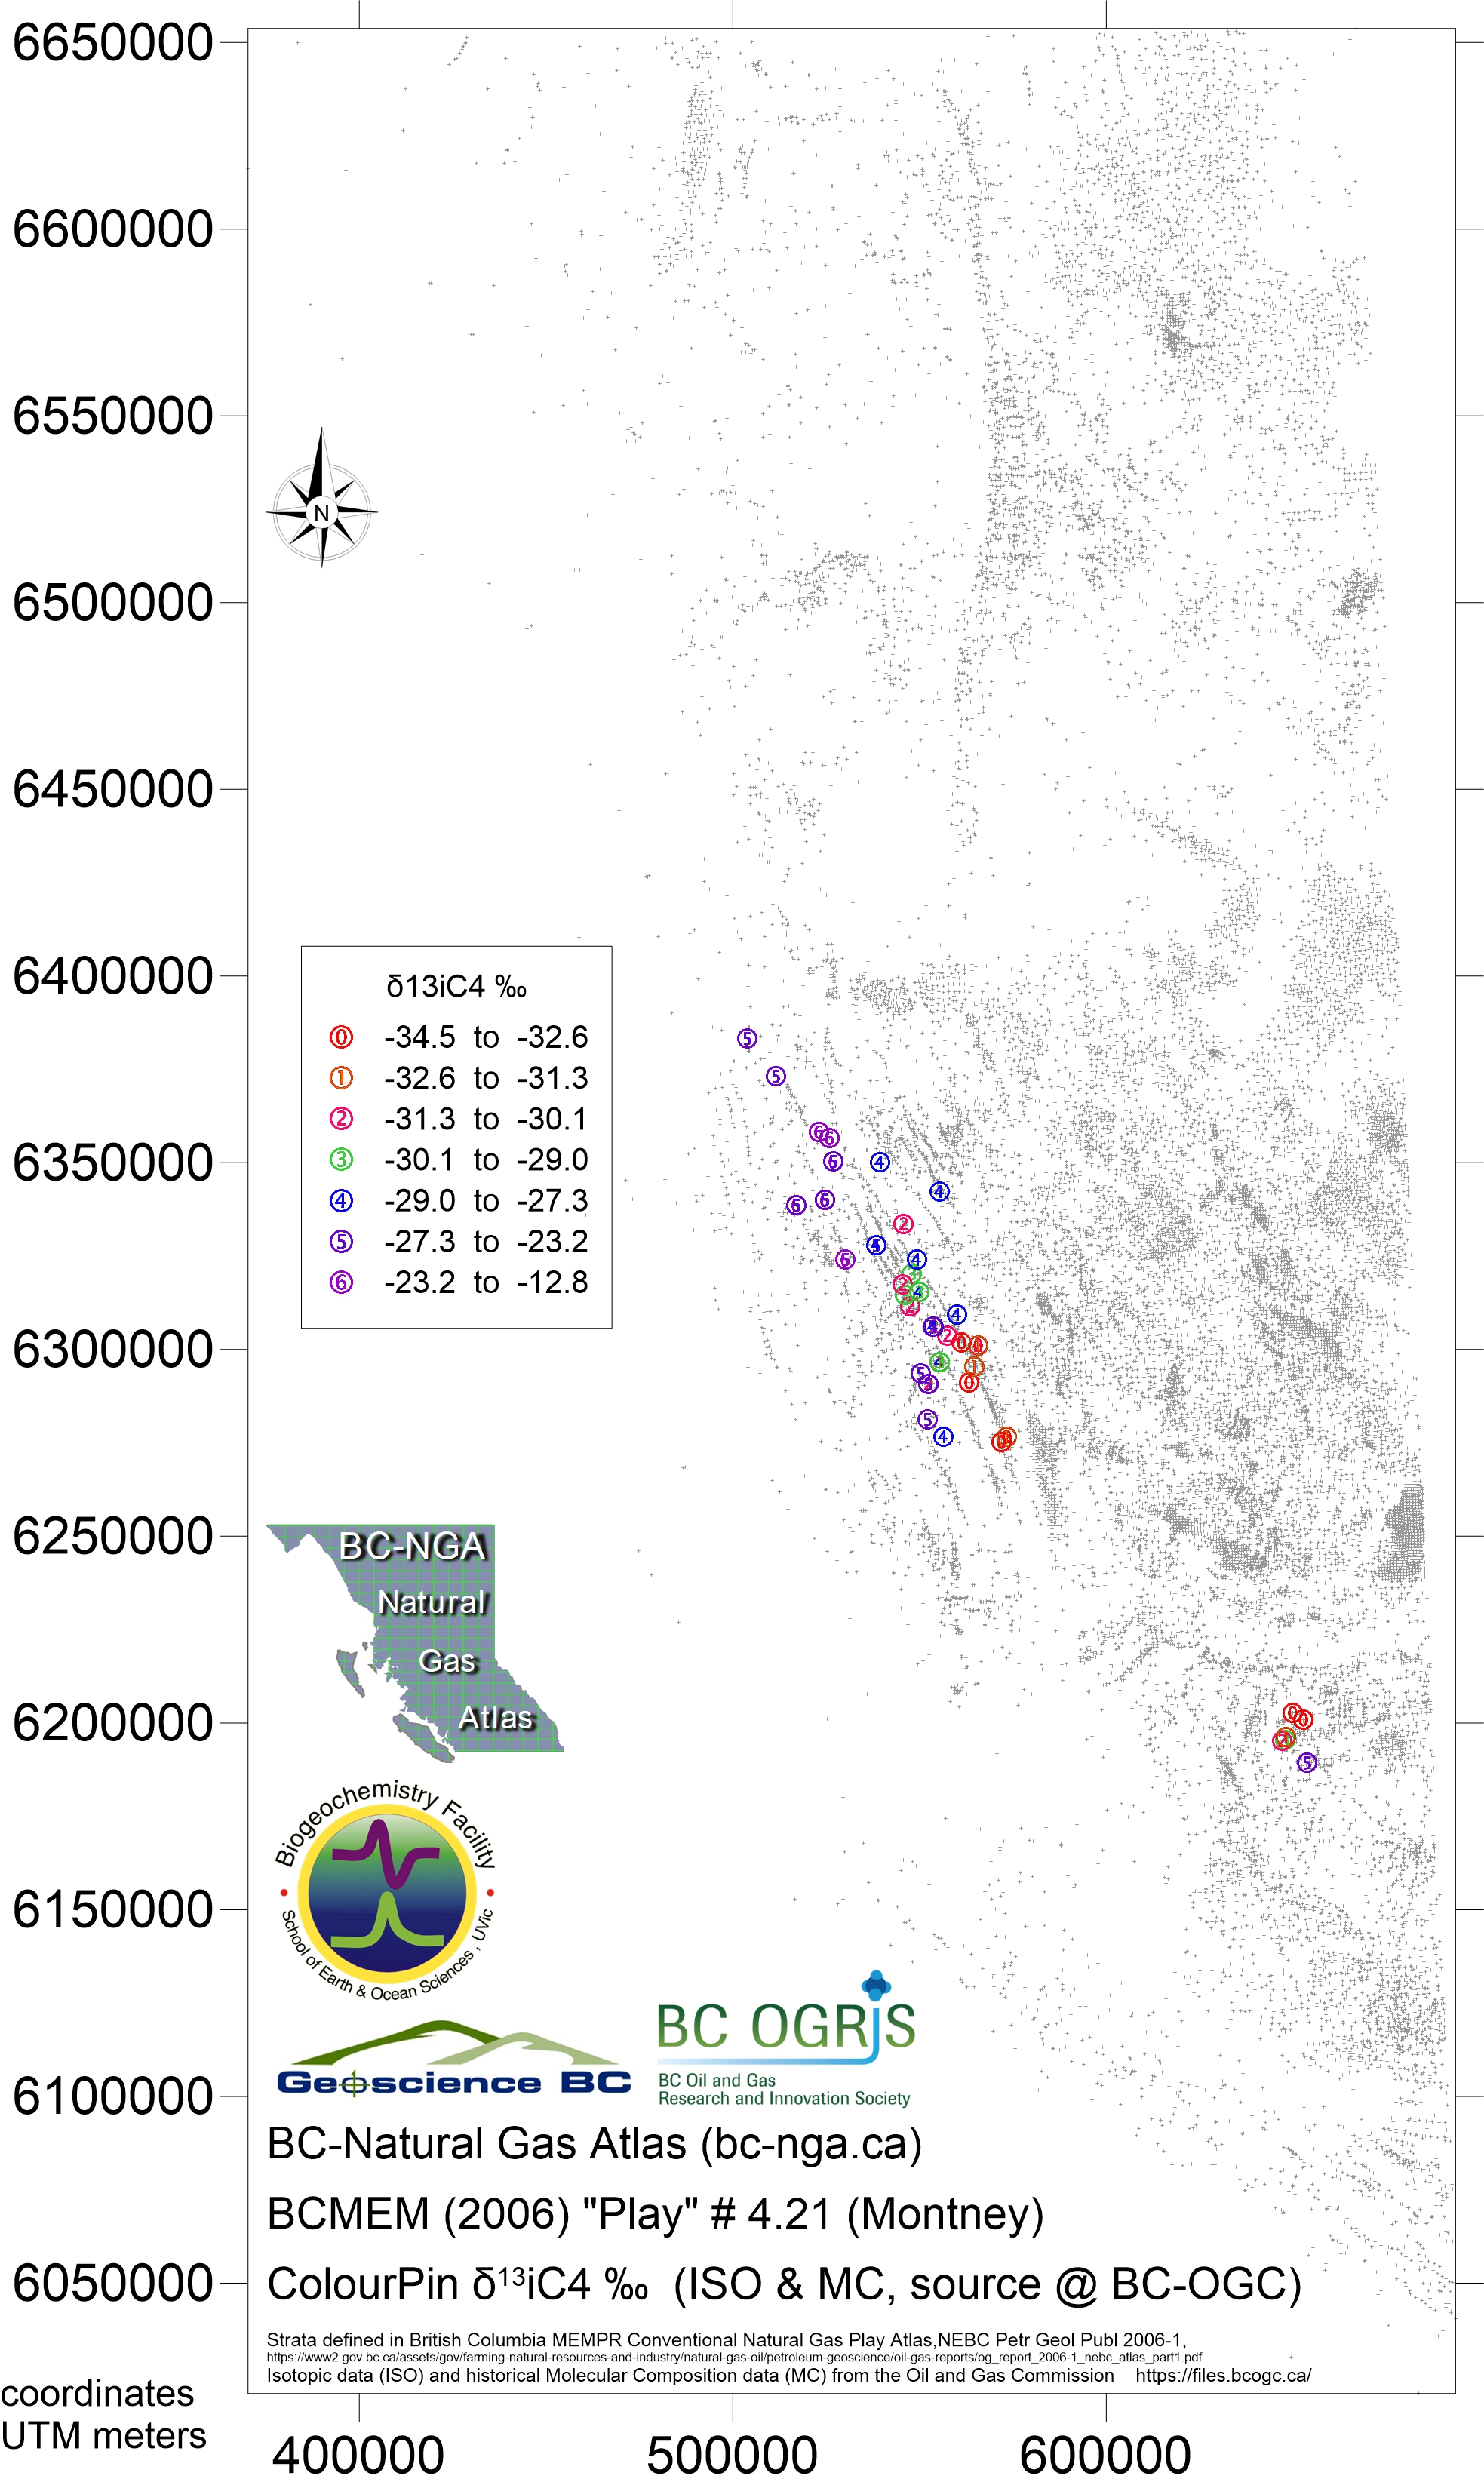
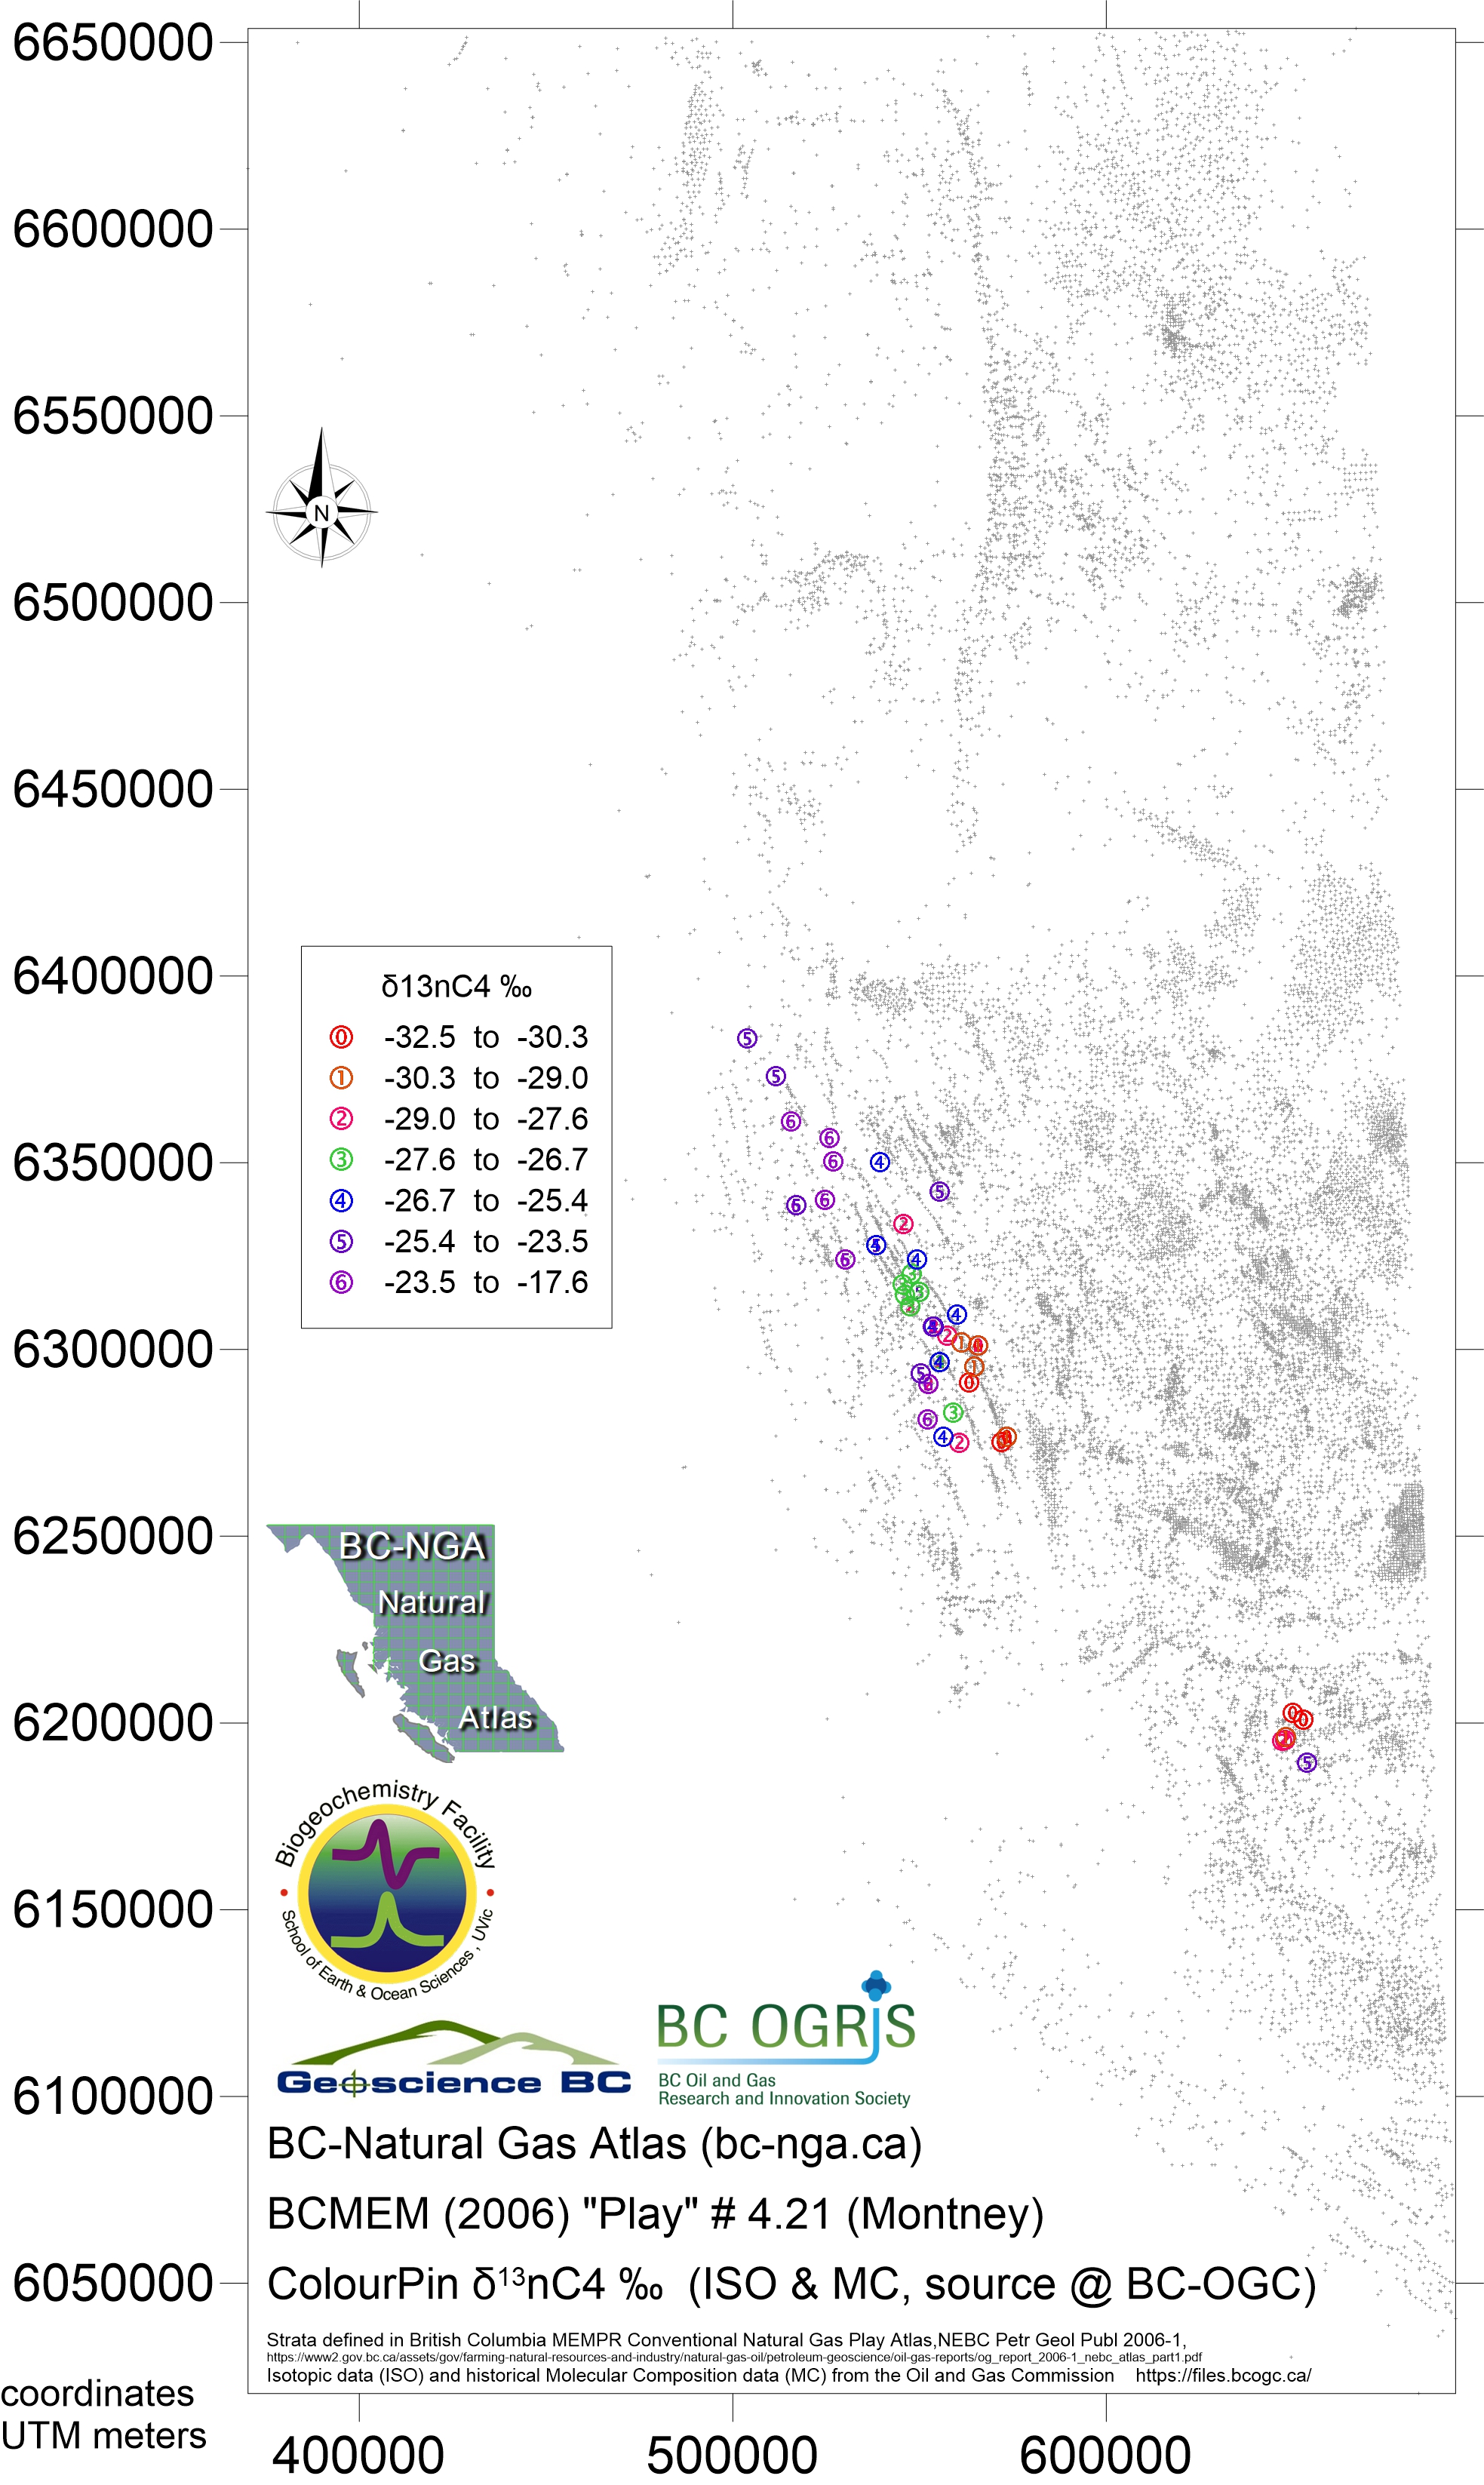
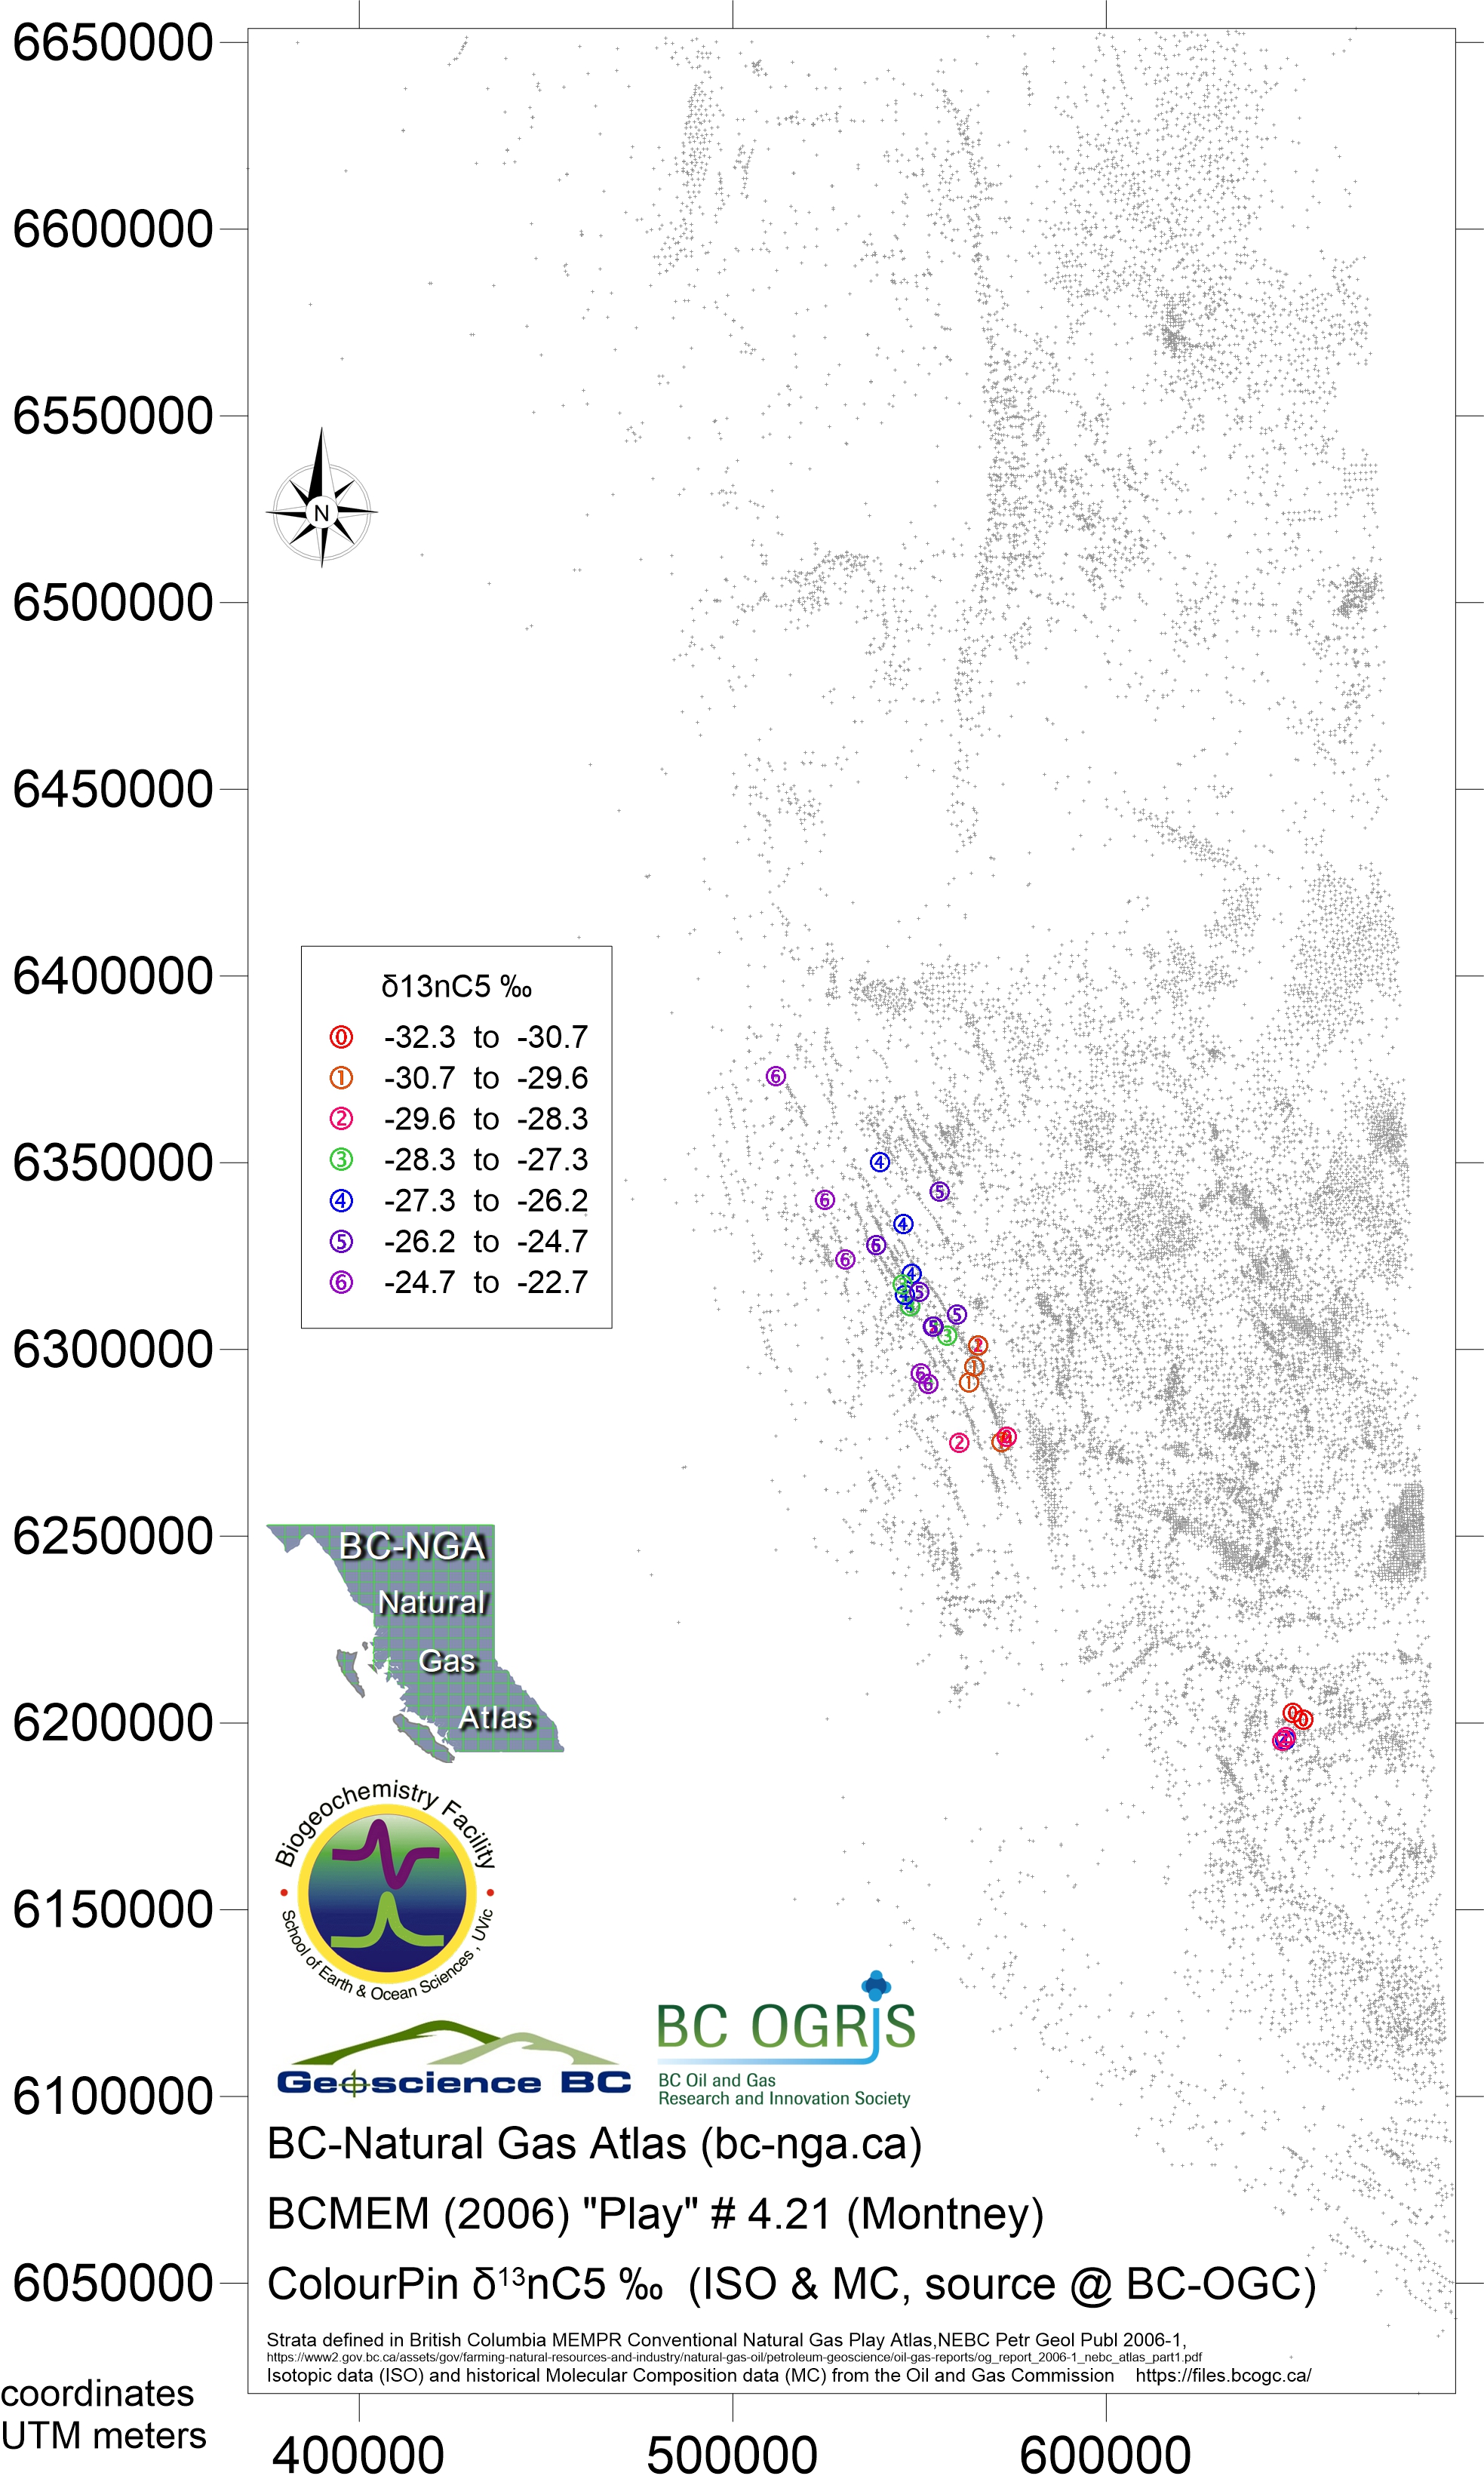
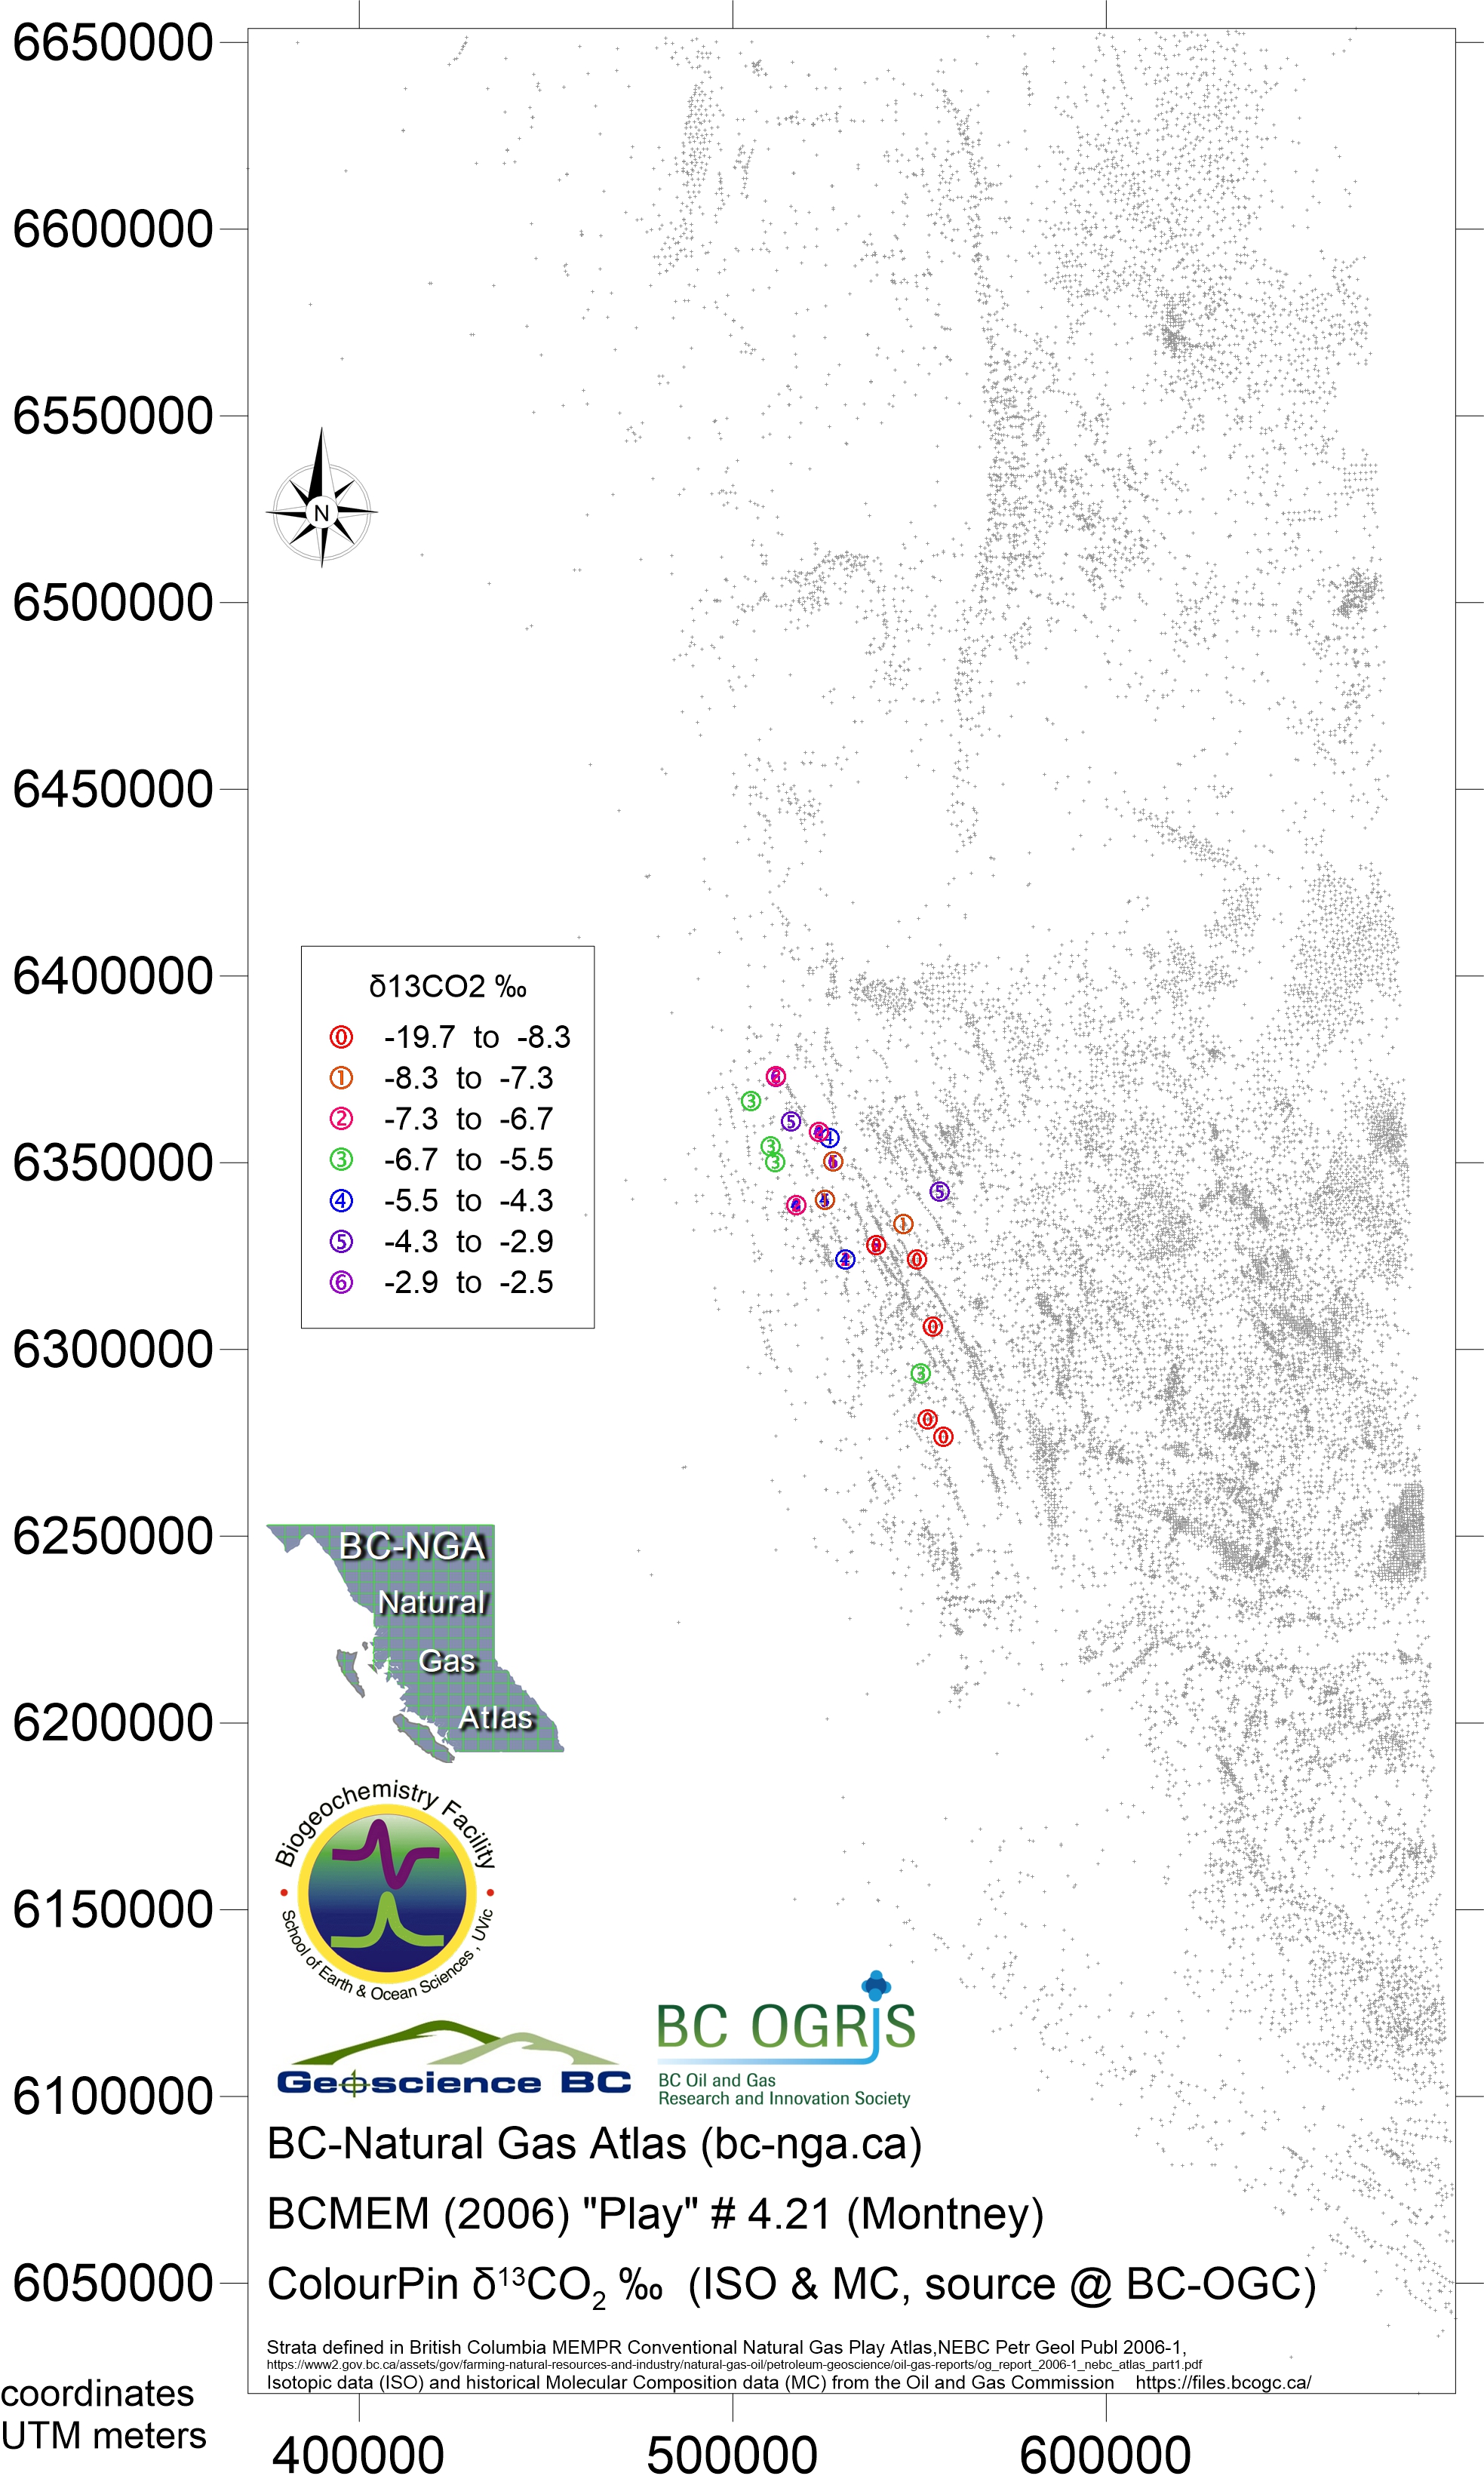
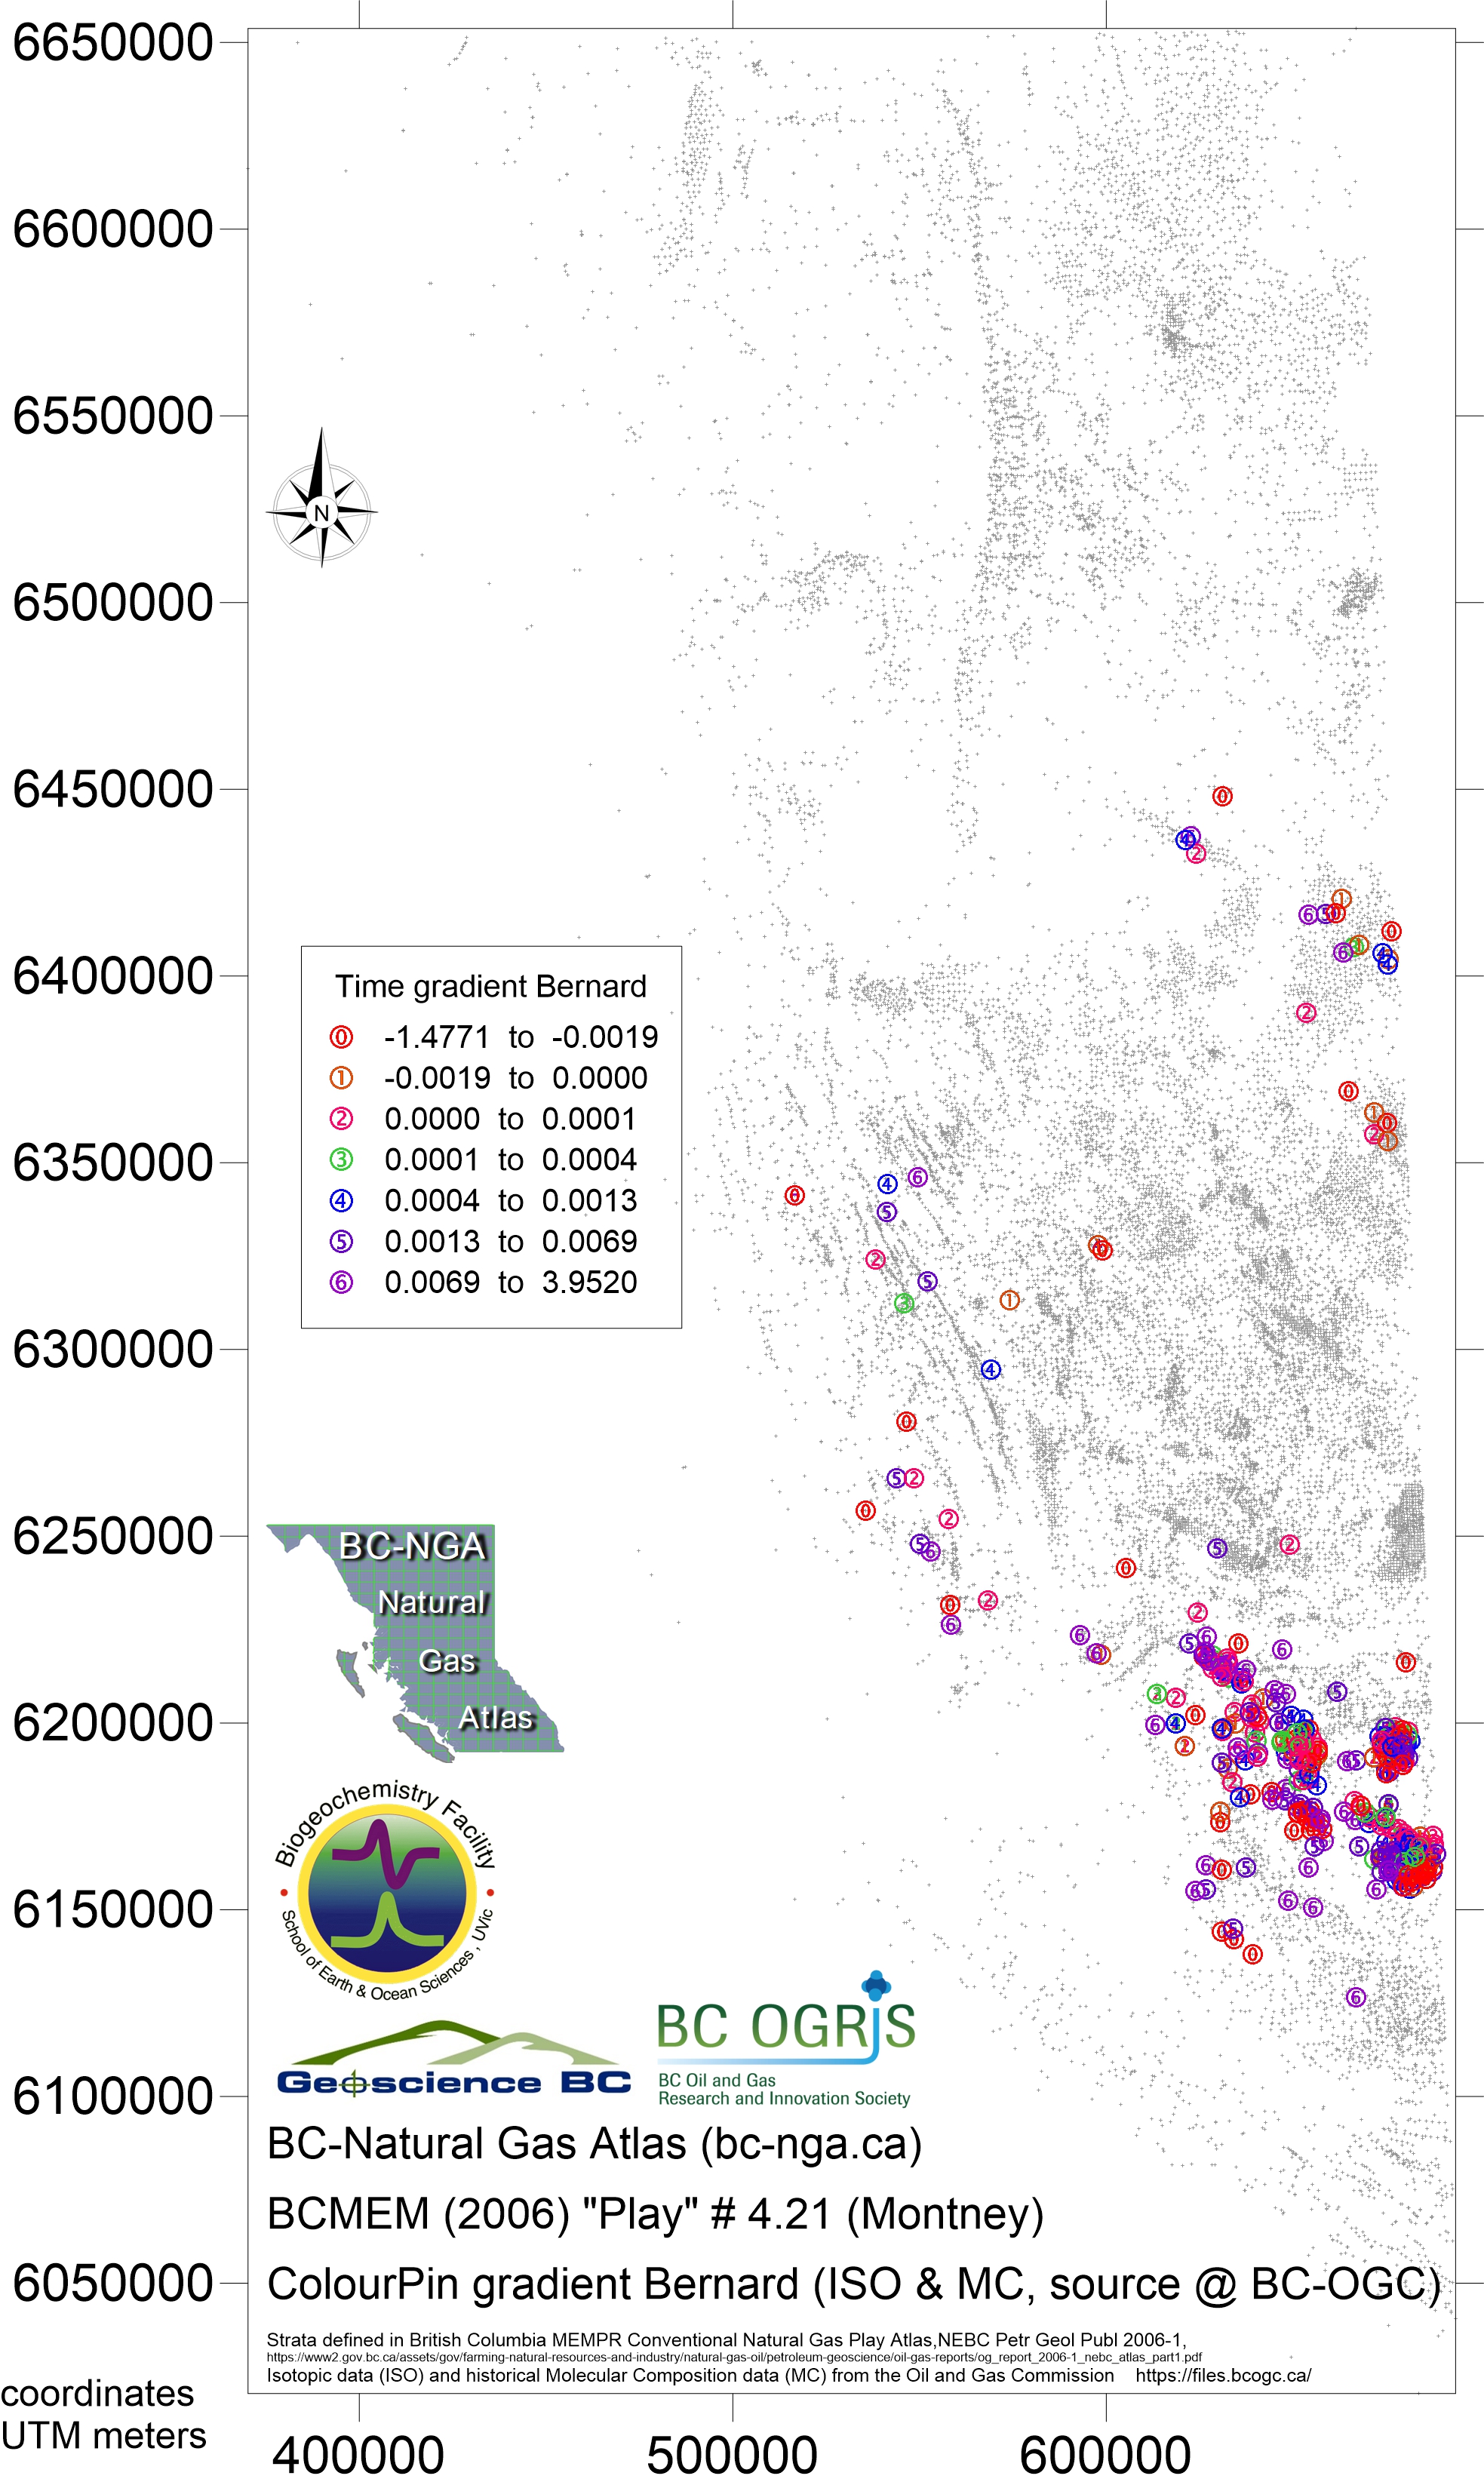
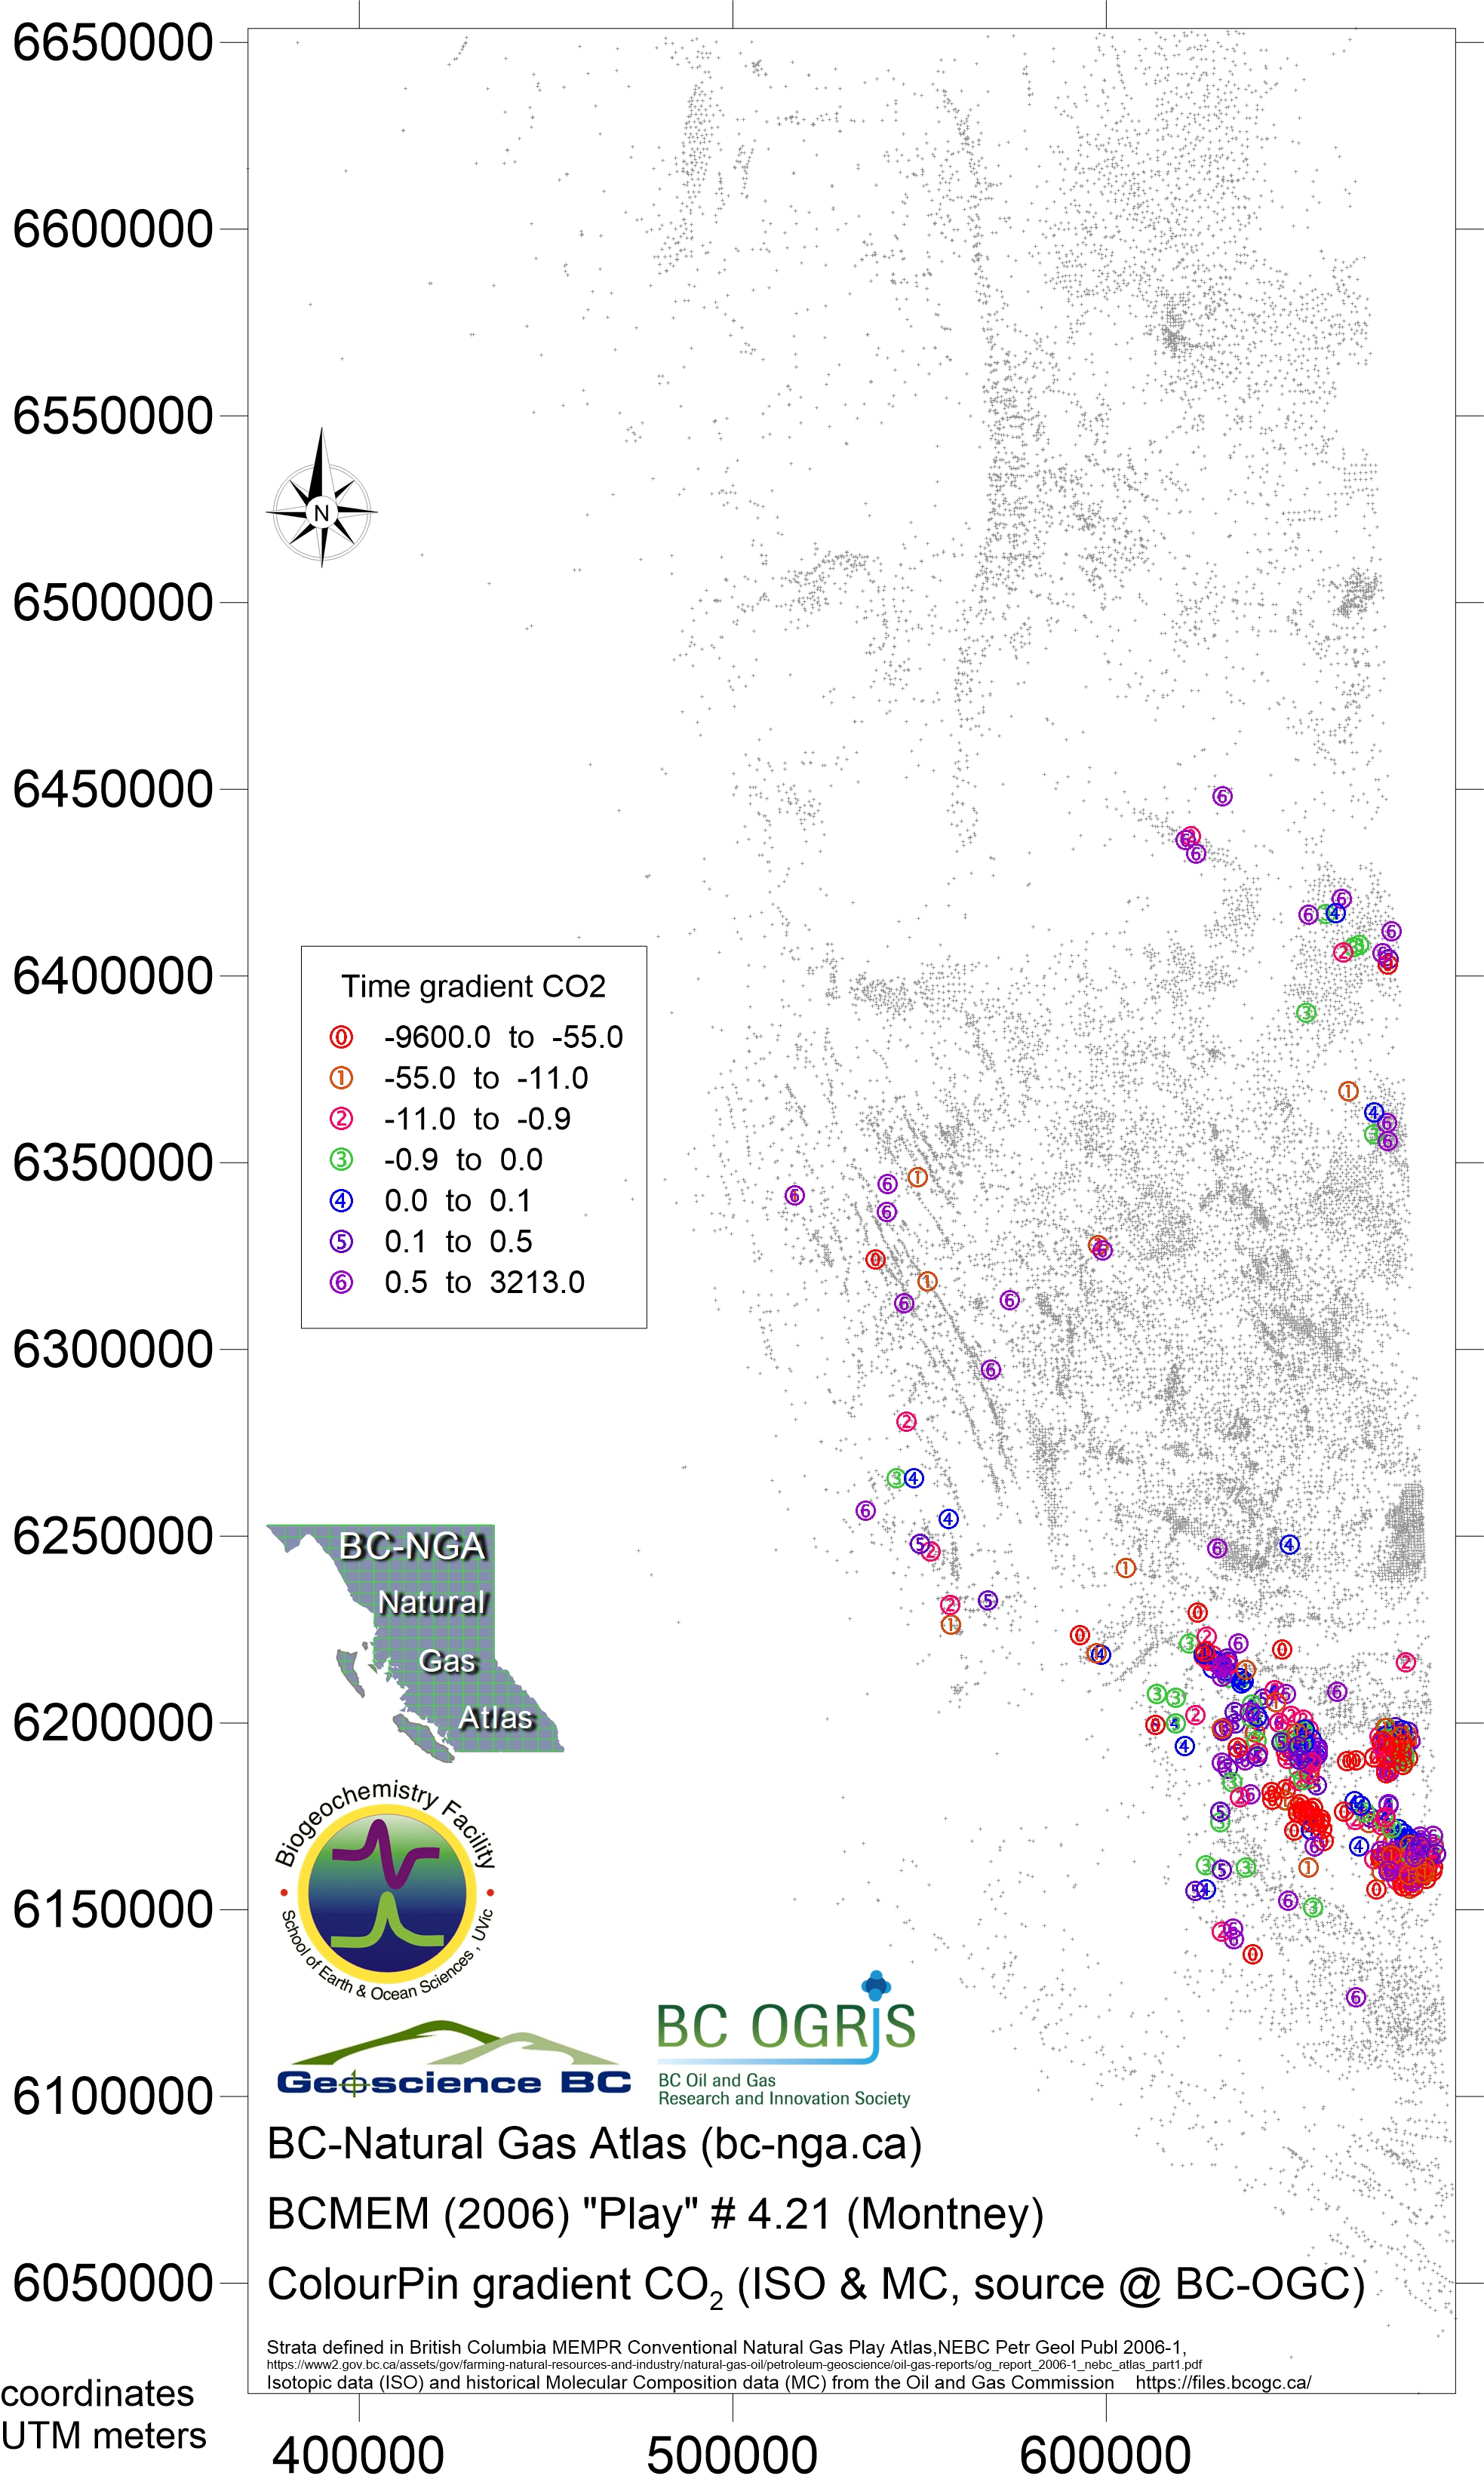
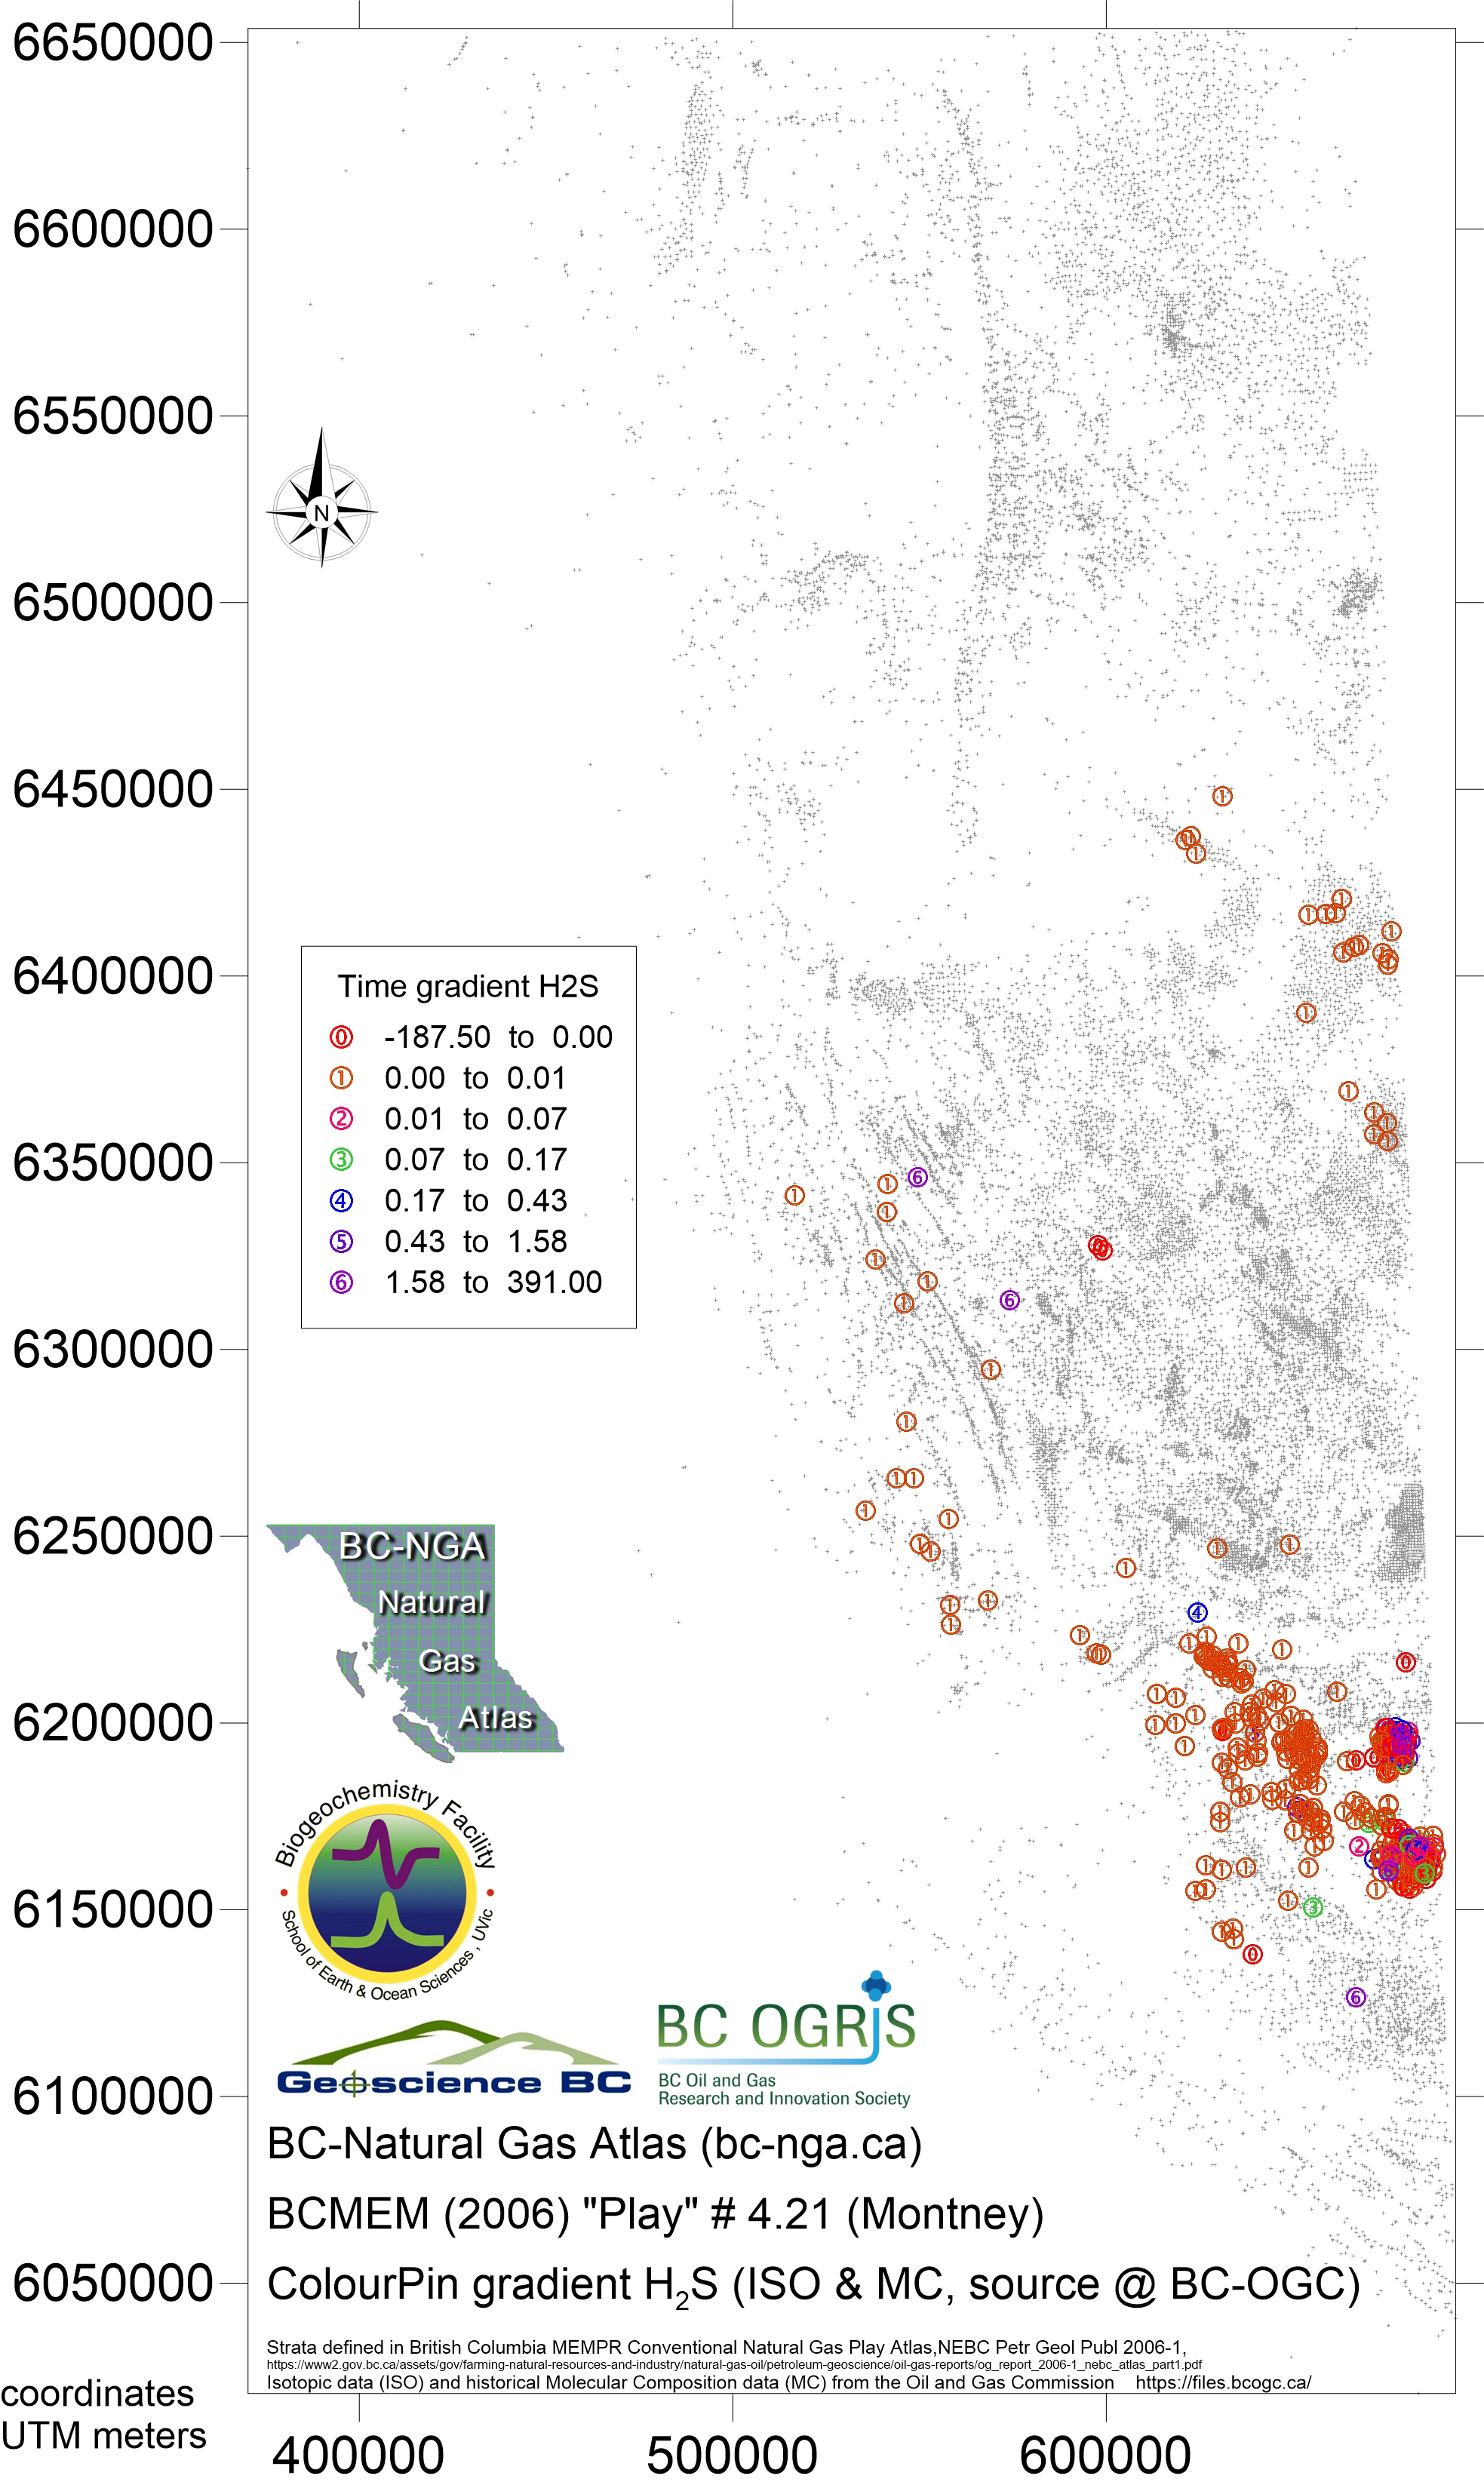
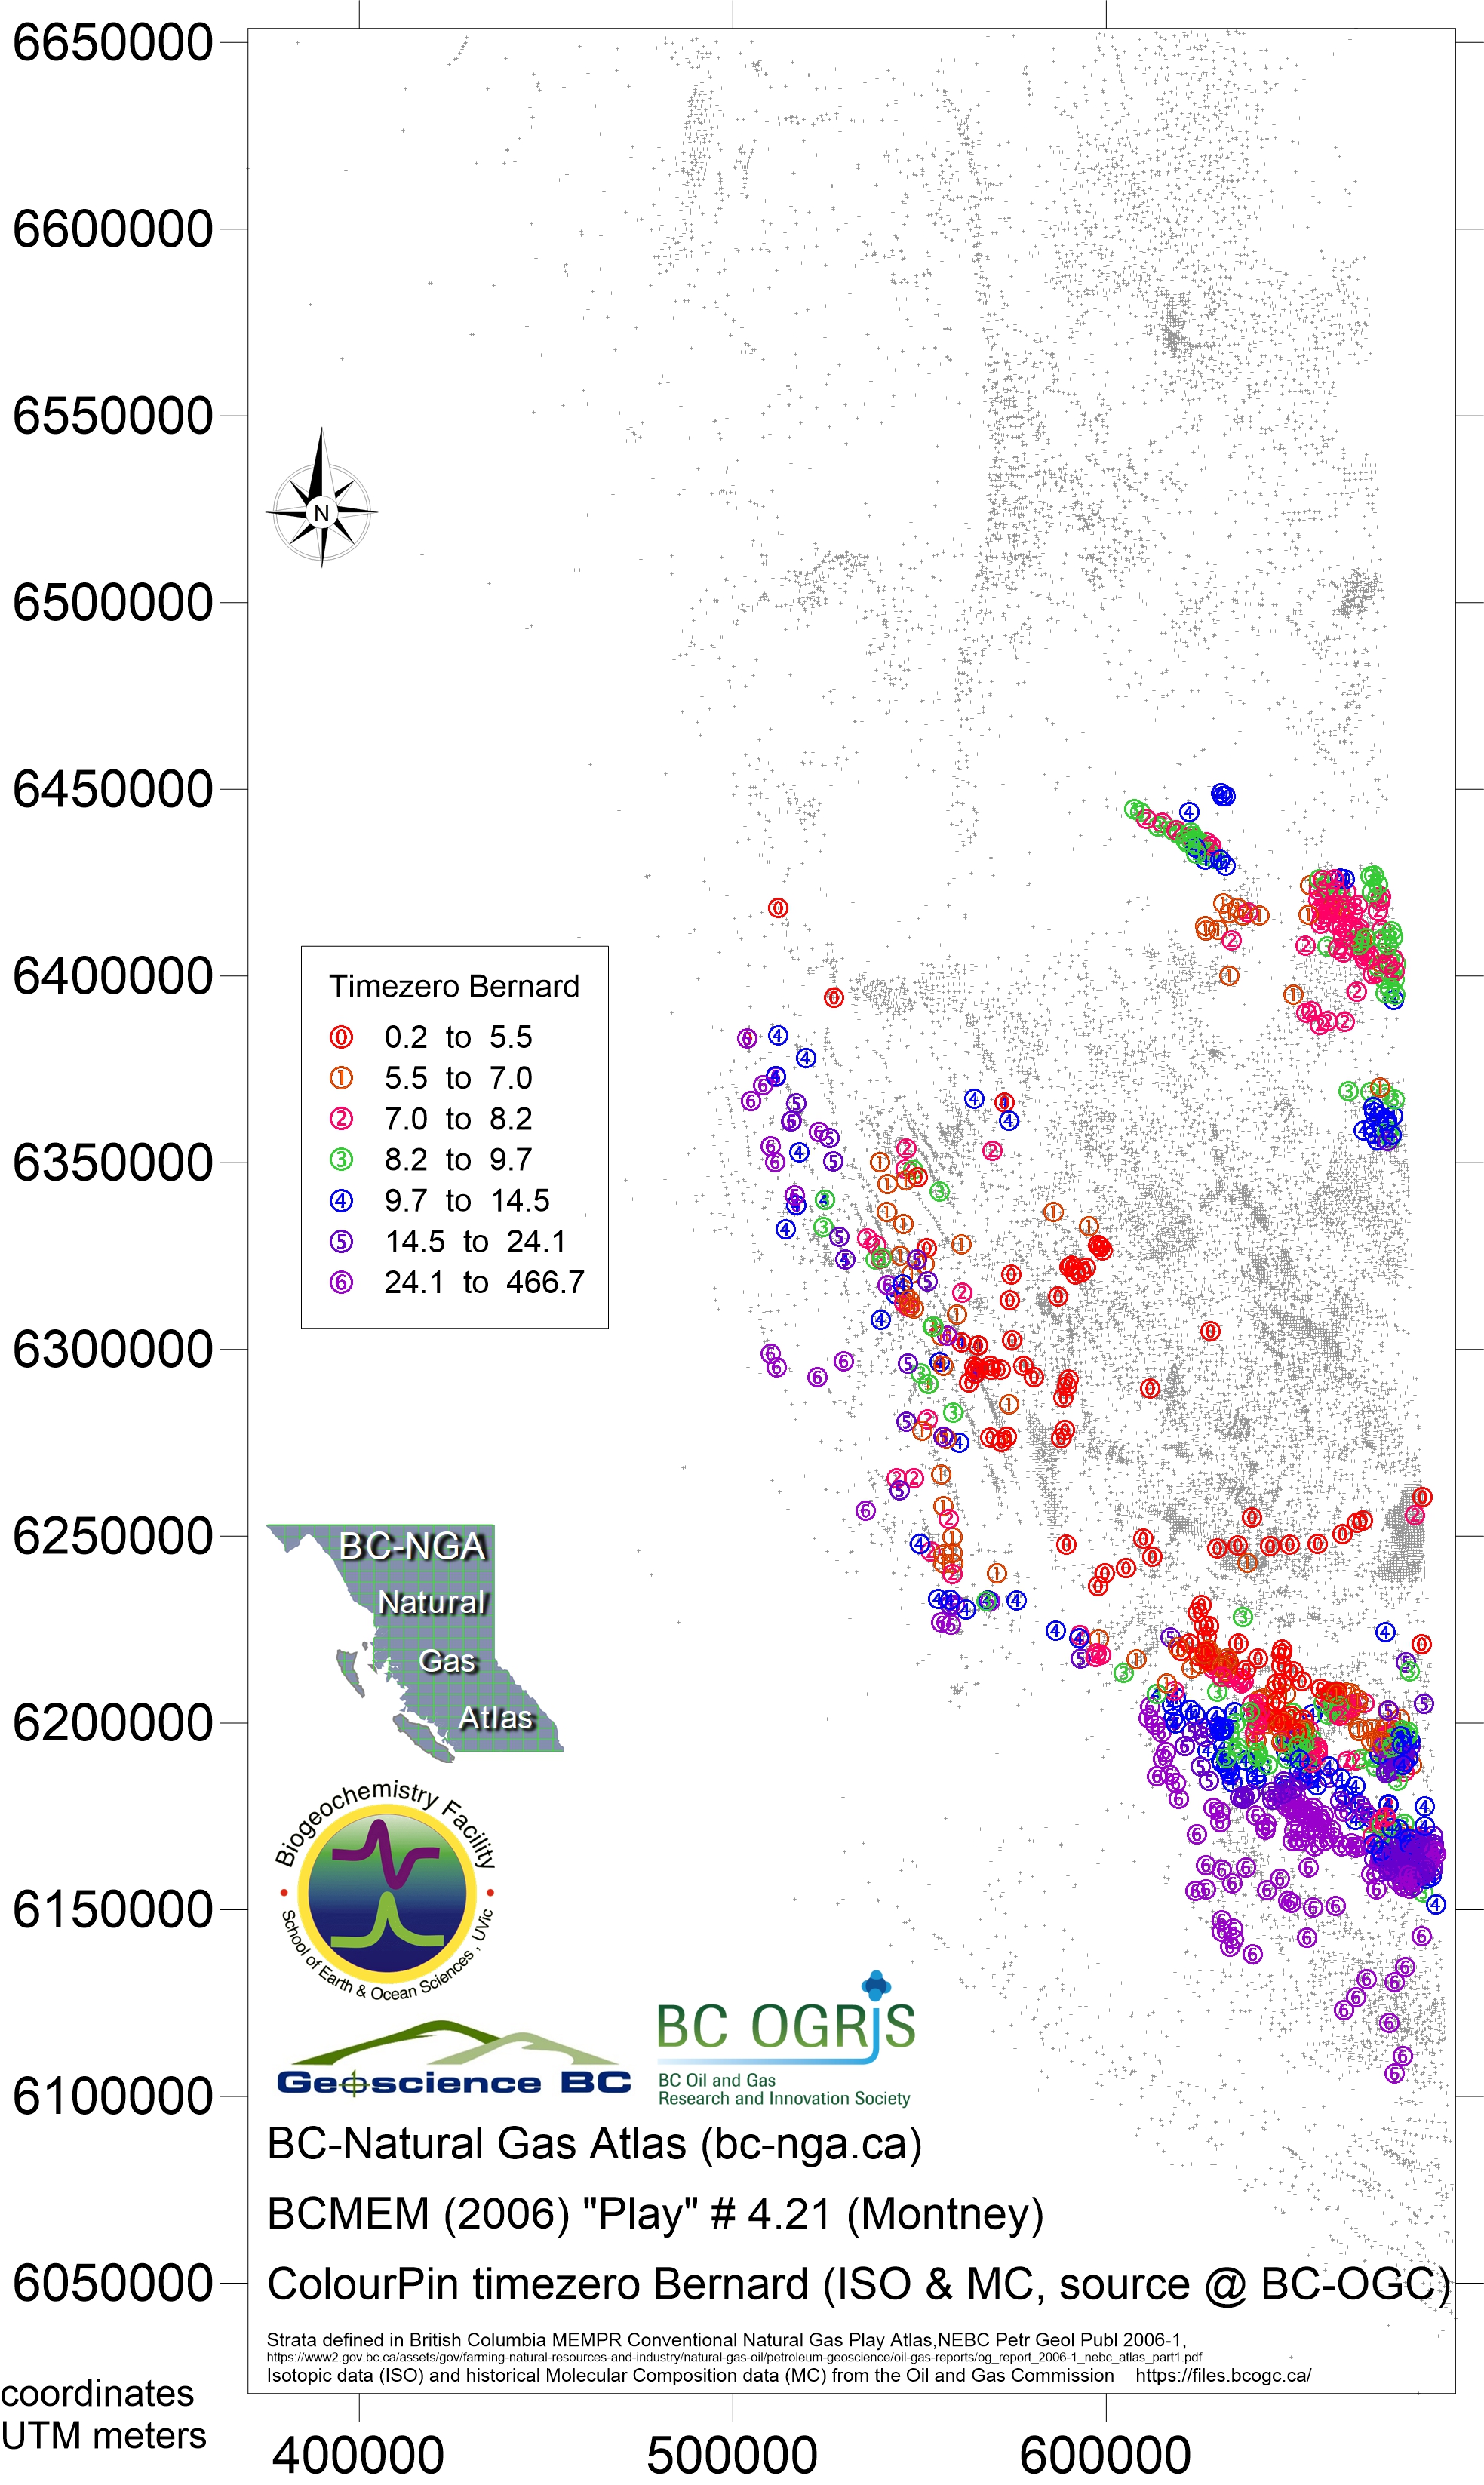
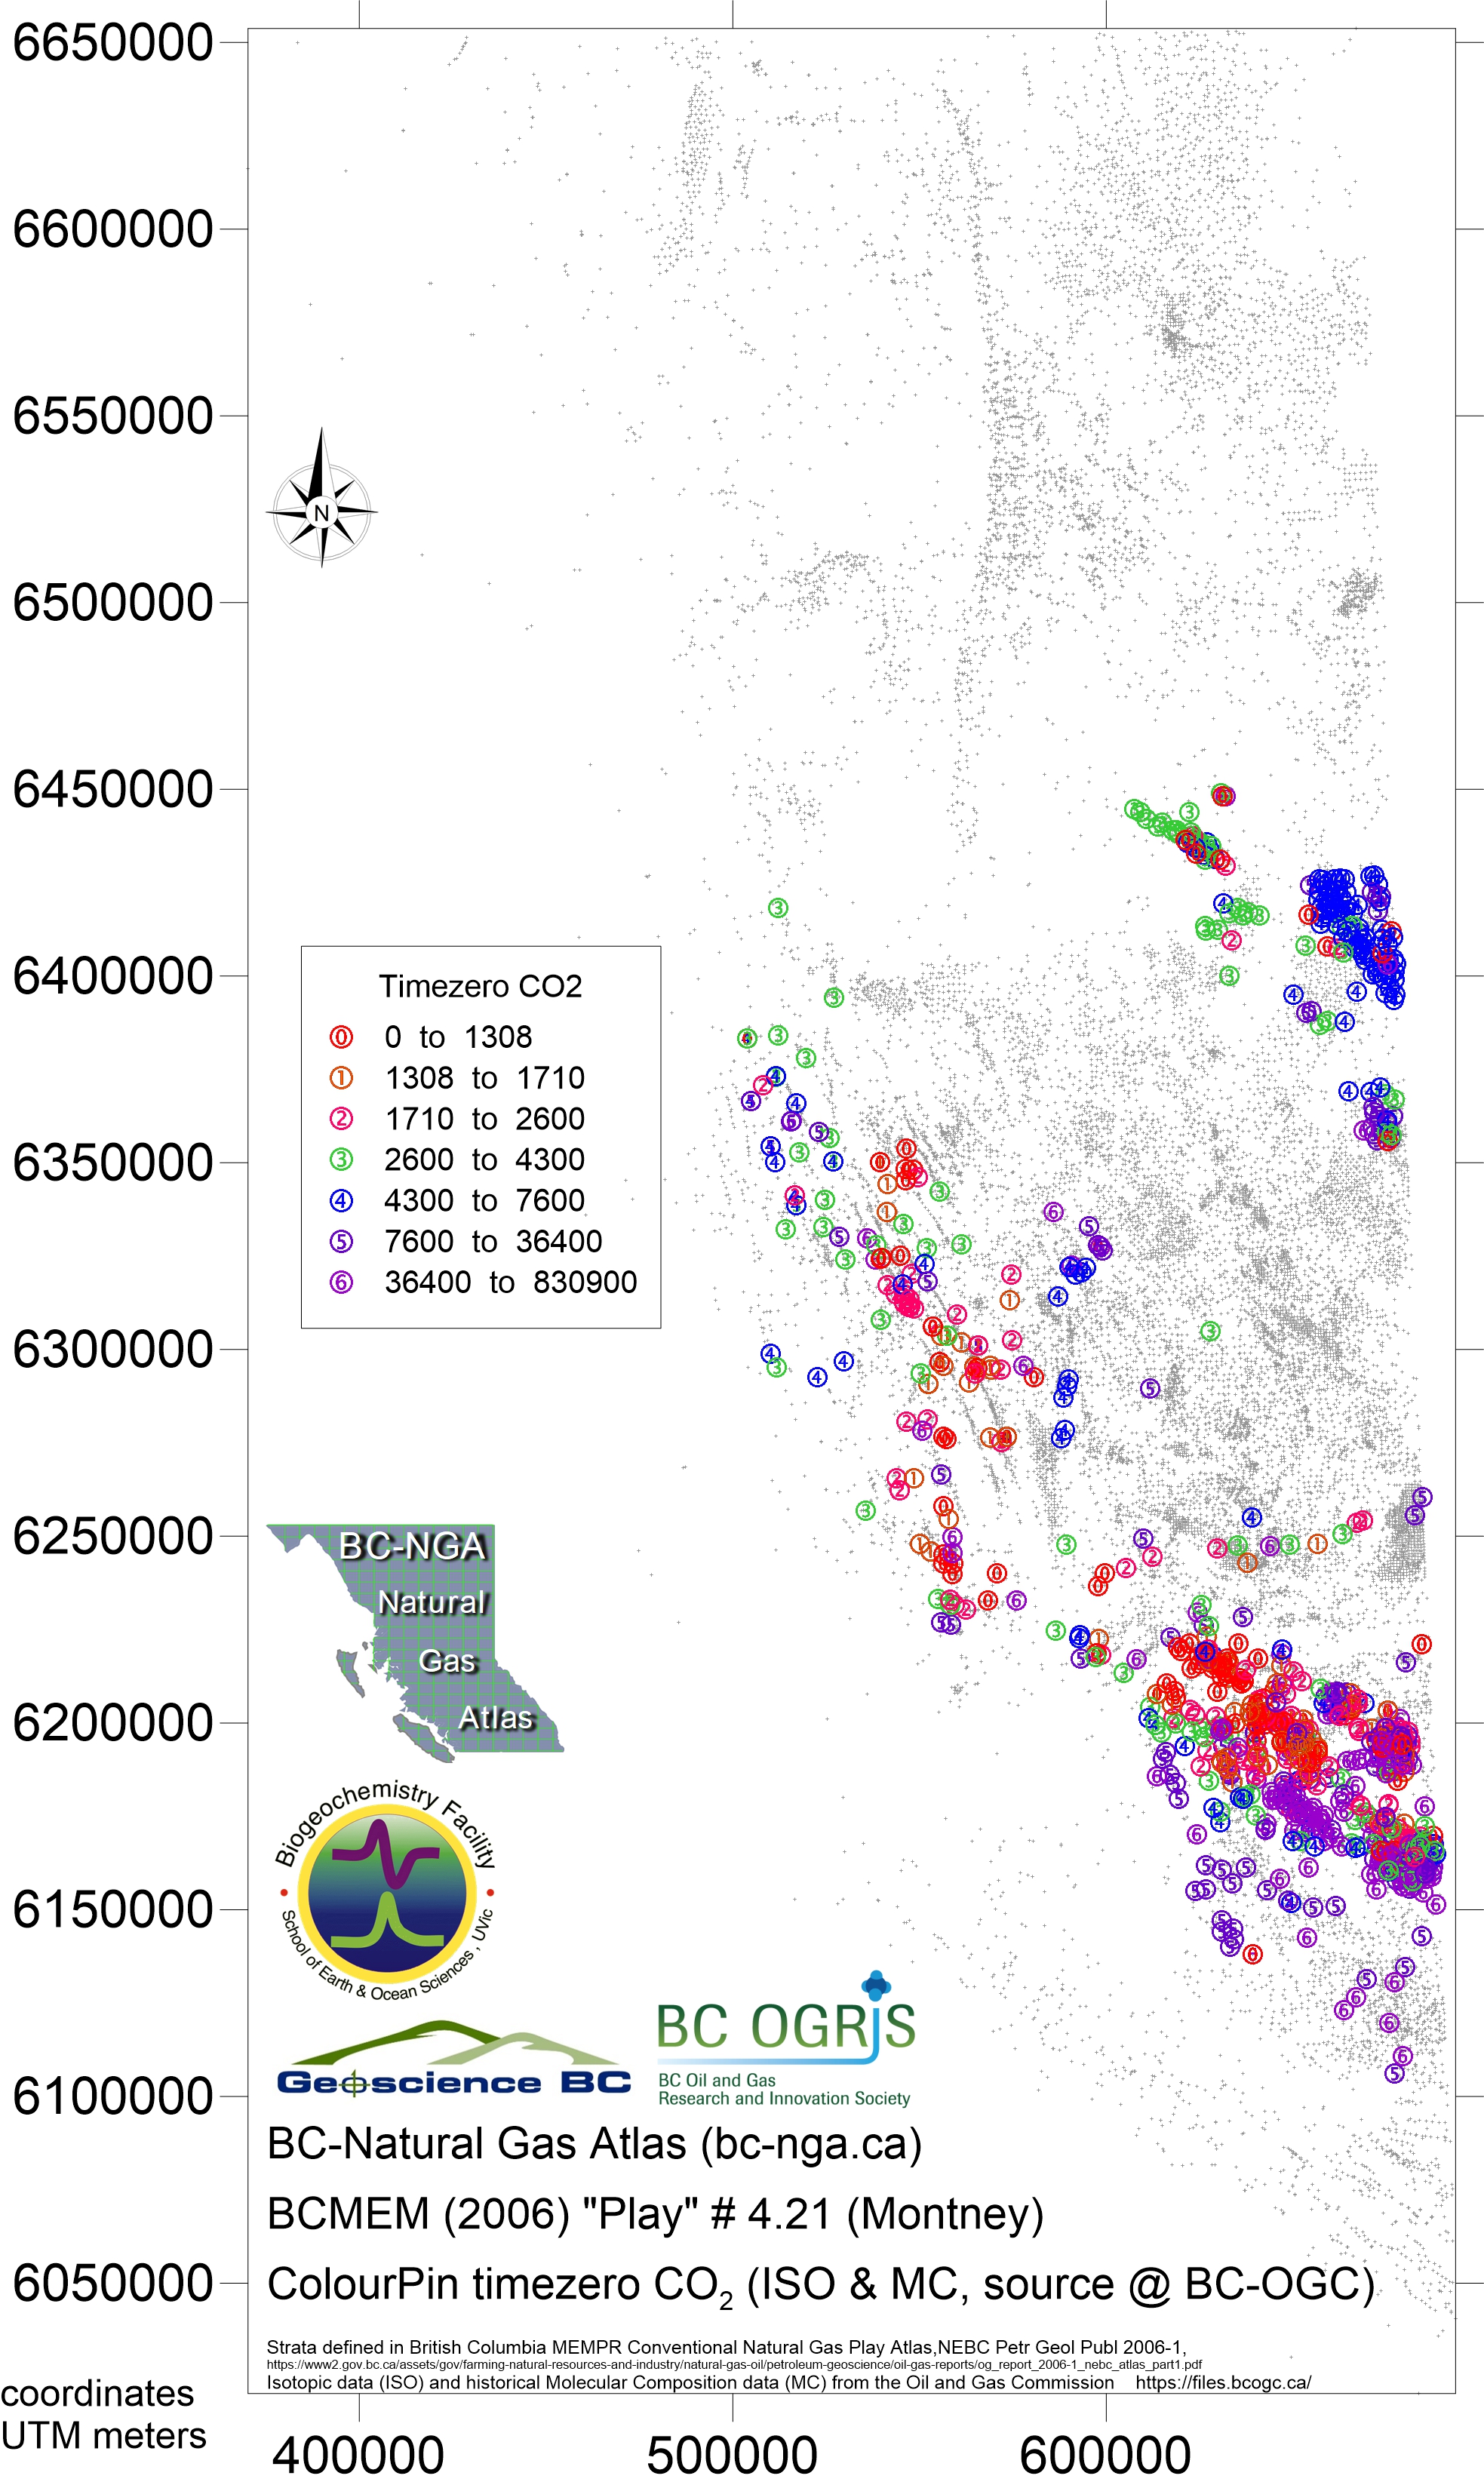
Play 4.21 Montney Formation and equivalents
- Map202 Nov 2018 play 4.21 Montney eqv Bernard ratio
- Map203 Nov 2018 play 4.21 Montney eqv dryness ratio
- Map204 Nov 2018 play 4.21 Montney eqv iC4nC4 ratio
- Map205 Nov 2018 play 4.21 Montney eqv ISO ratio
- Map206 Nov 2018 play 4.21 Montney eqv H2S ppm
- Map207 Nov 2018 play 4.21 Montney eqv CH4 ppm
- Map208 Nov 2018 play 4.21 Montney eqv C2H6 ppm
- Map209 Nov 2018 play 4.21 Montney eqv C3H8 ppm
- Map210 Nov 2018 play 4.21 Montney eqv iC4H10 ppm
- Map211 Nov 2018 play 4.21 Montney eqv nC4H10 ppm
- Map212 Nov 2018 play 4.21 Montney eqv iC5H12 ppm
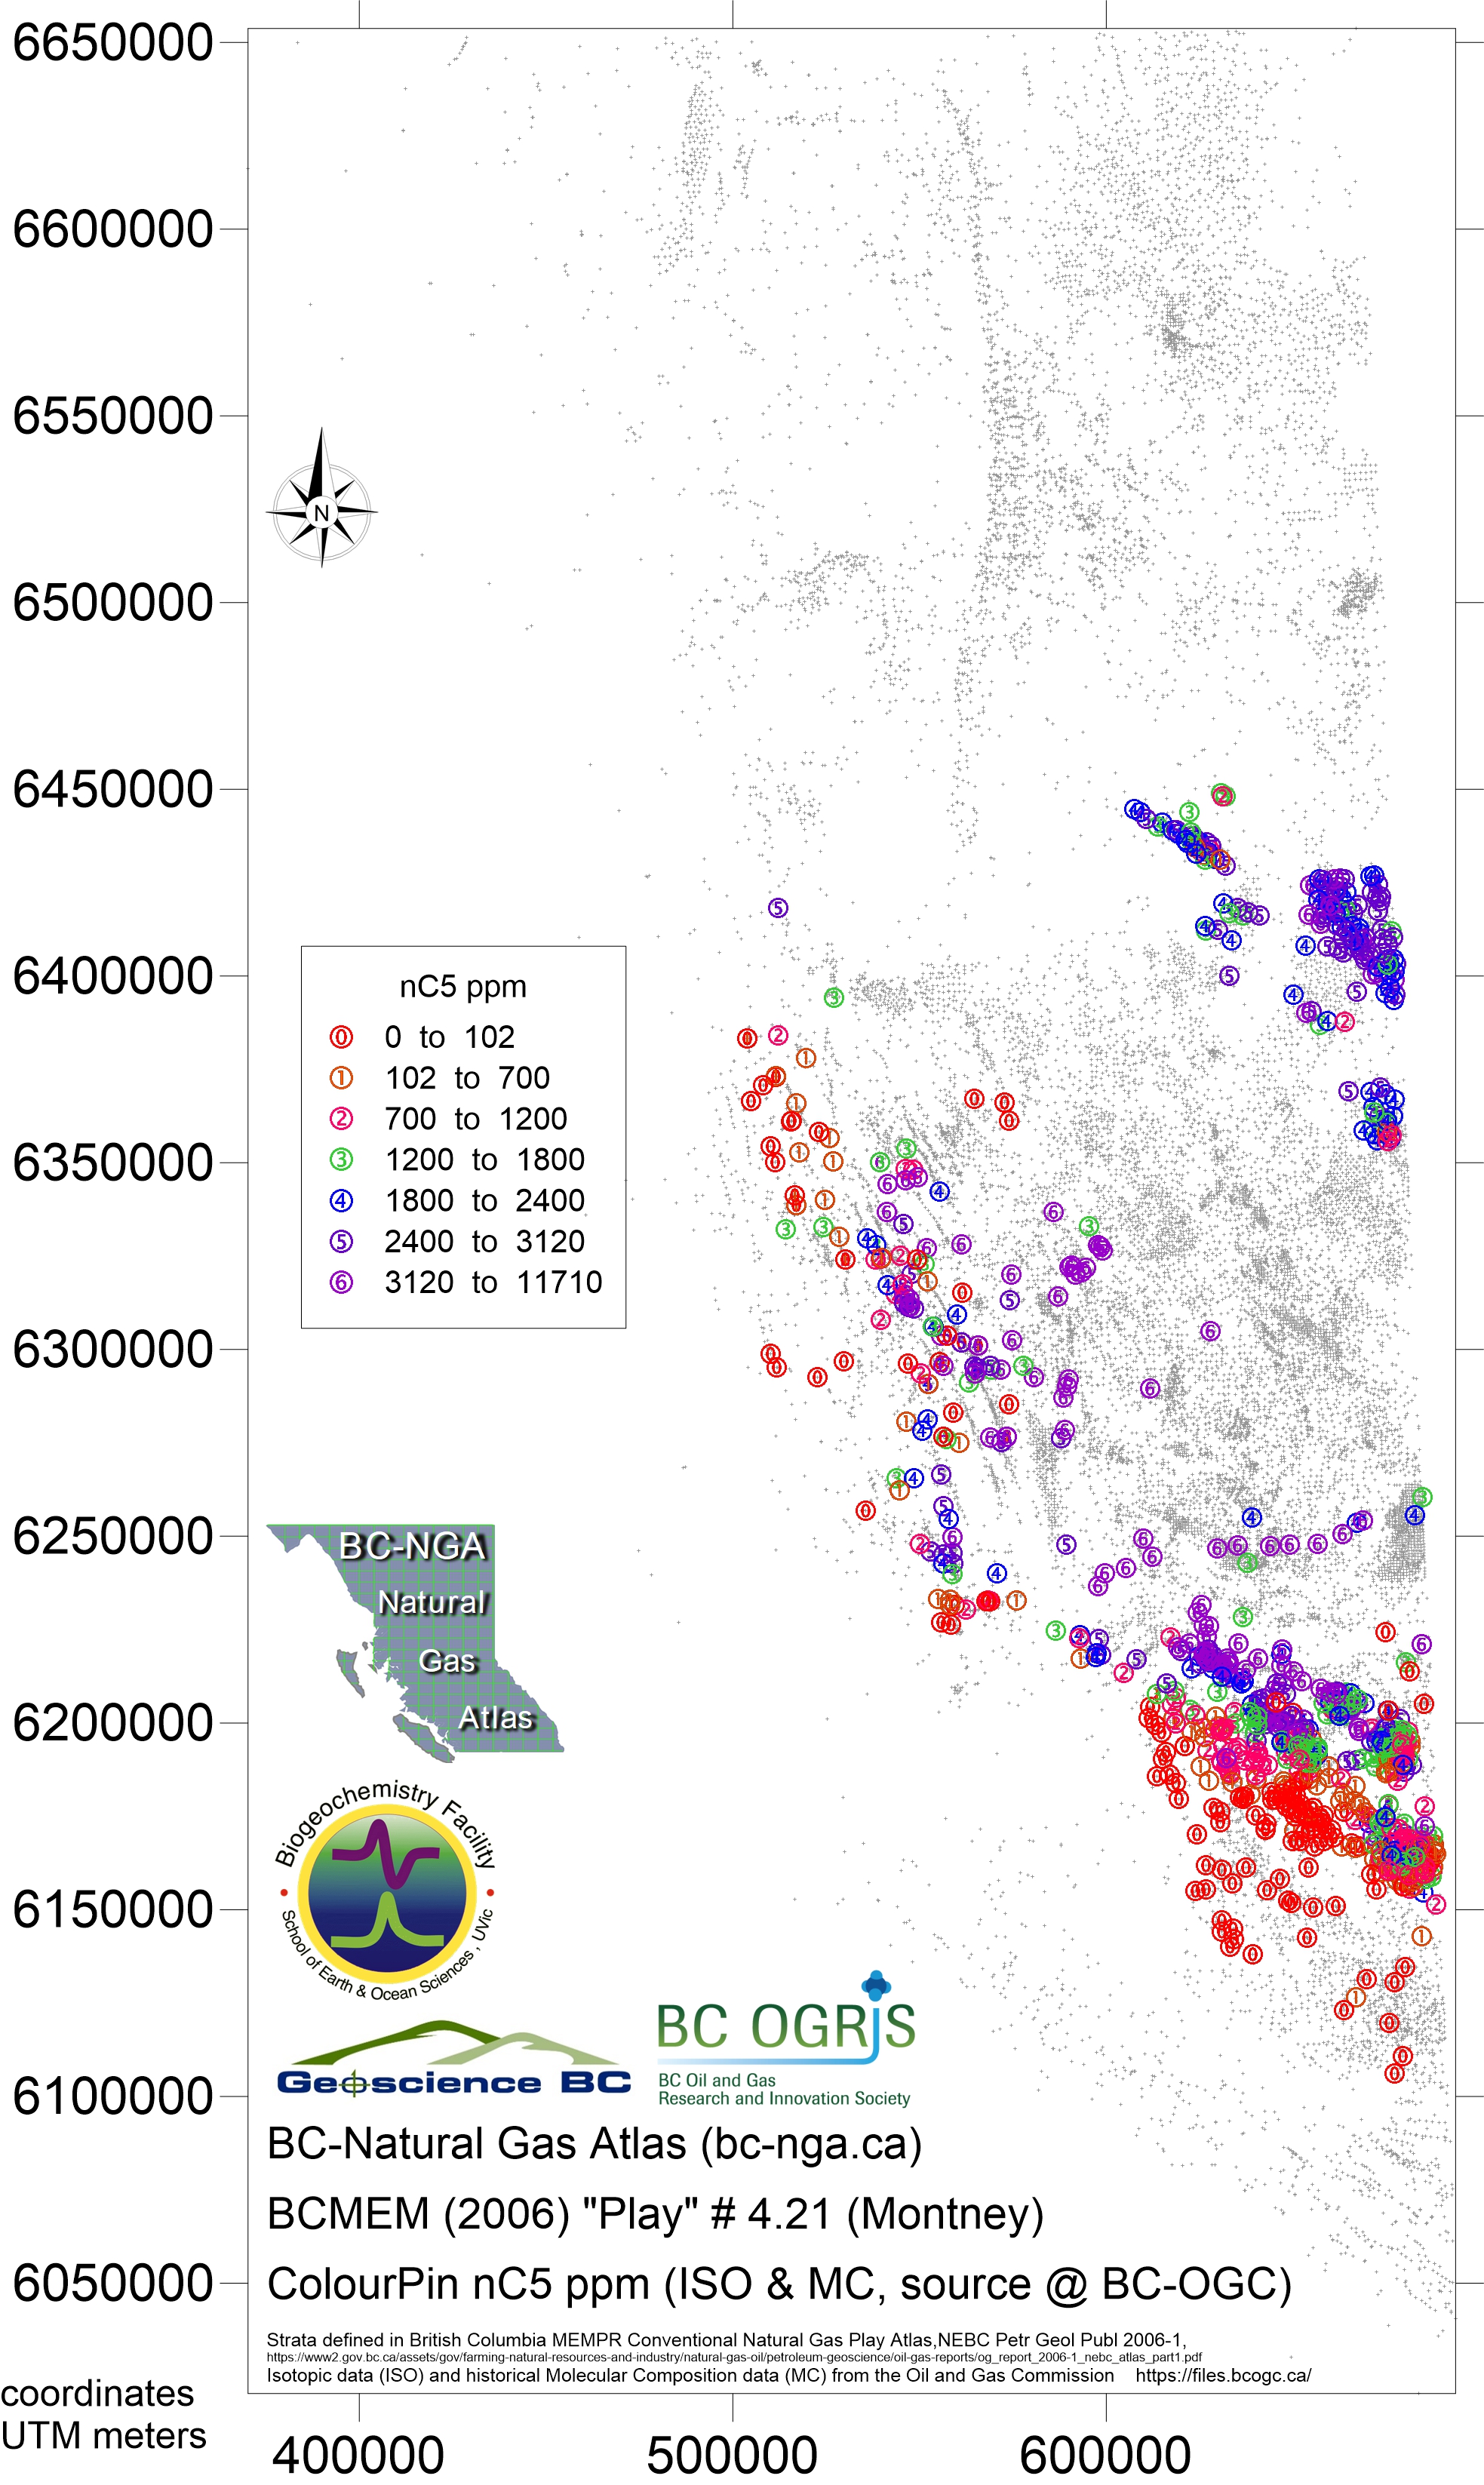
- Map213 Nov 2018 play 4.21 Montney eqv nC5H12 ppm
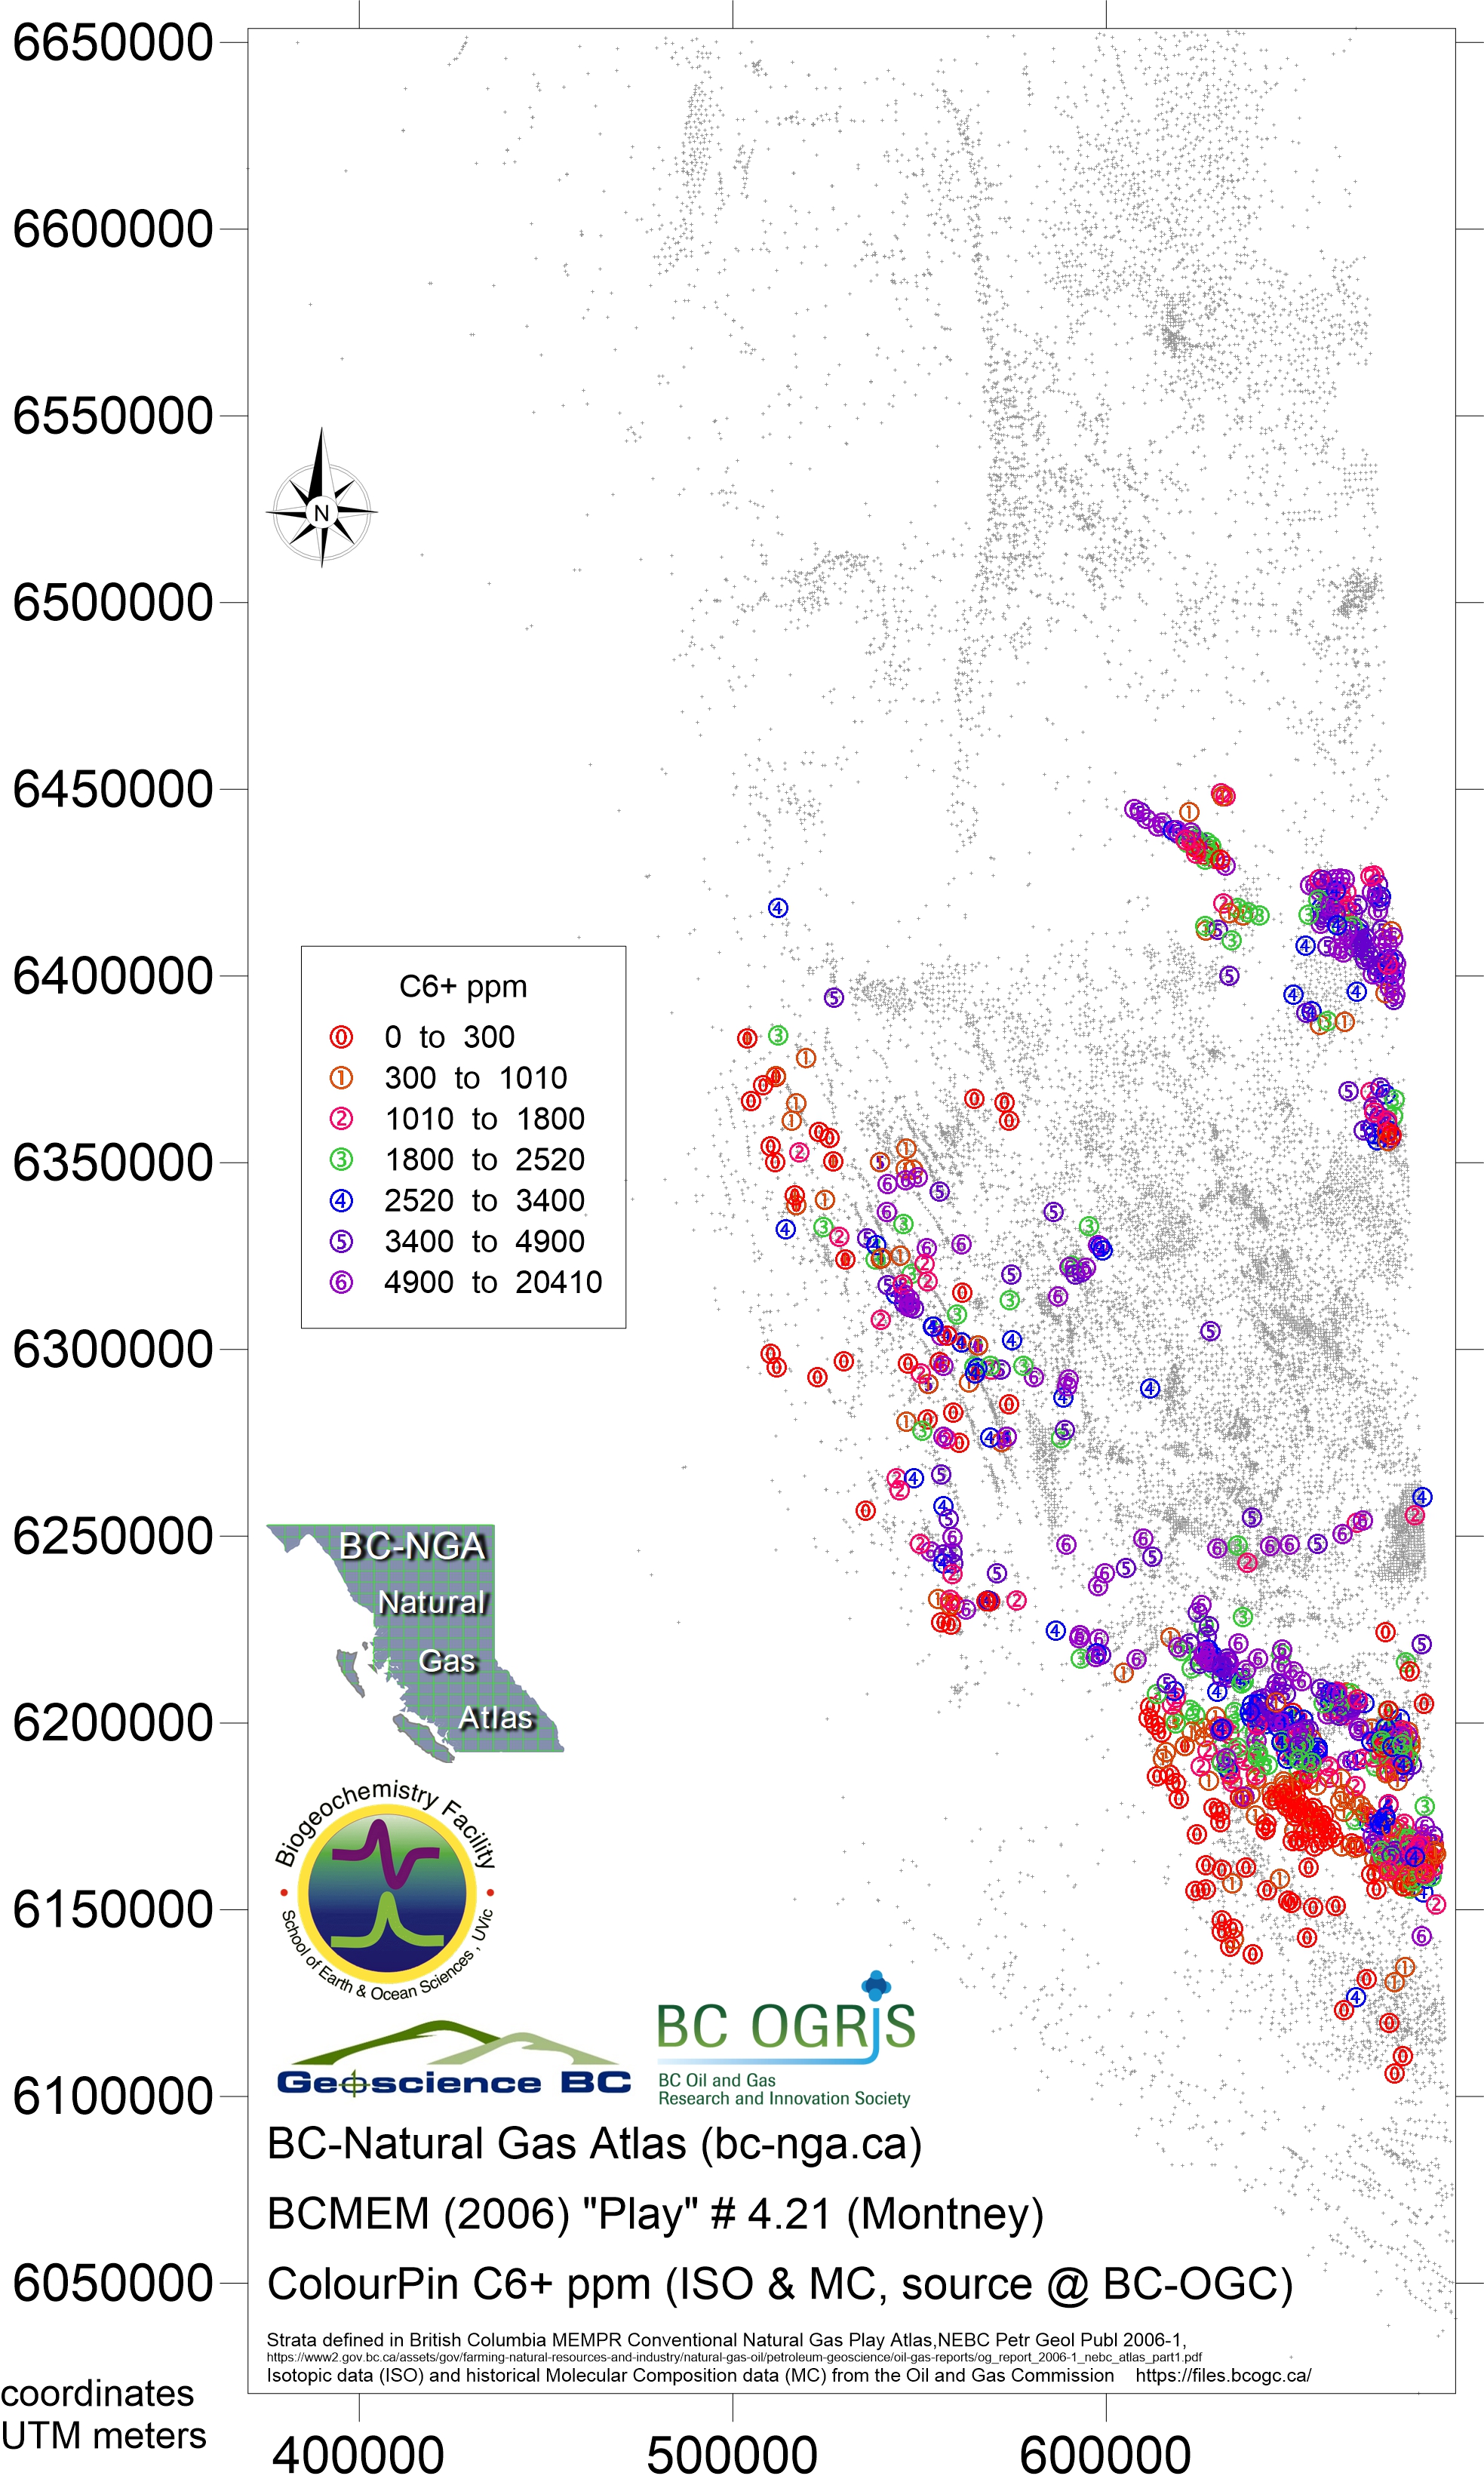
- Map214 Nov 2018 play 4.21 Montney eqv C6H14 plus ppm
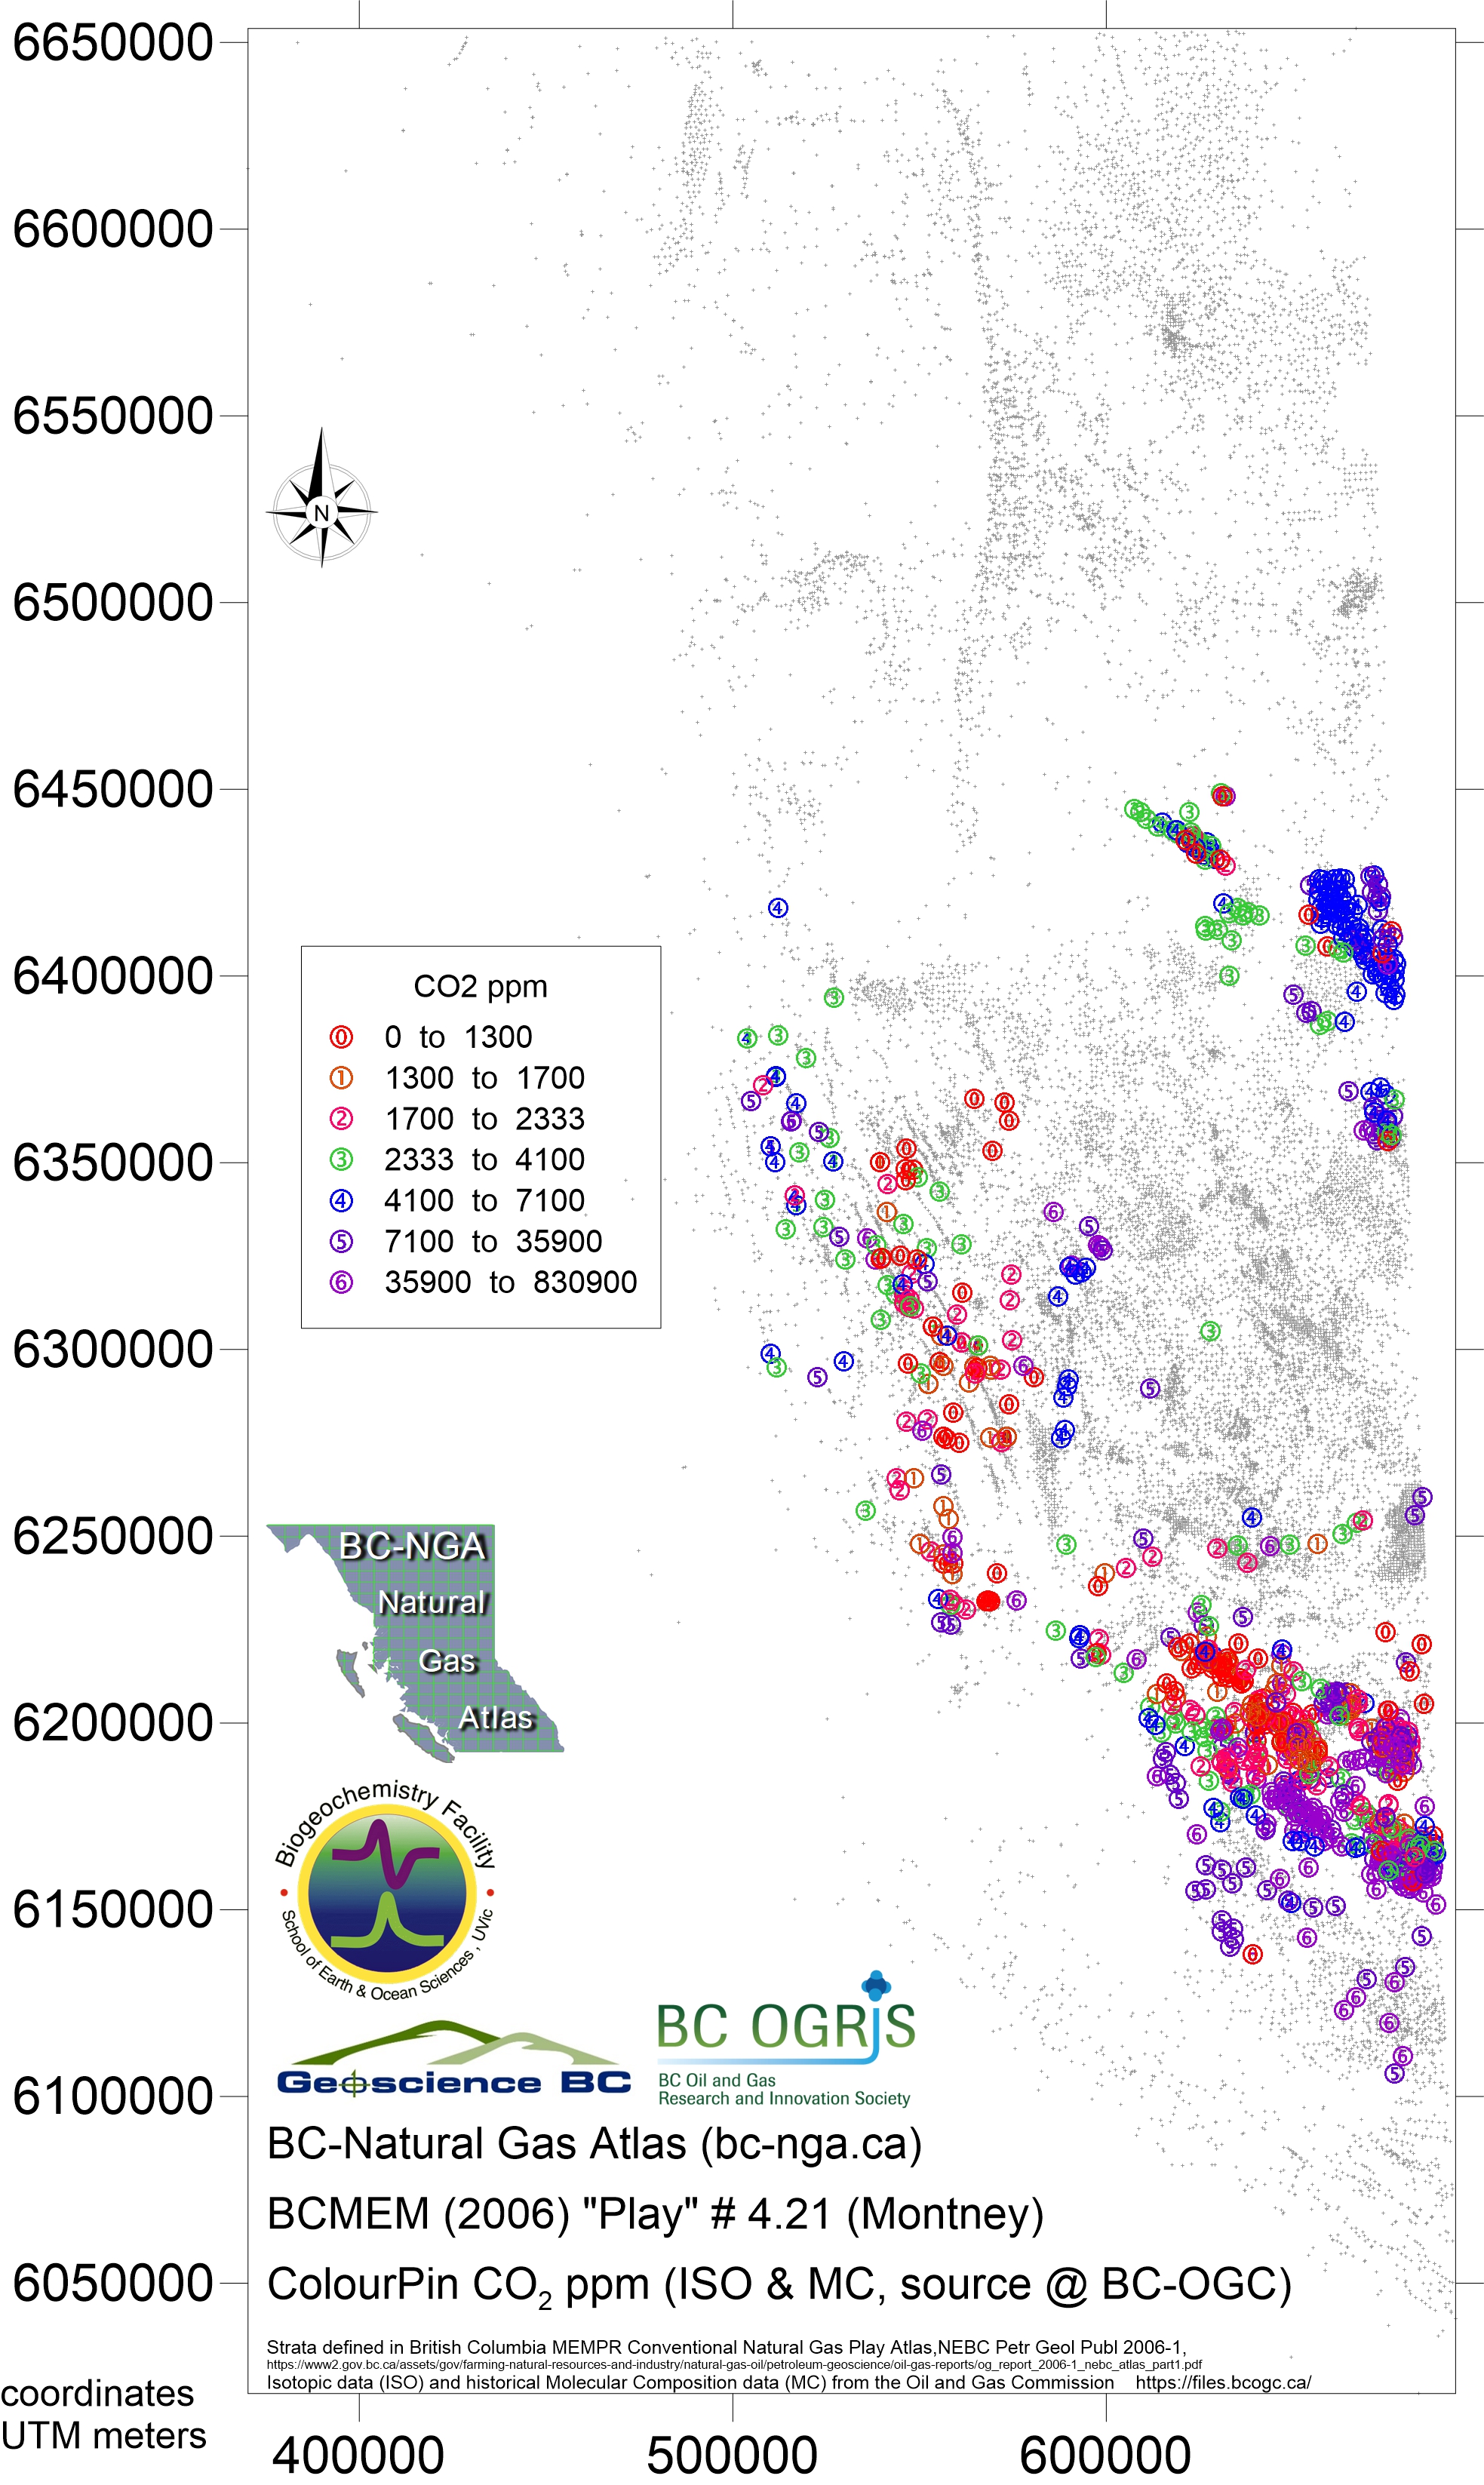
- Map215 Nov 2018 play 4.21 Montney eqv CO2 ppm
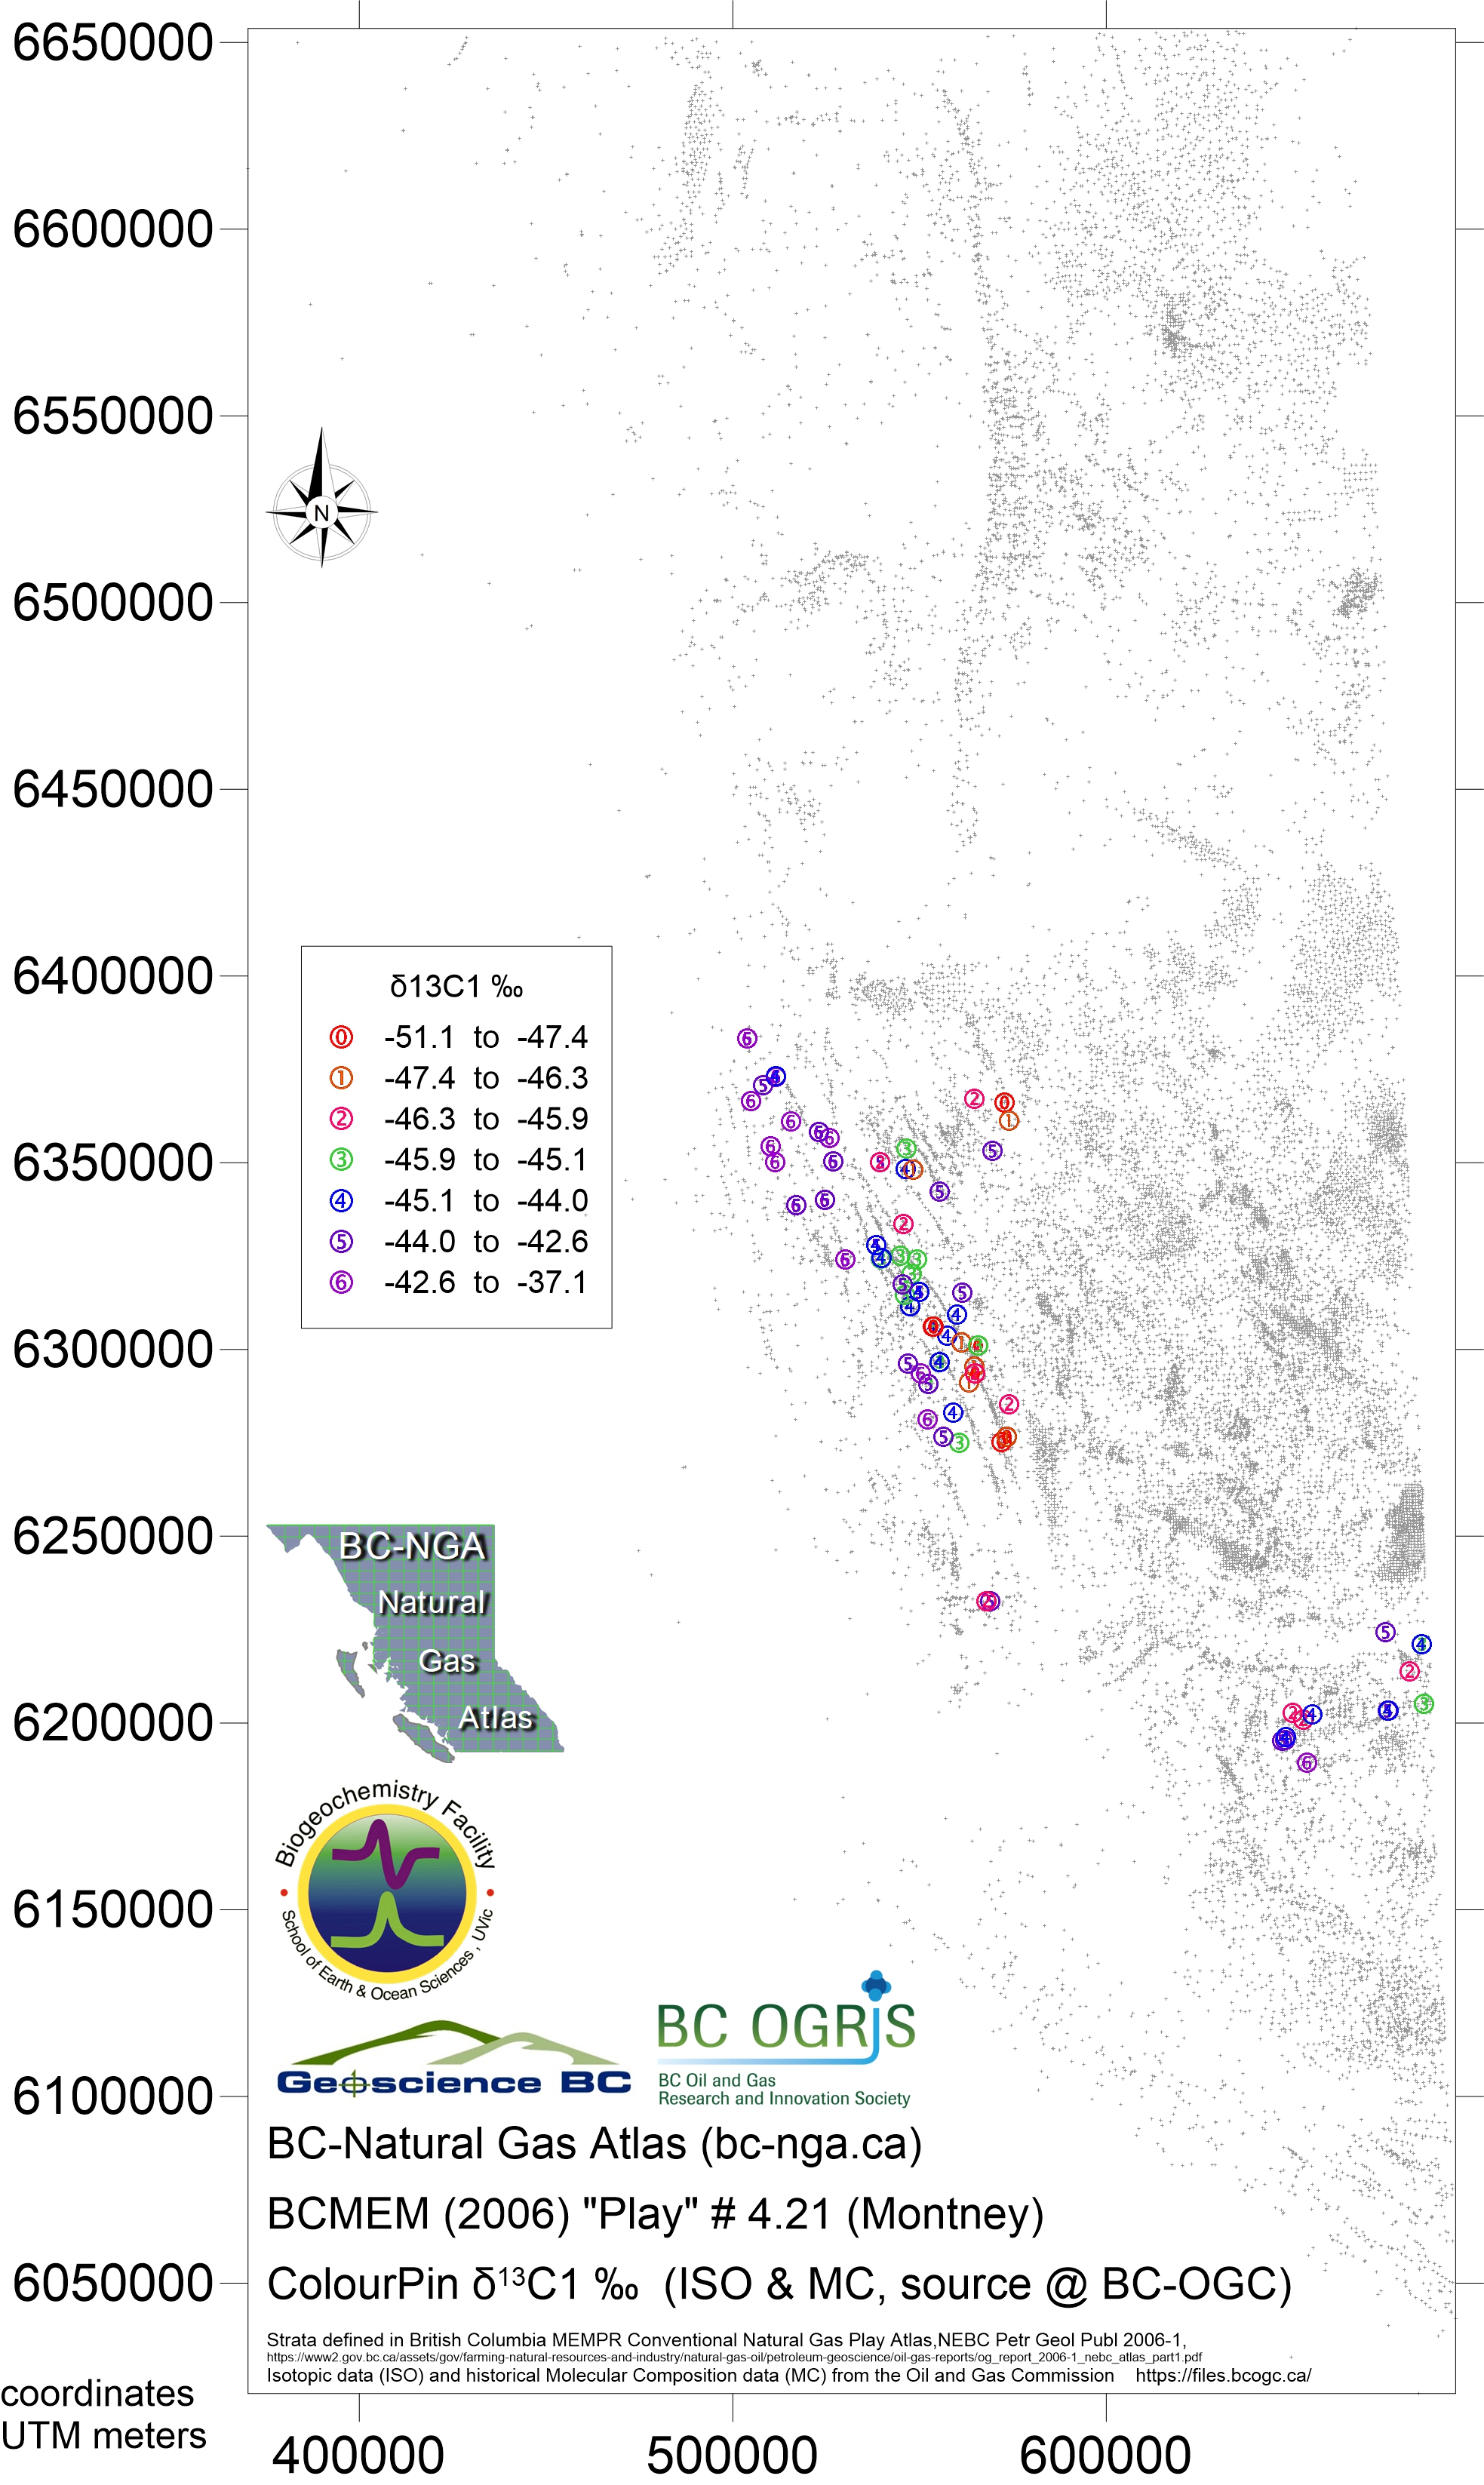
- Map216 Nov 2018 play 4.21 Montney eqv δ13CH4
- Map217 Nov 2018 play 4.21 Montney eqv Cδ2H4
- Map218 Nov 2018 play 4.21 Montney eqv δ13C2H6
- Map219 Nov 2018 play 4.21 Montney eqv δ13C3H8
- Map220 Nov 2018 play 4.21 Montney eqv δ13iC4H10
- Map221 Nov 2018 play 4.21 Montney eqv δ13nC4H10
- Map222 Nov 2018 play 4.21 Montney eqv δ13nC5H12
- Map223 Nov 2018 play 4.21 Montney eqv δ13CO2
- Map224 Nov 2018 play 4.21 Montney eqv time series gradient Bernard ratio
- Map225 Nov 2018 play 4.21 Montney eqv time series gradient CO2
- Map226 Nov 2018 play 4.21 Montney eqv time series gradient H2S
- Map227 Nov 2018 play 4.21 Montney eqv time series start point Bernard ratio
- Map228 Nov 2018 play 4.21 Montney eqv time series start point CO2
- Map229 Nov 2018 play 4.21 Montney eqv time series start point H2S
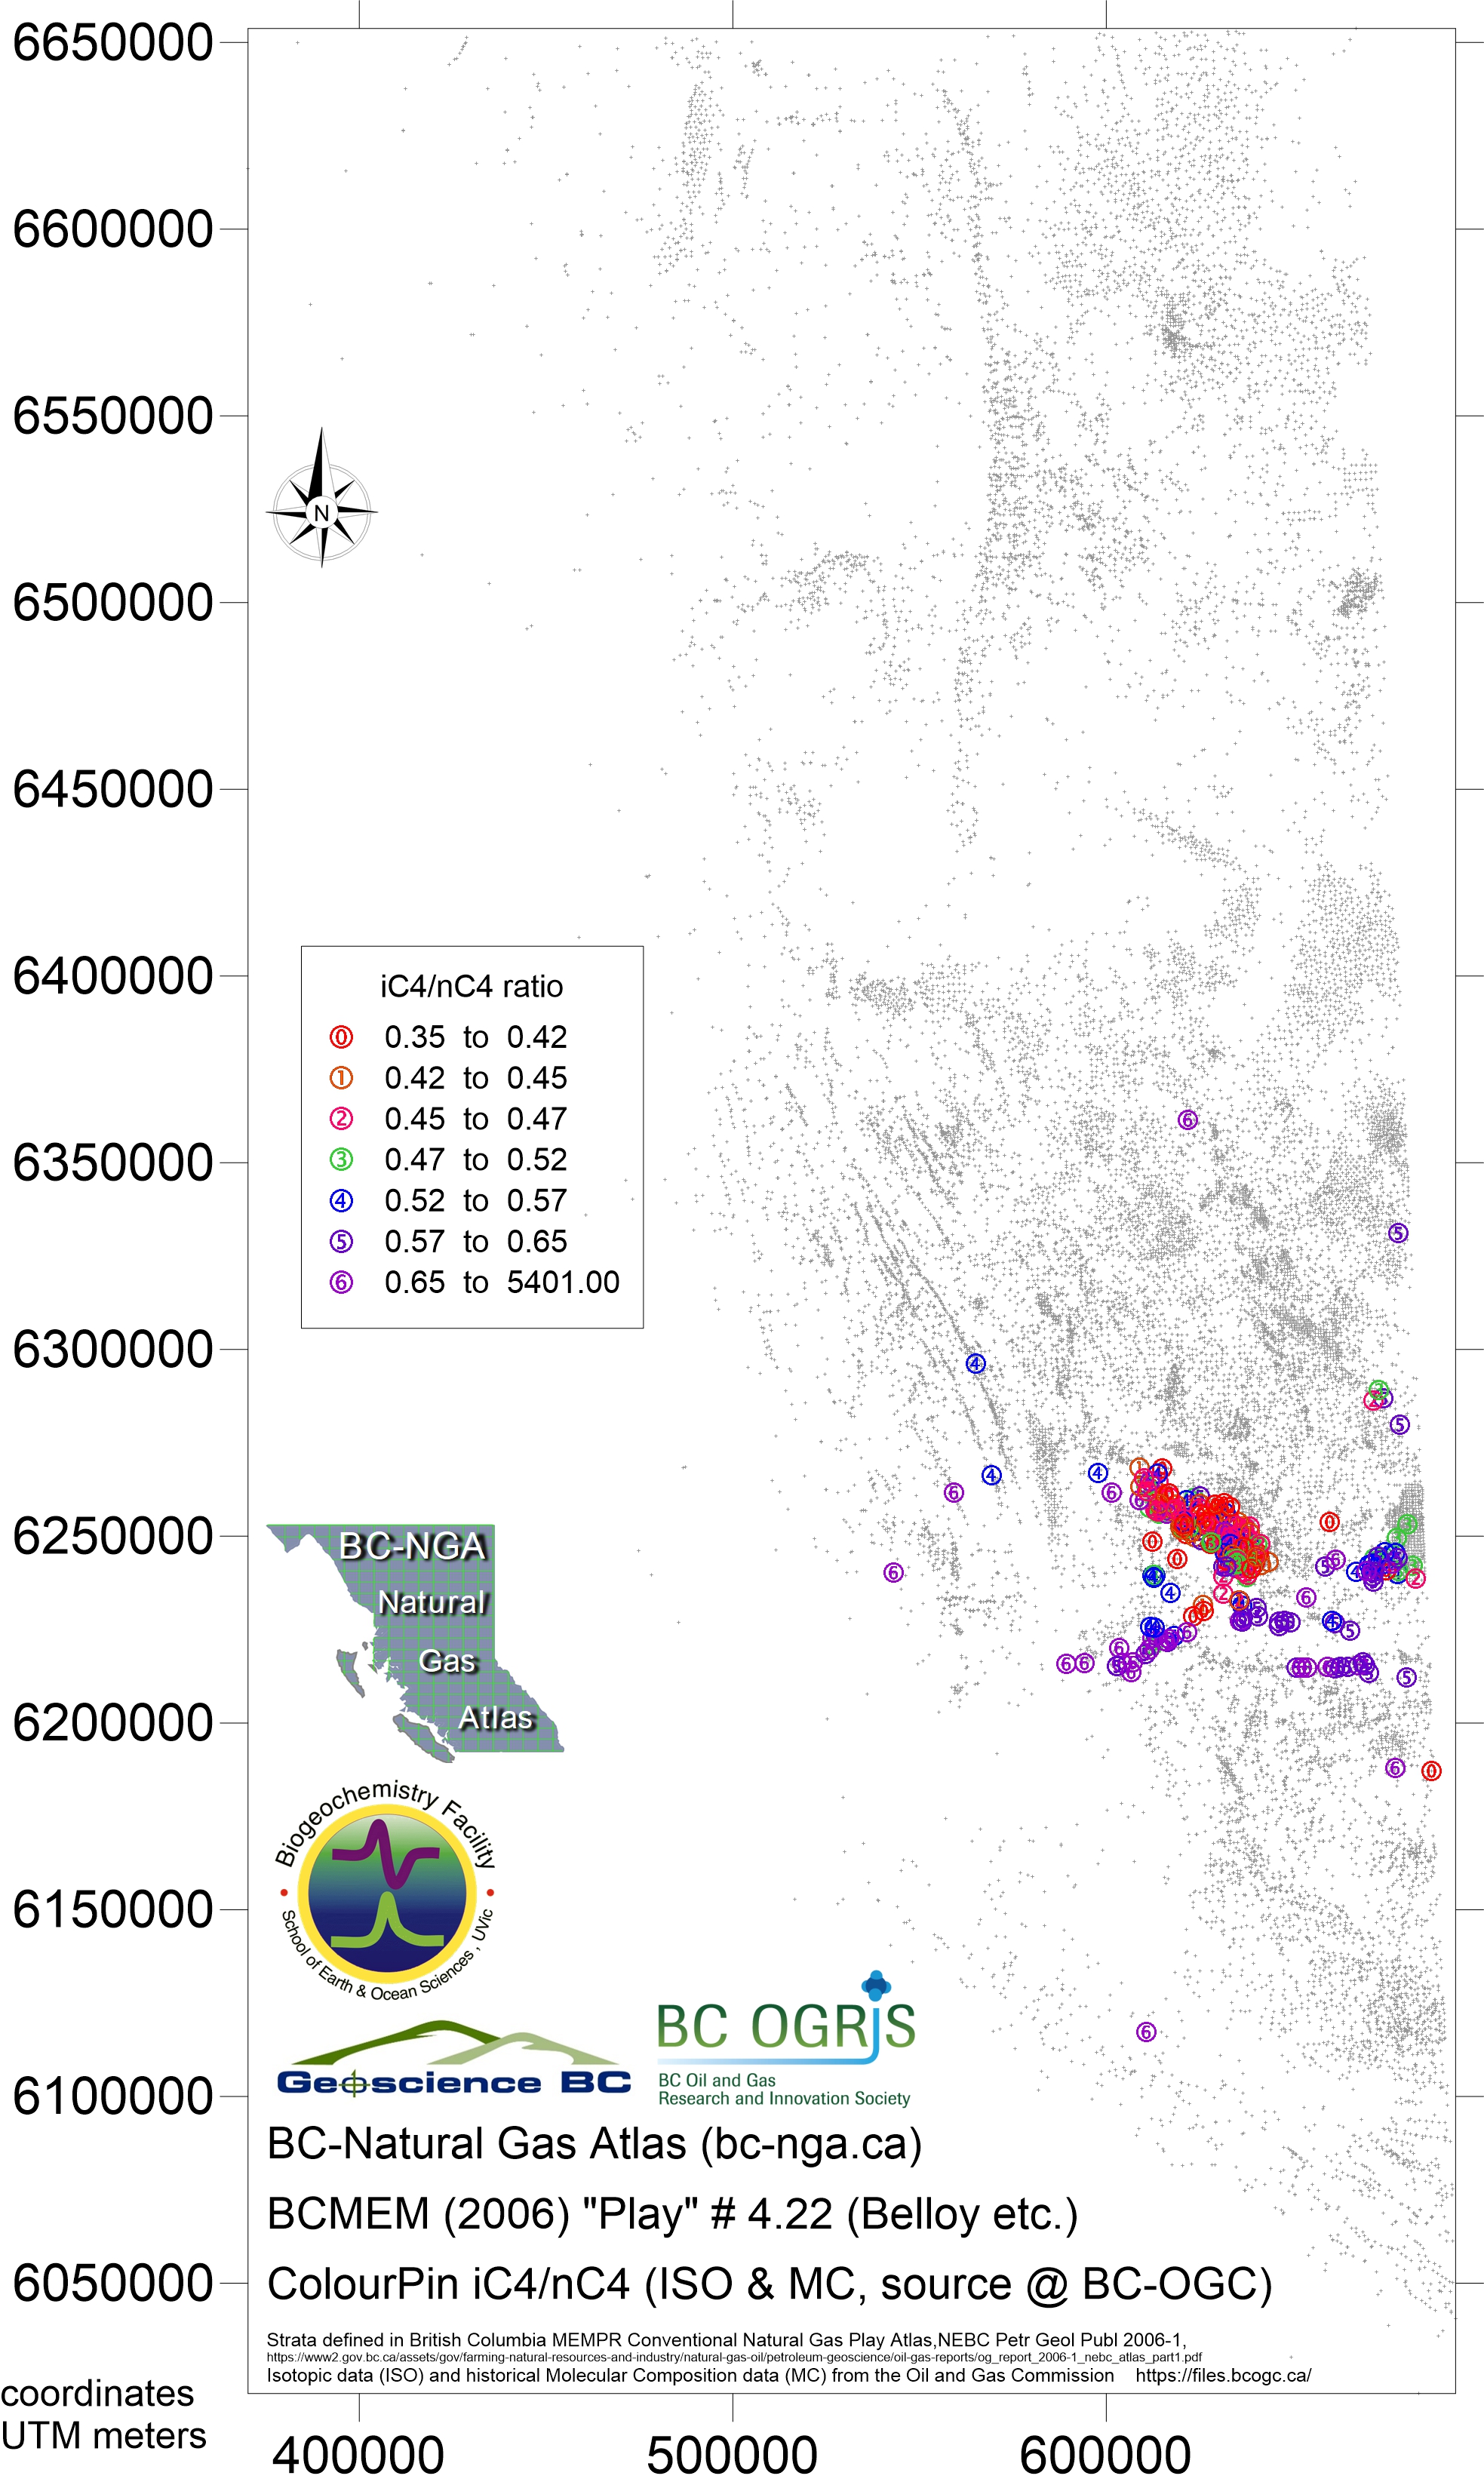
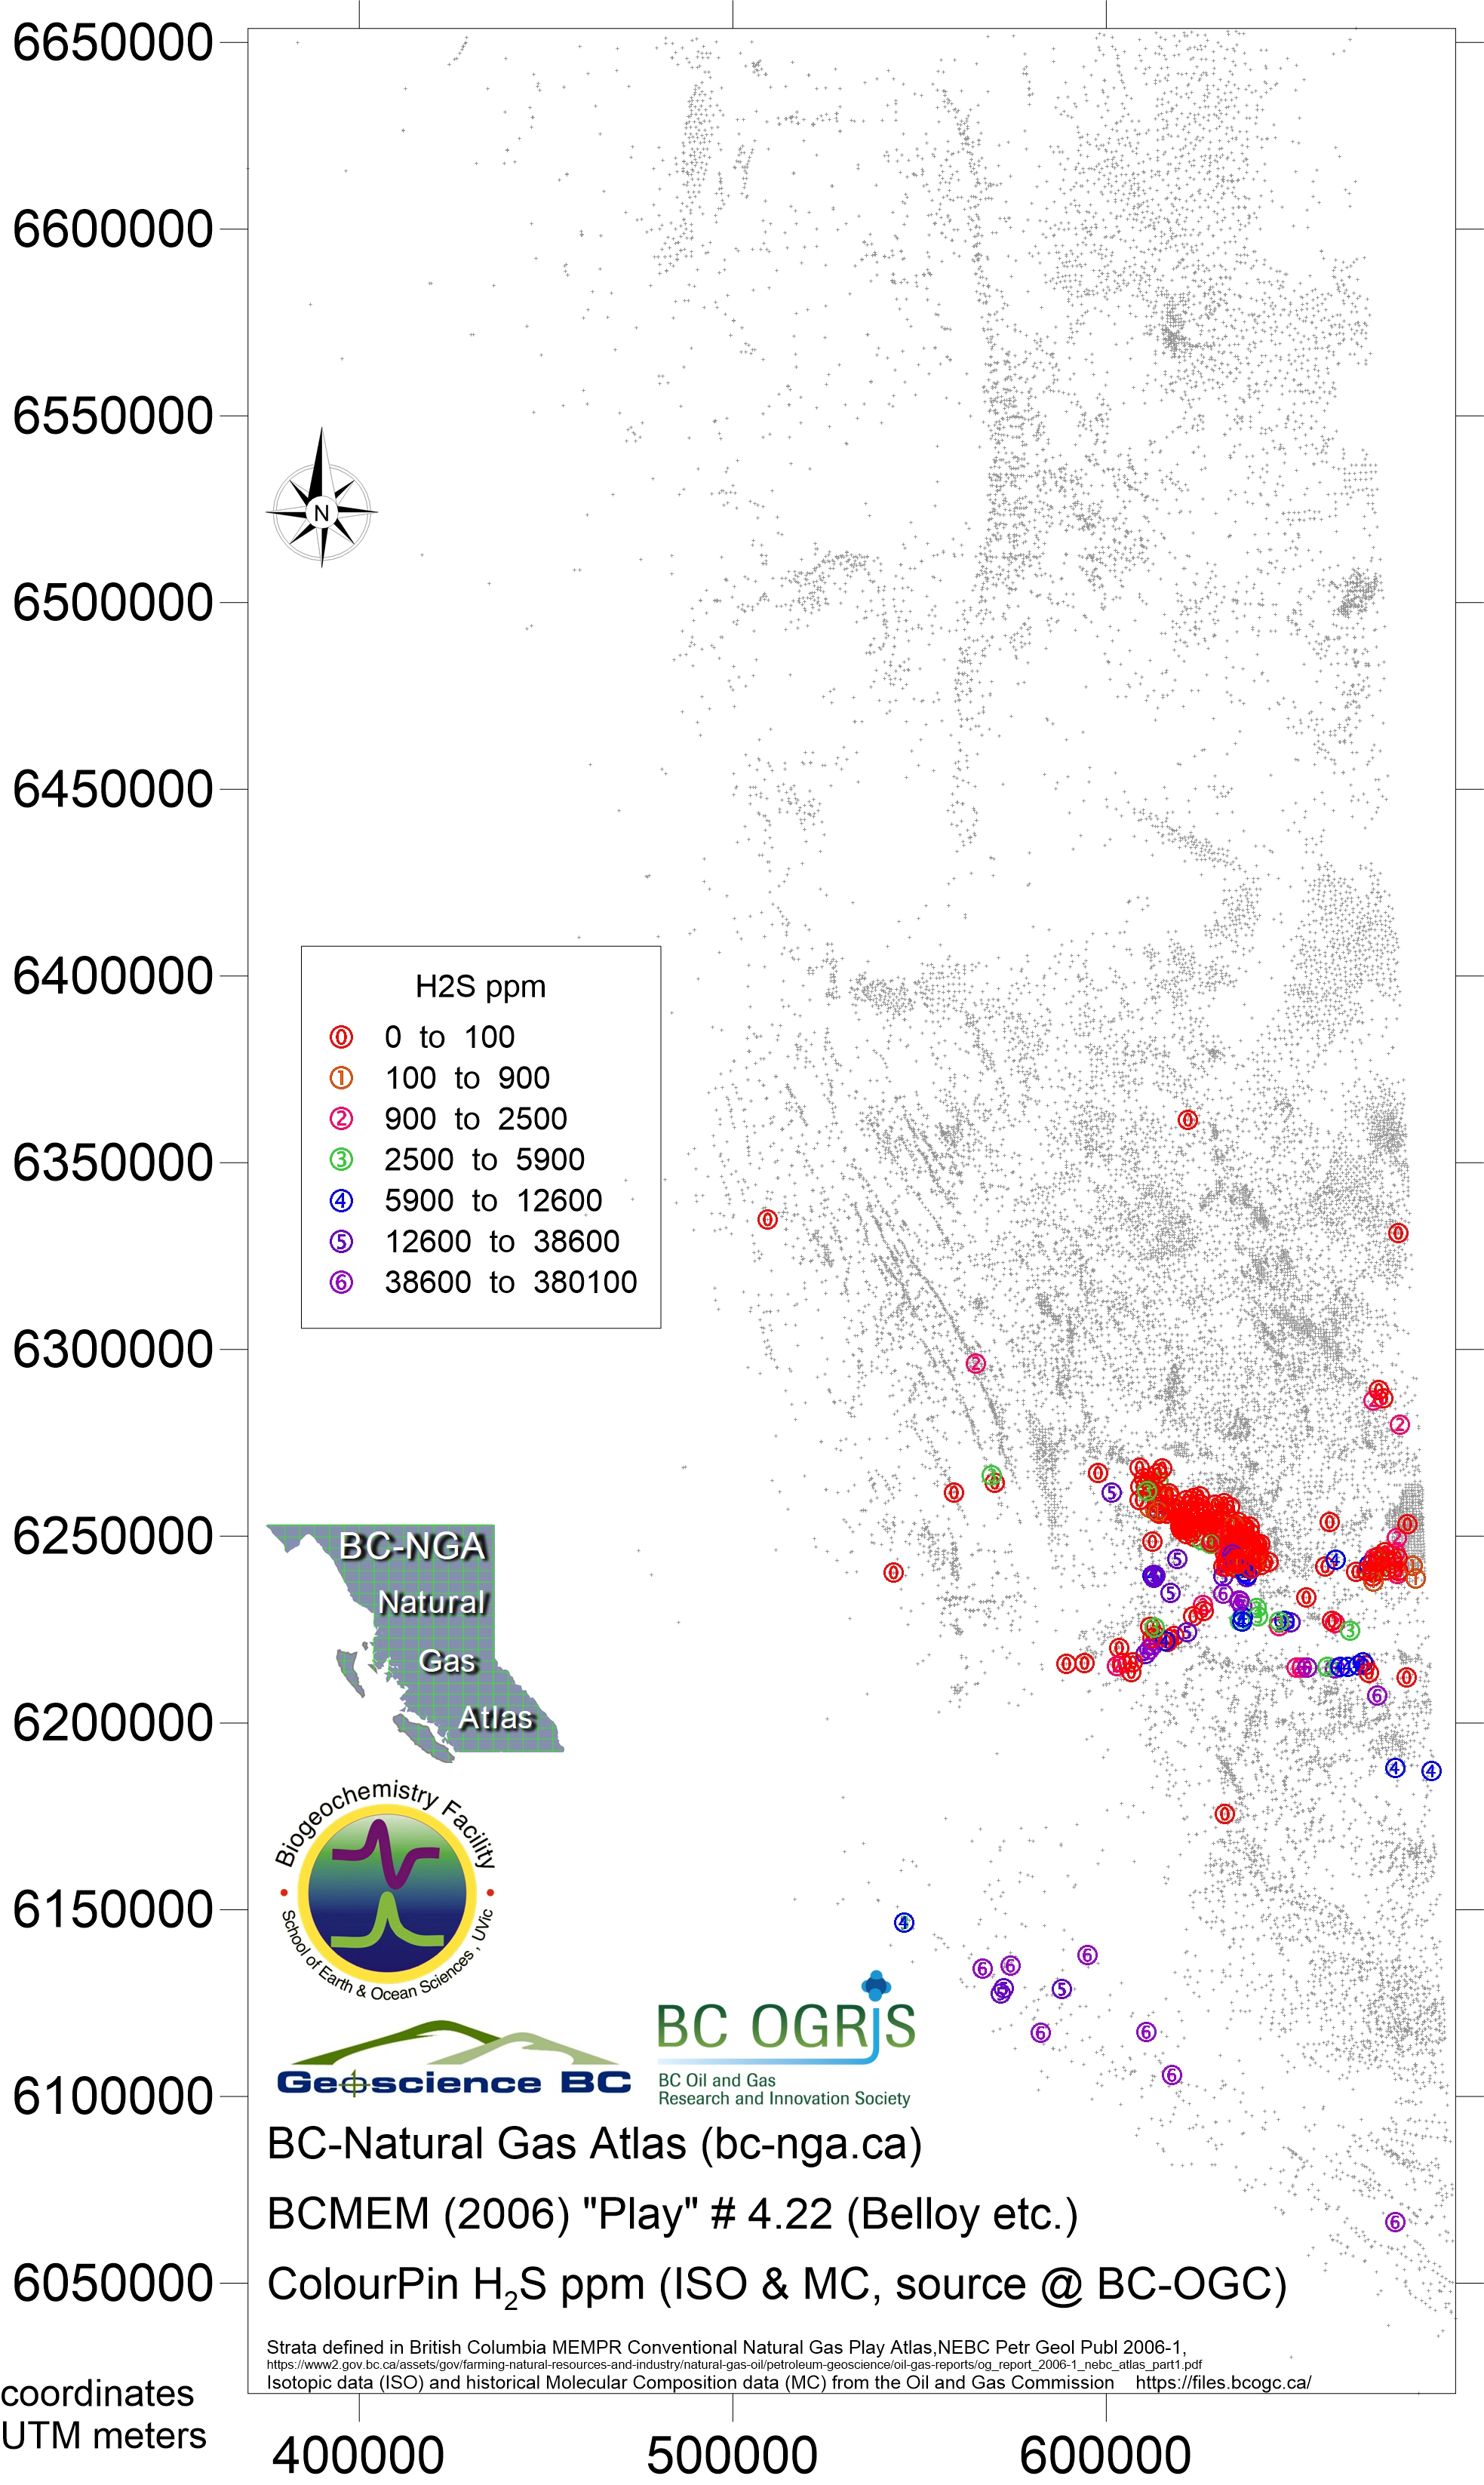
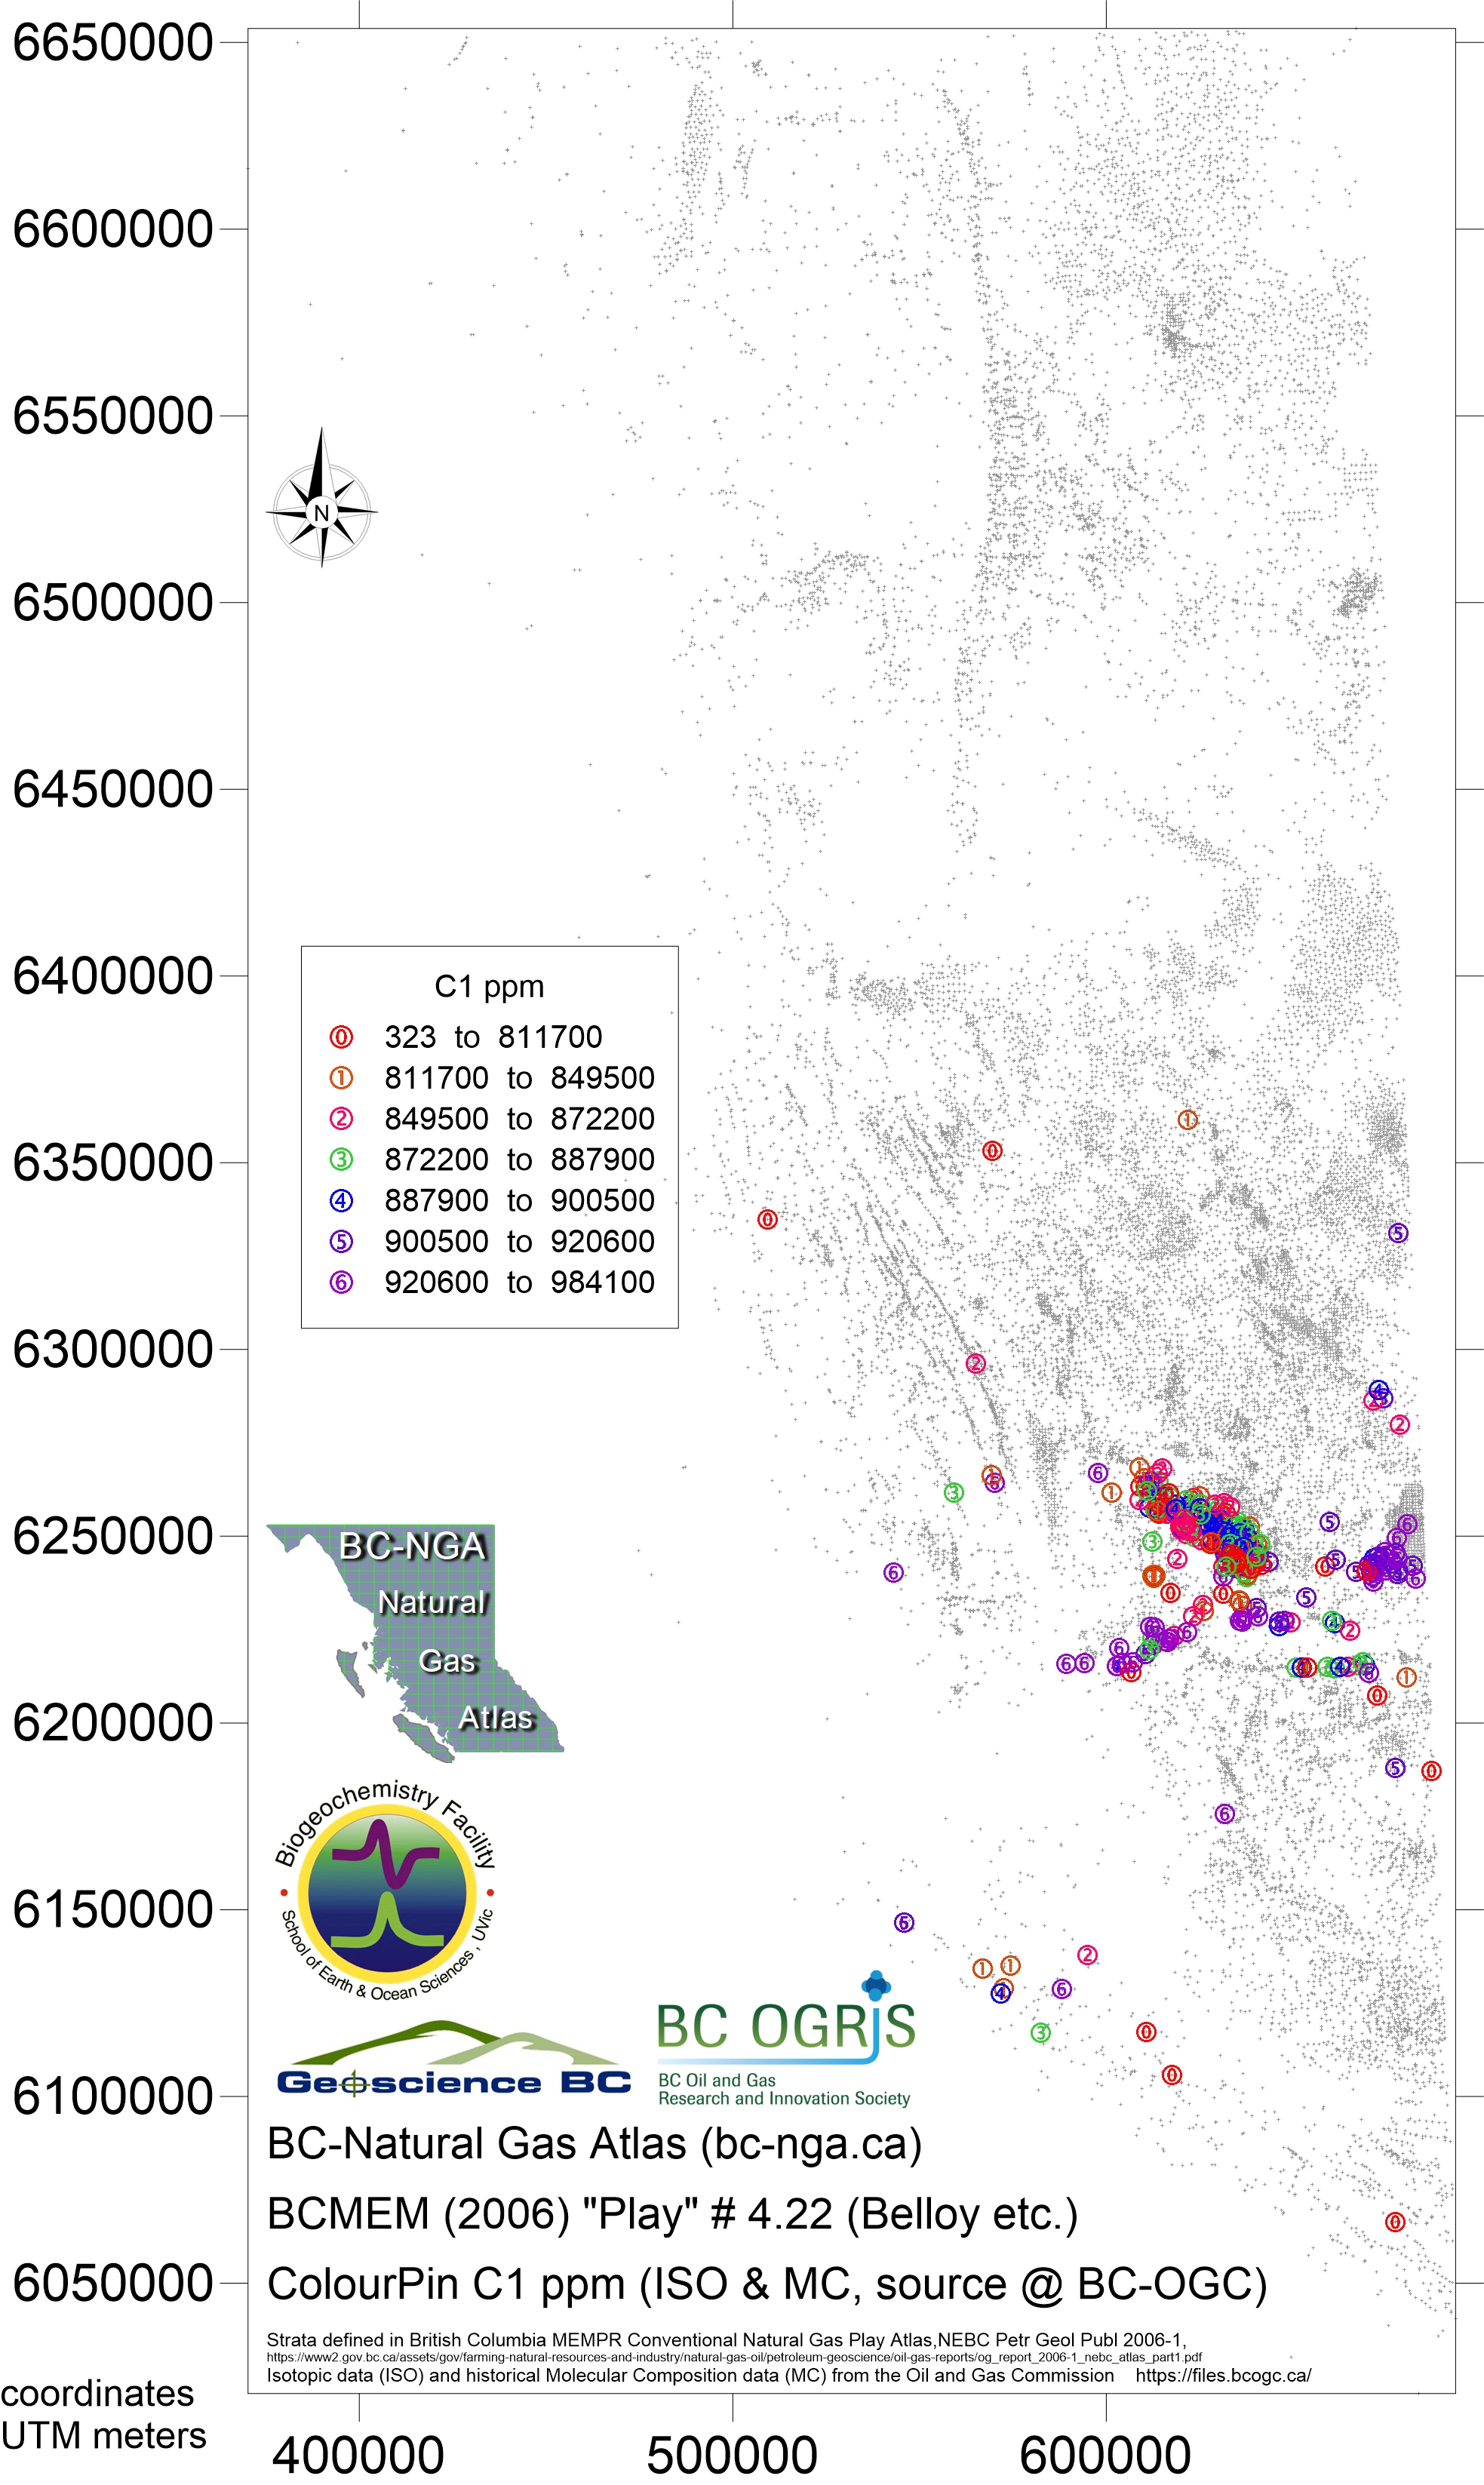
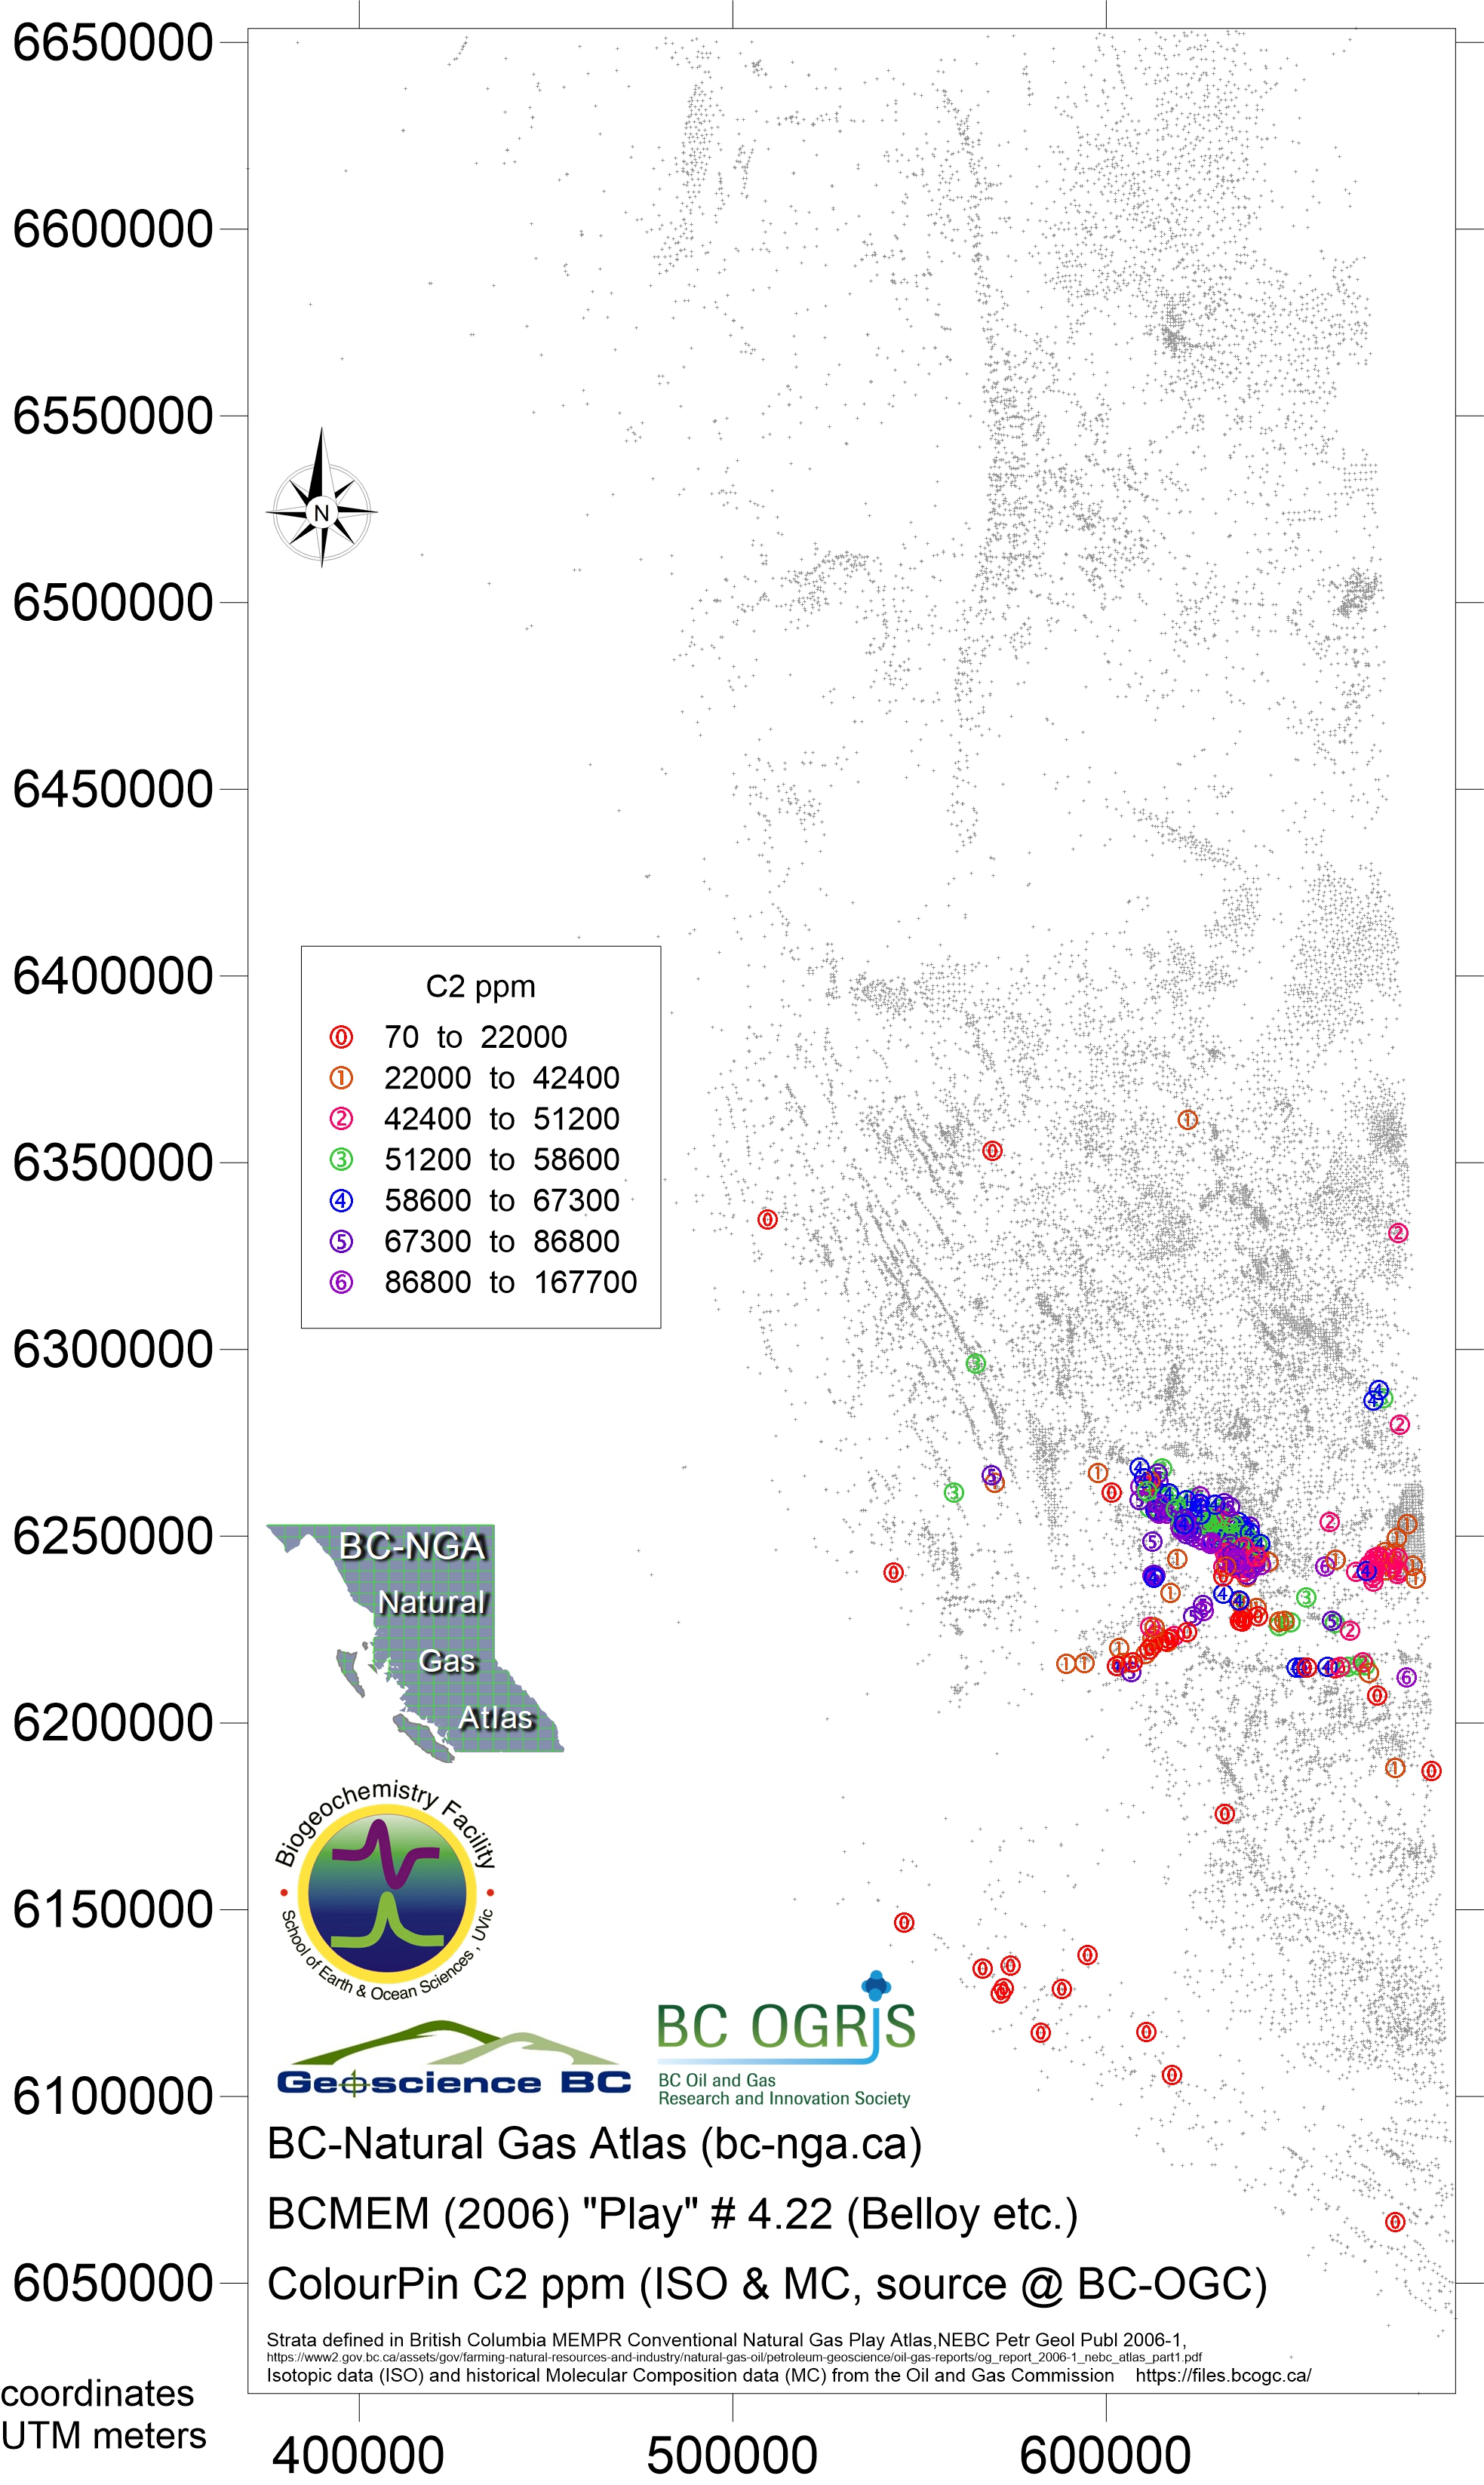
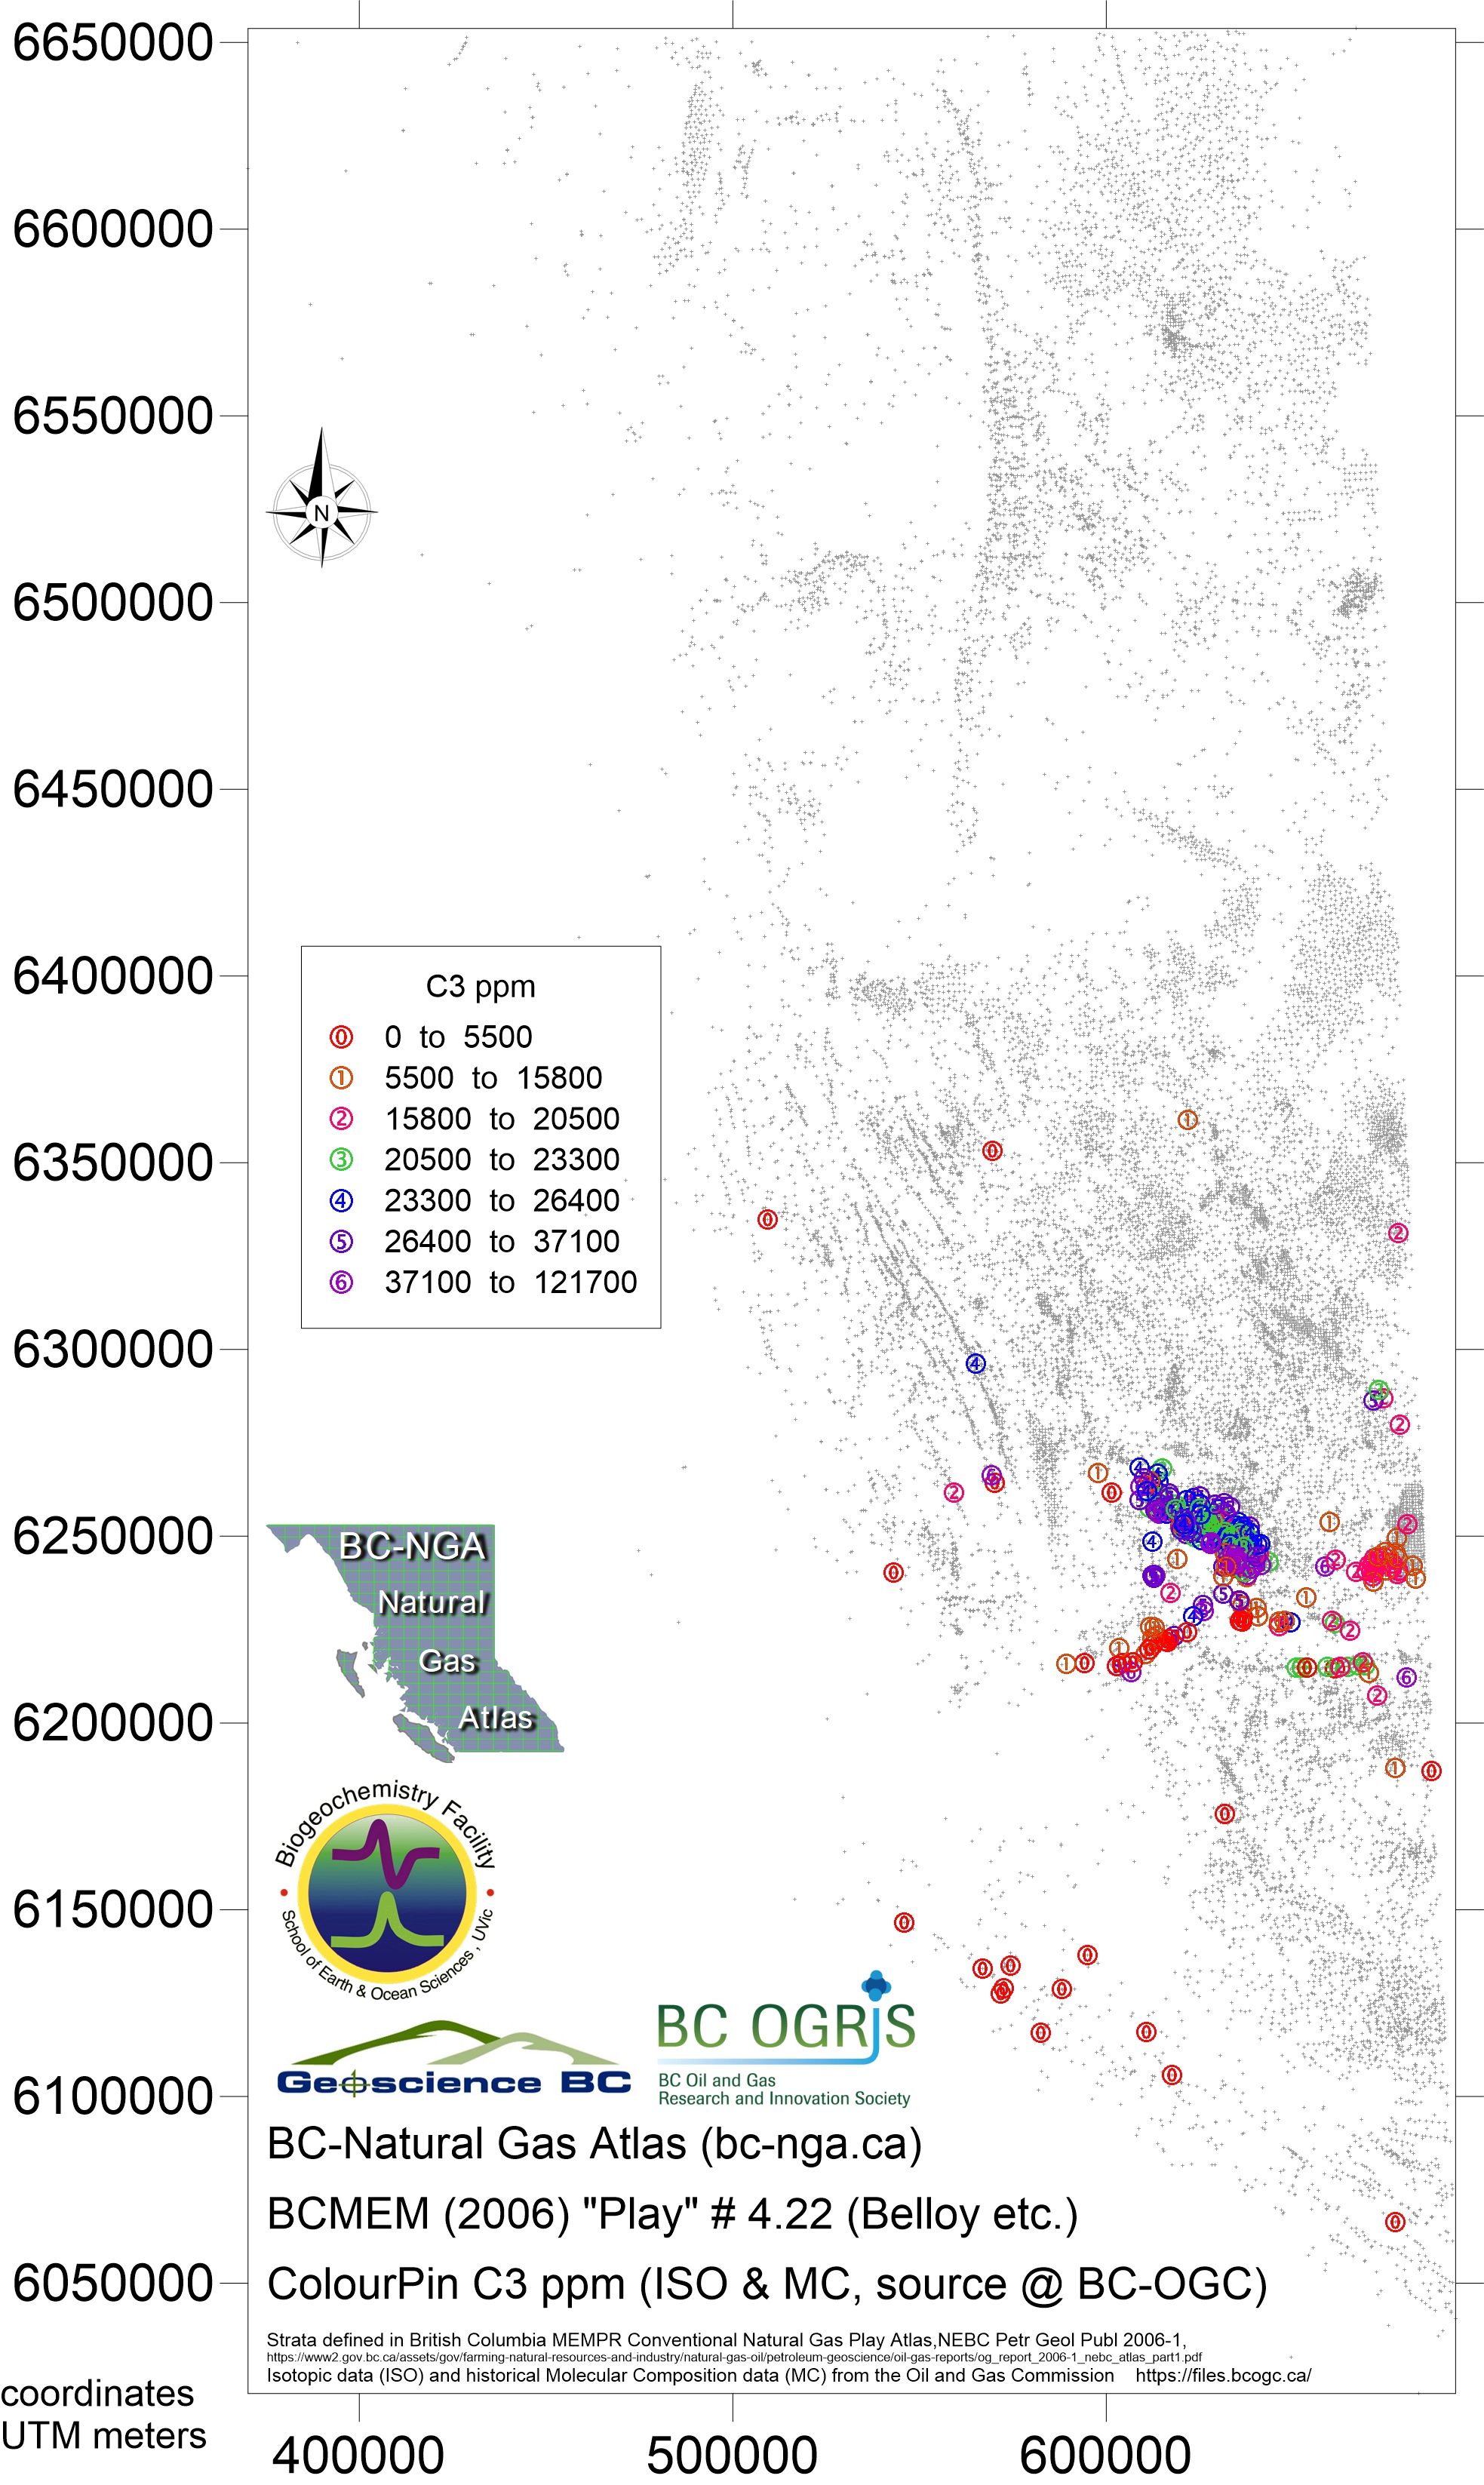
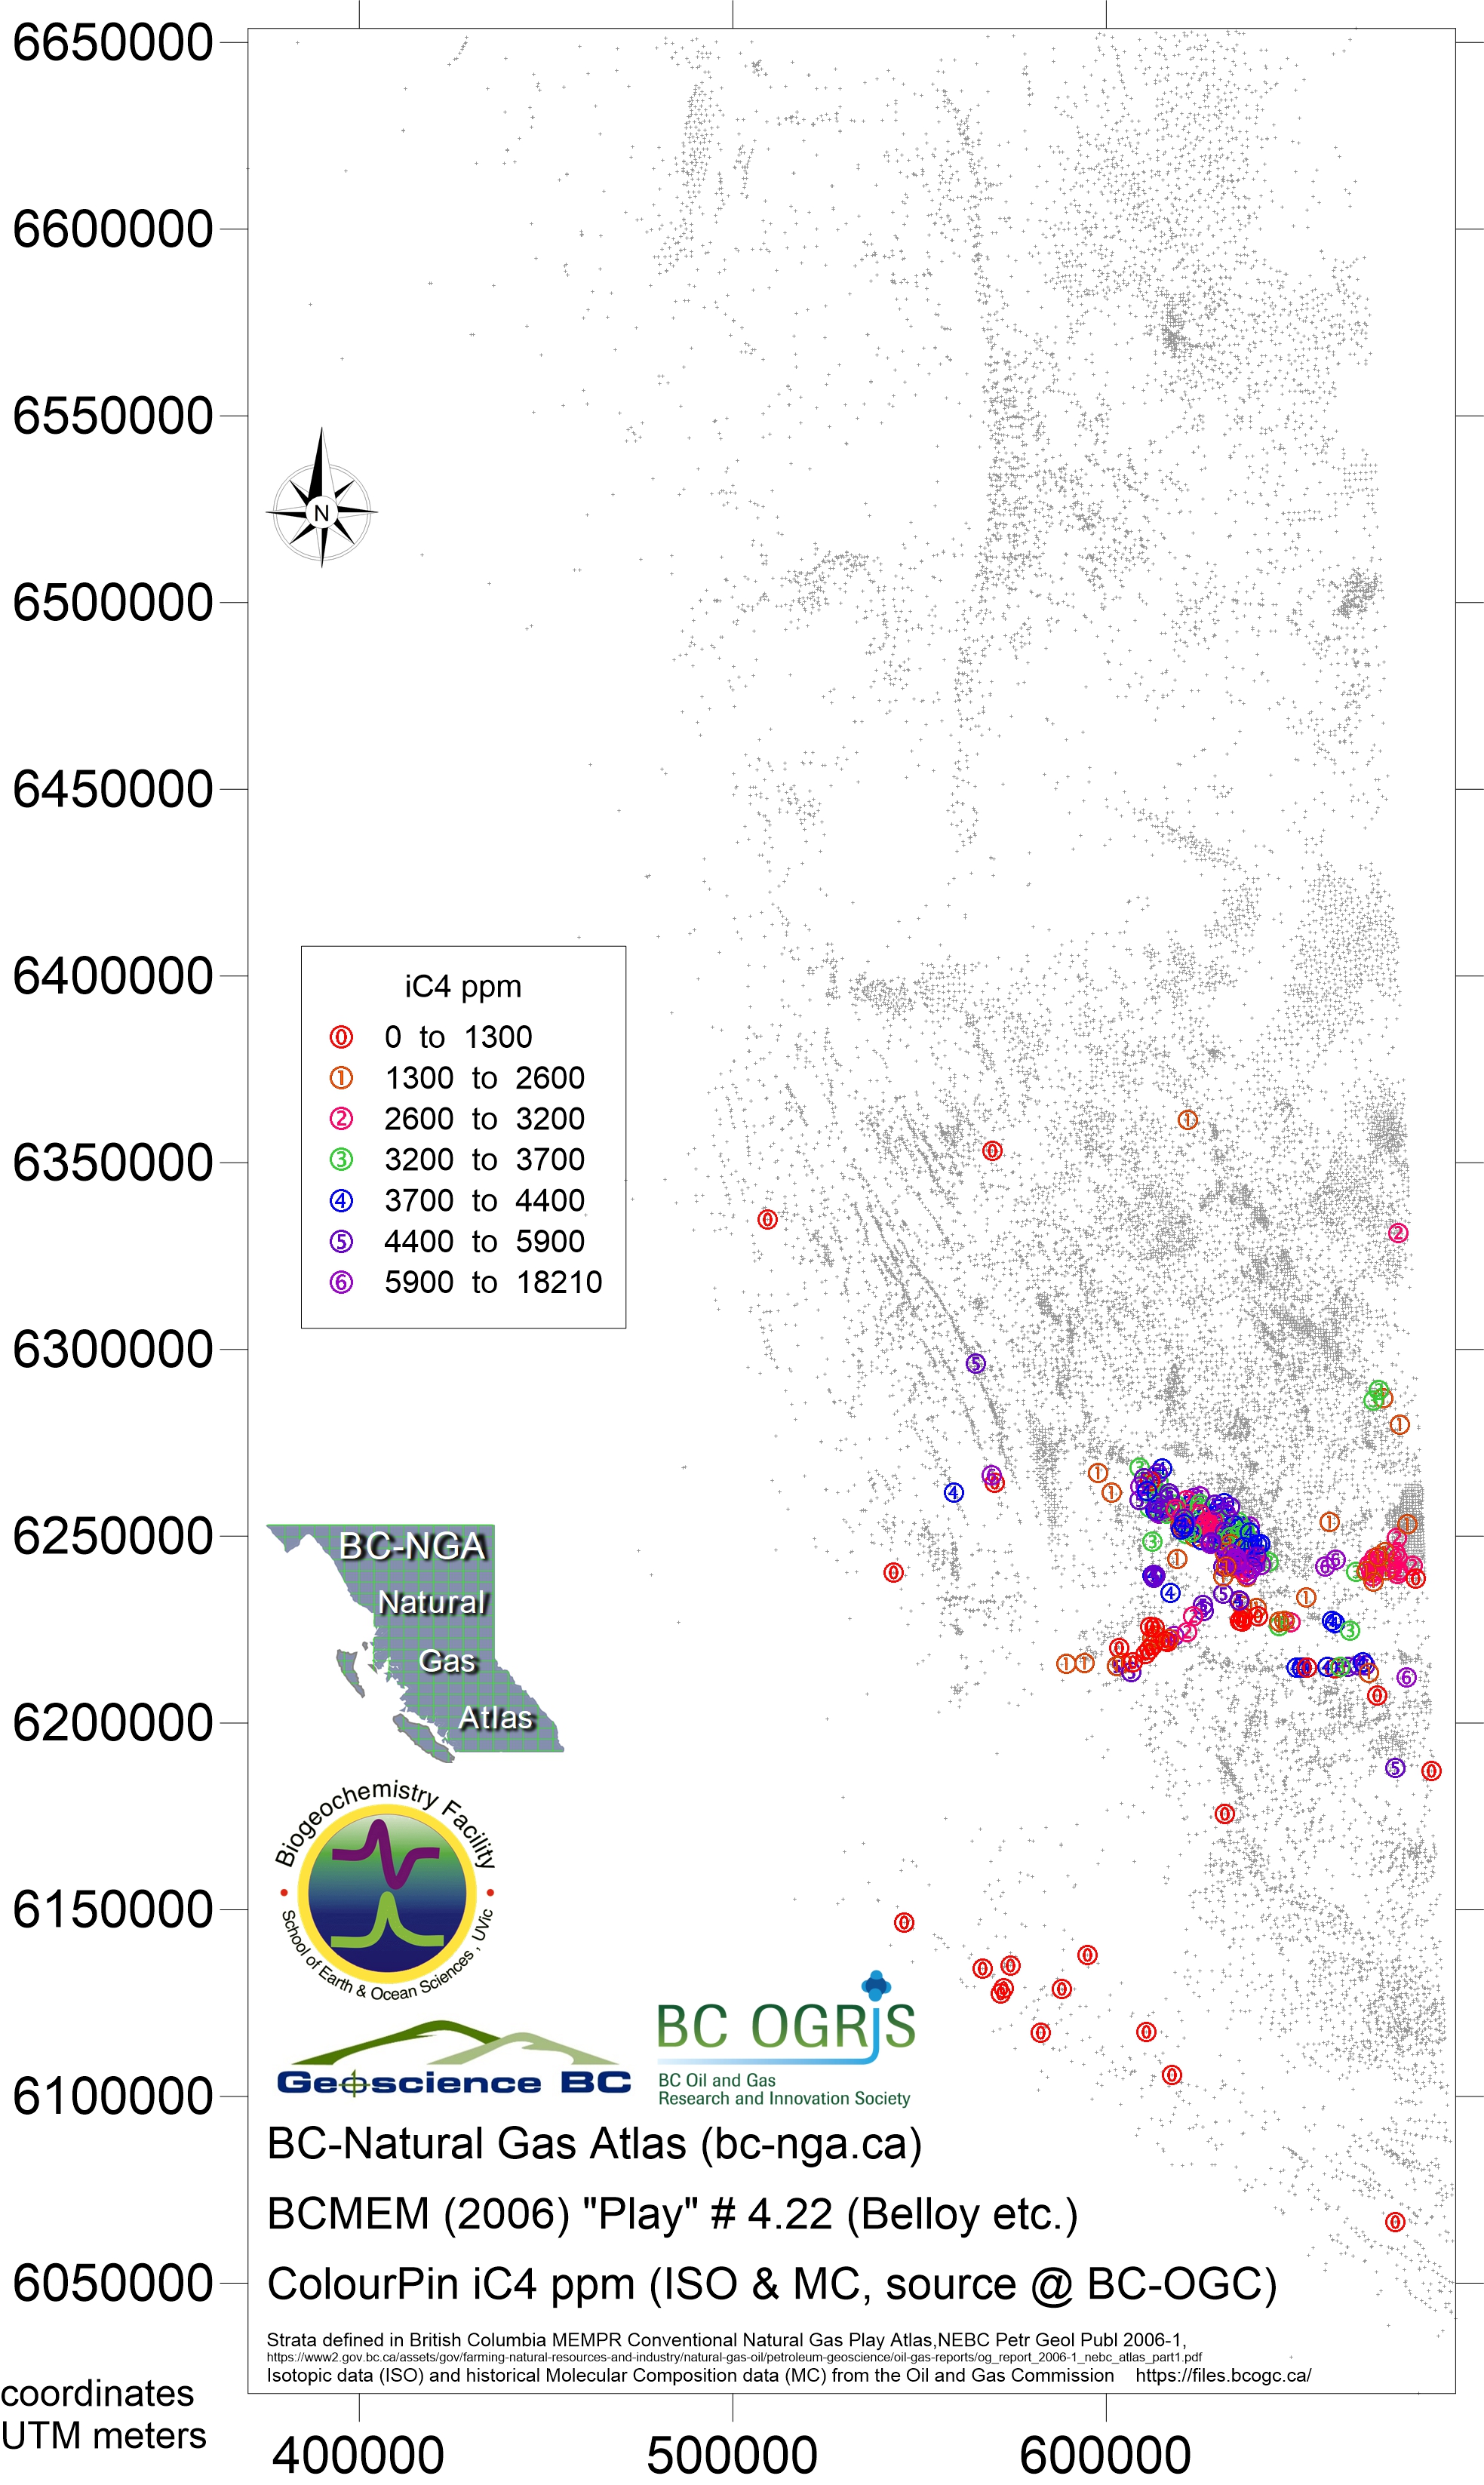
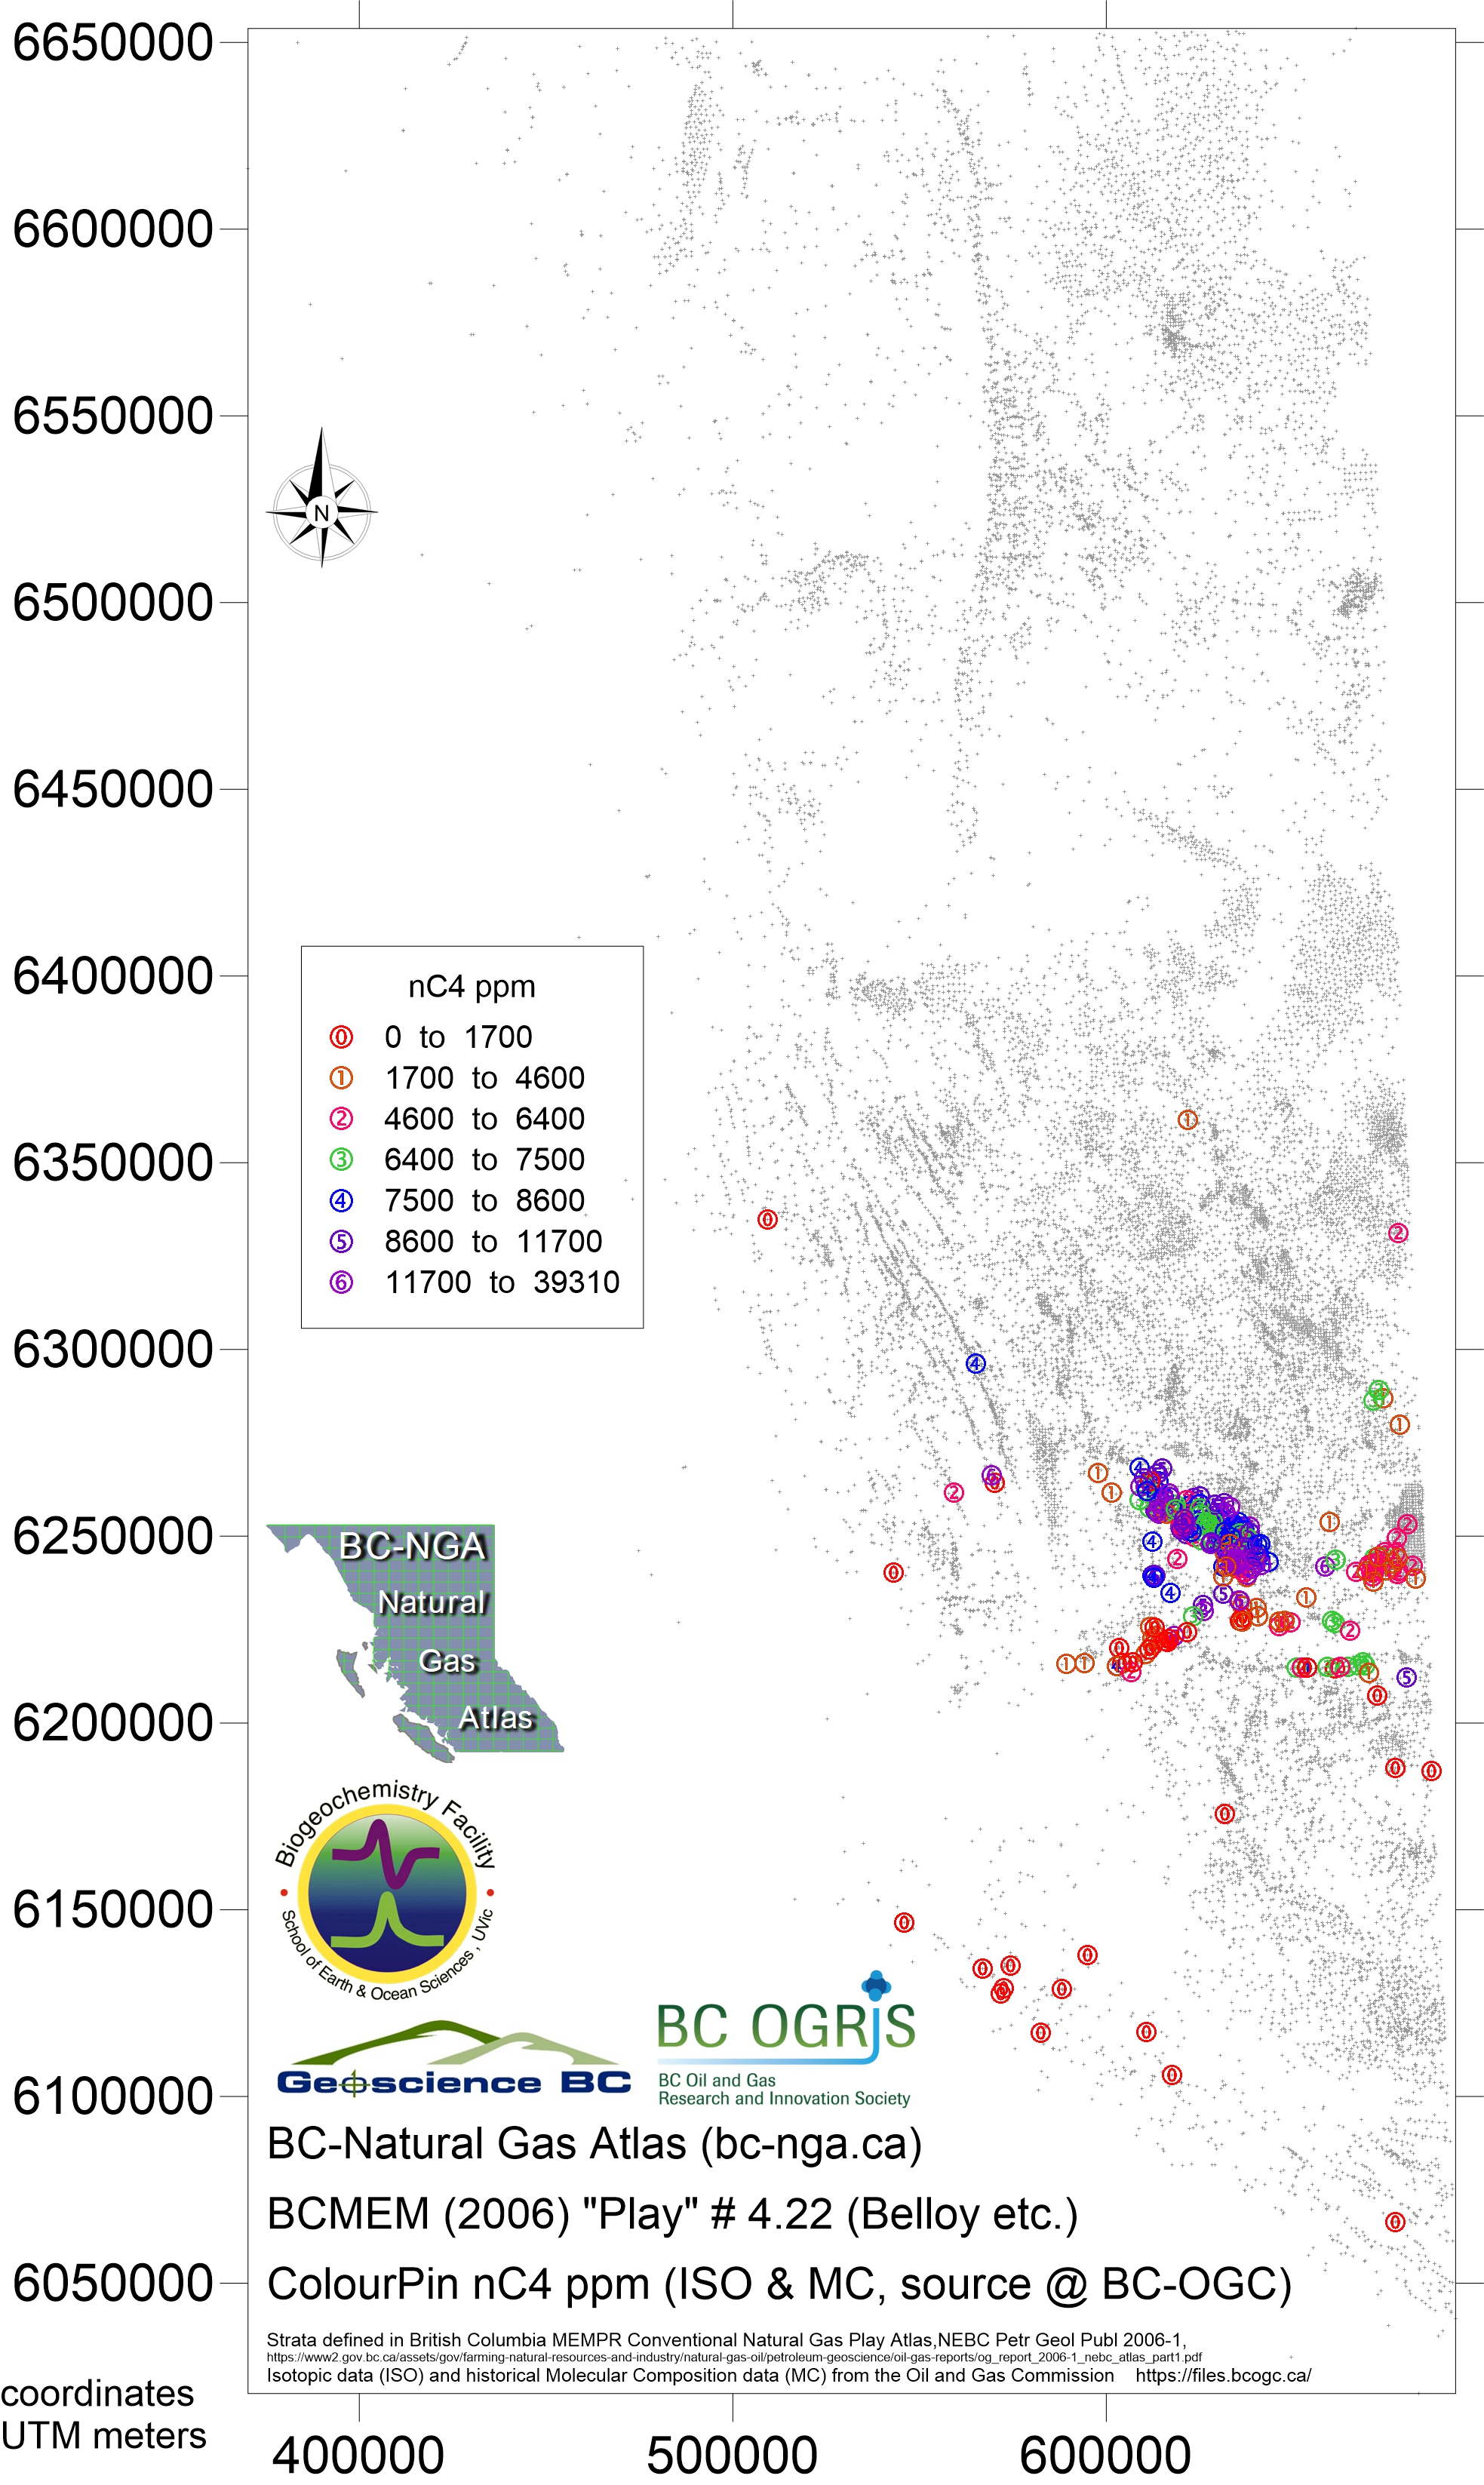
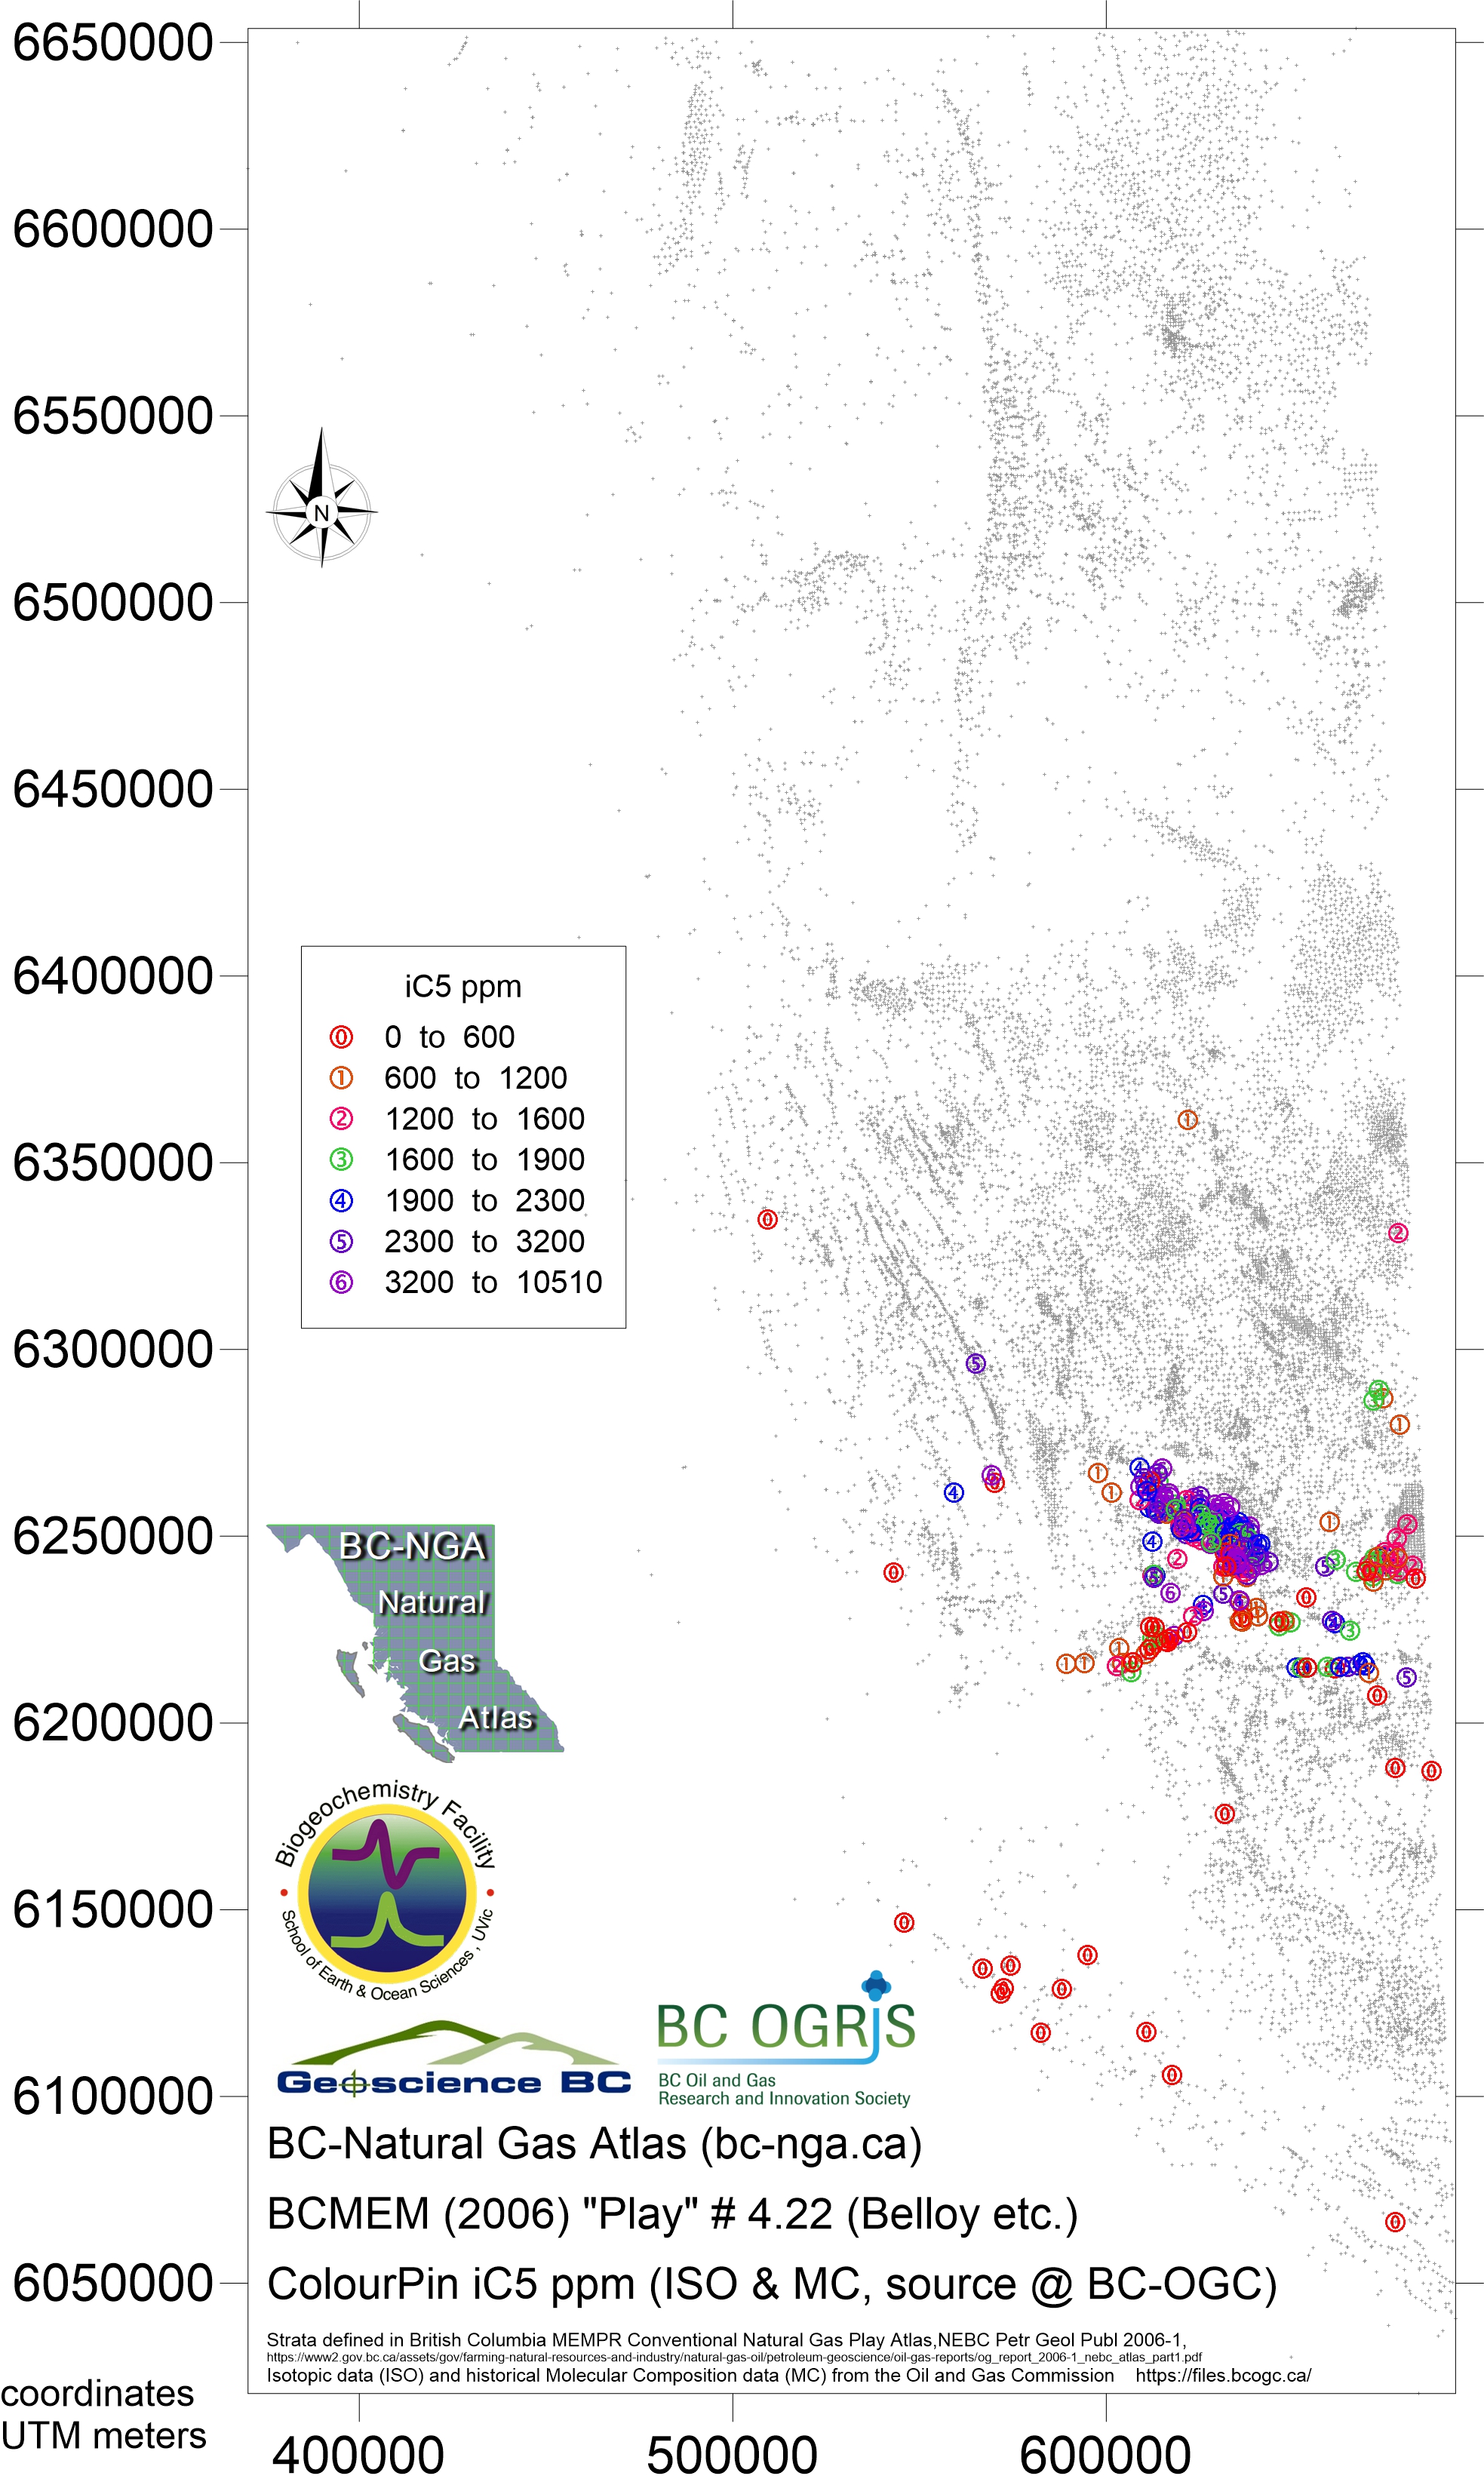
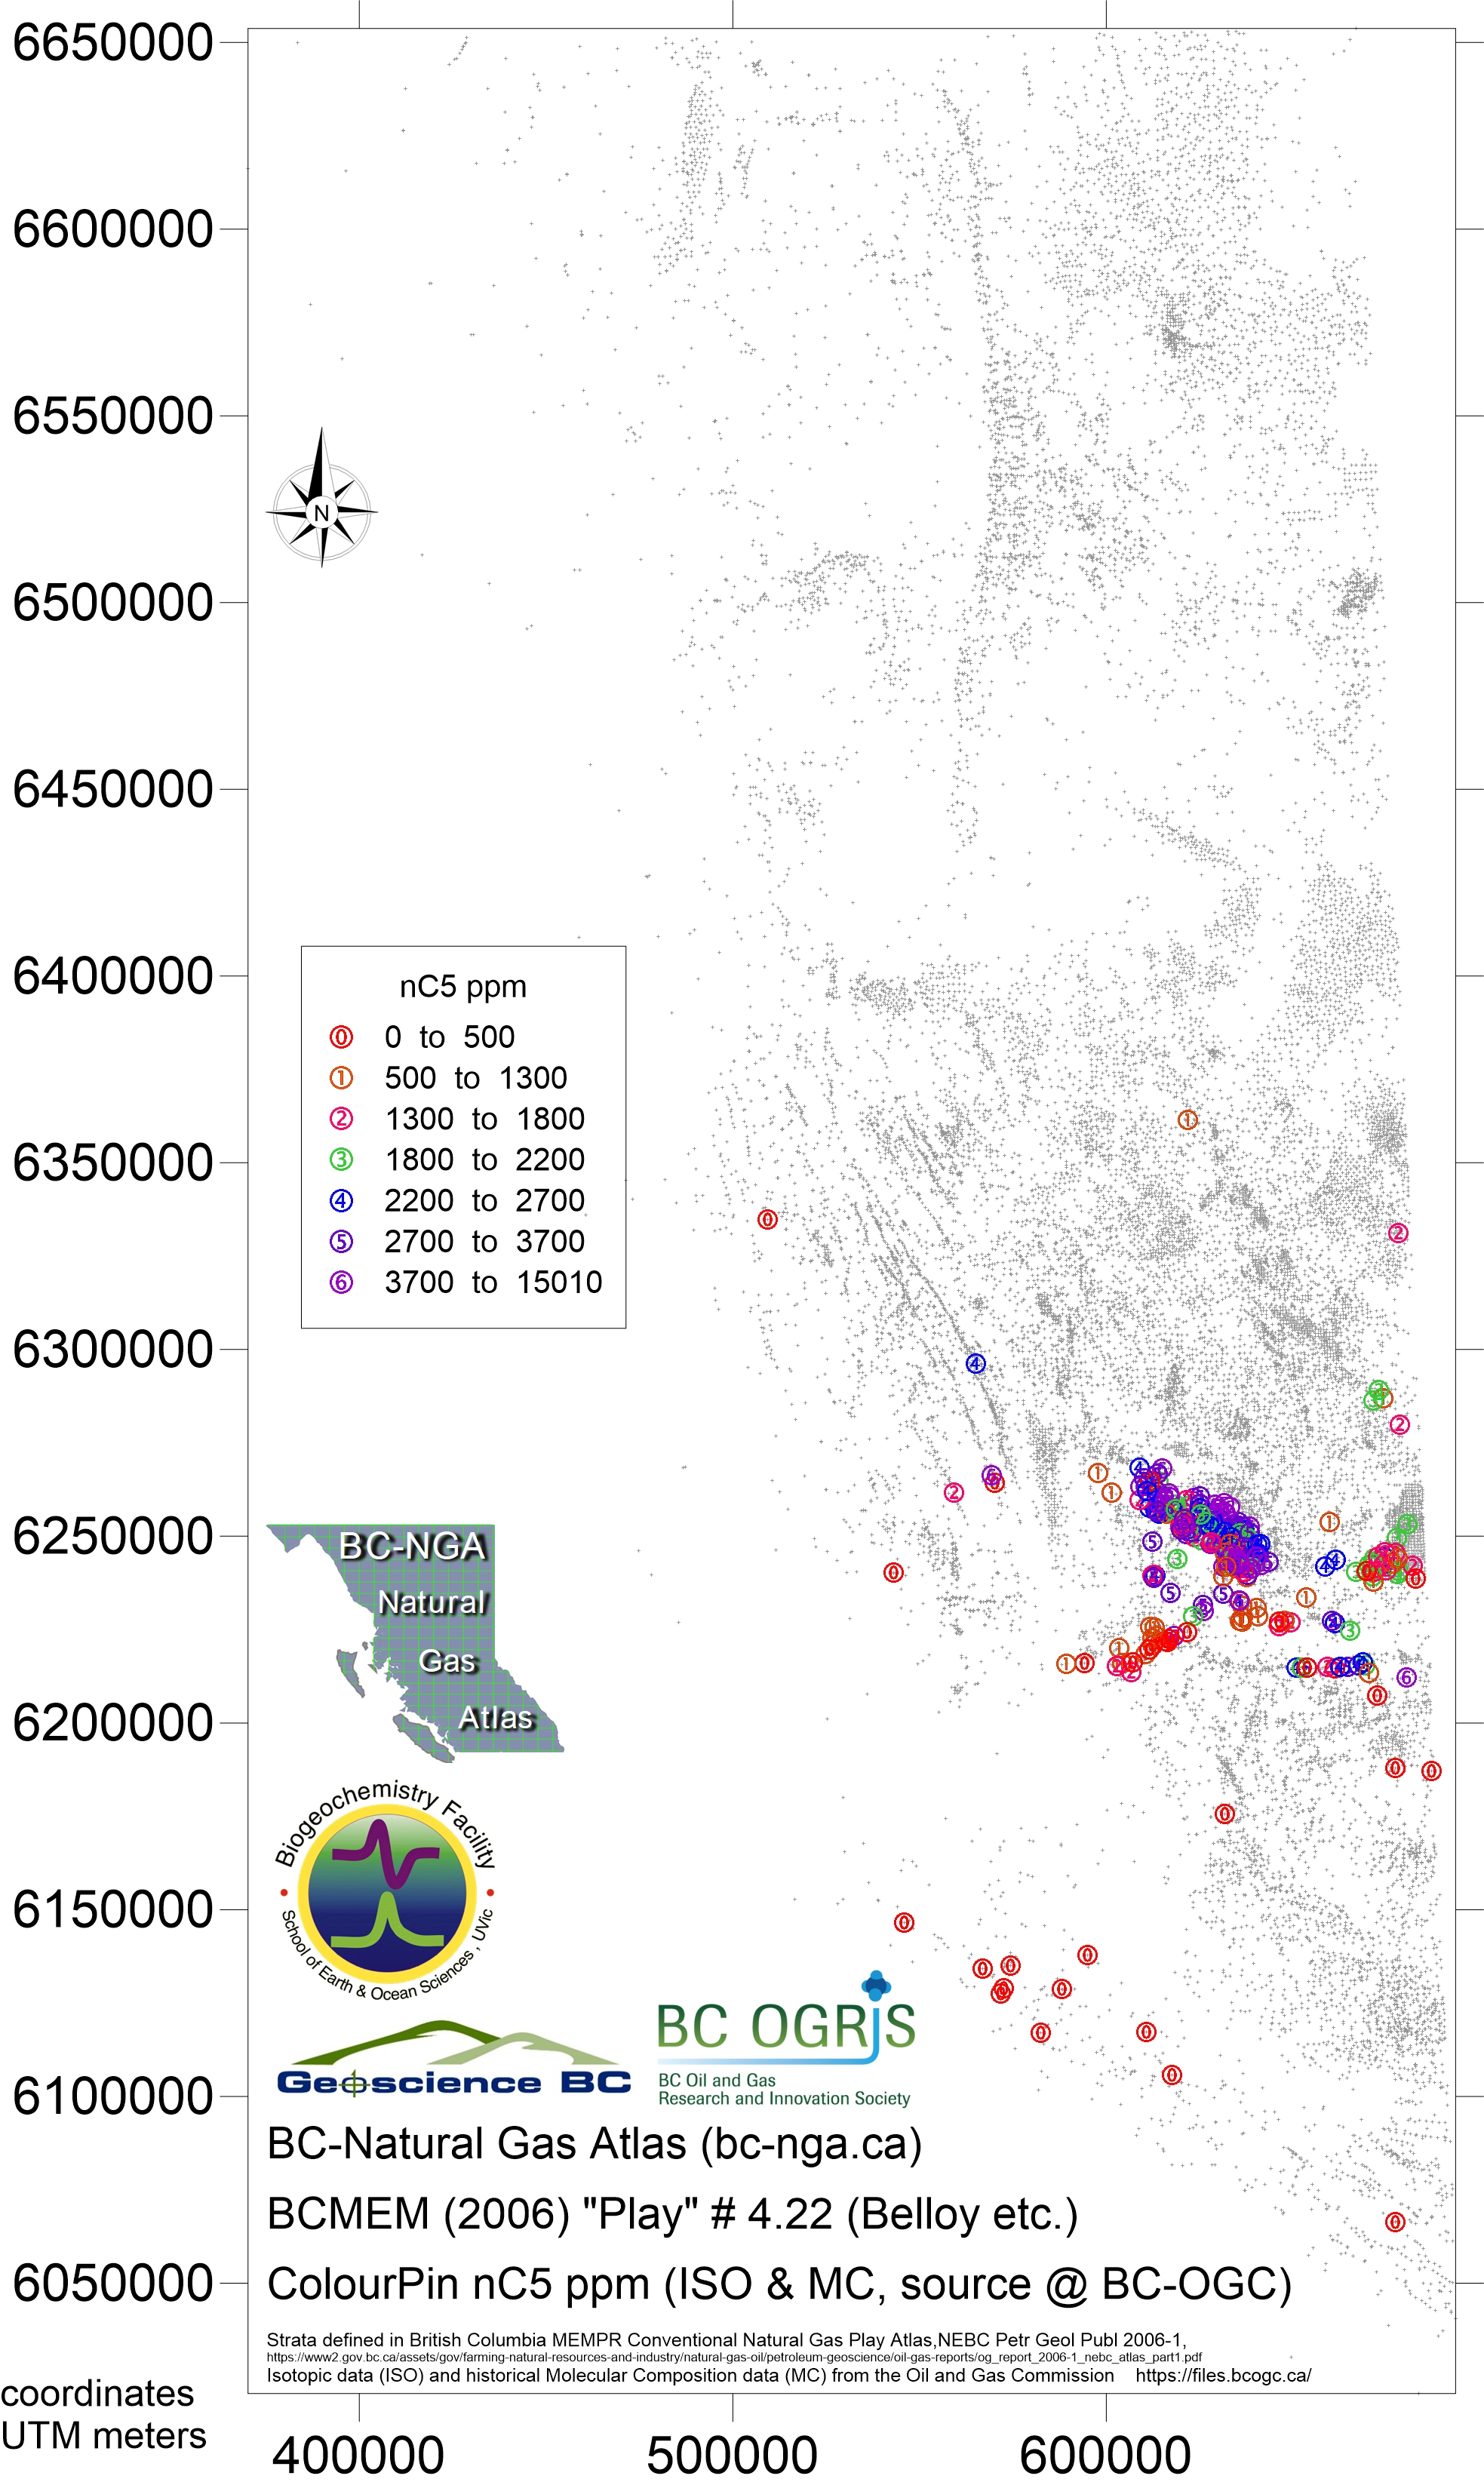
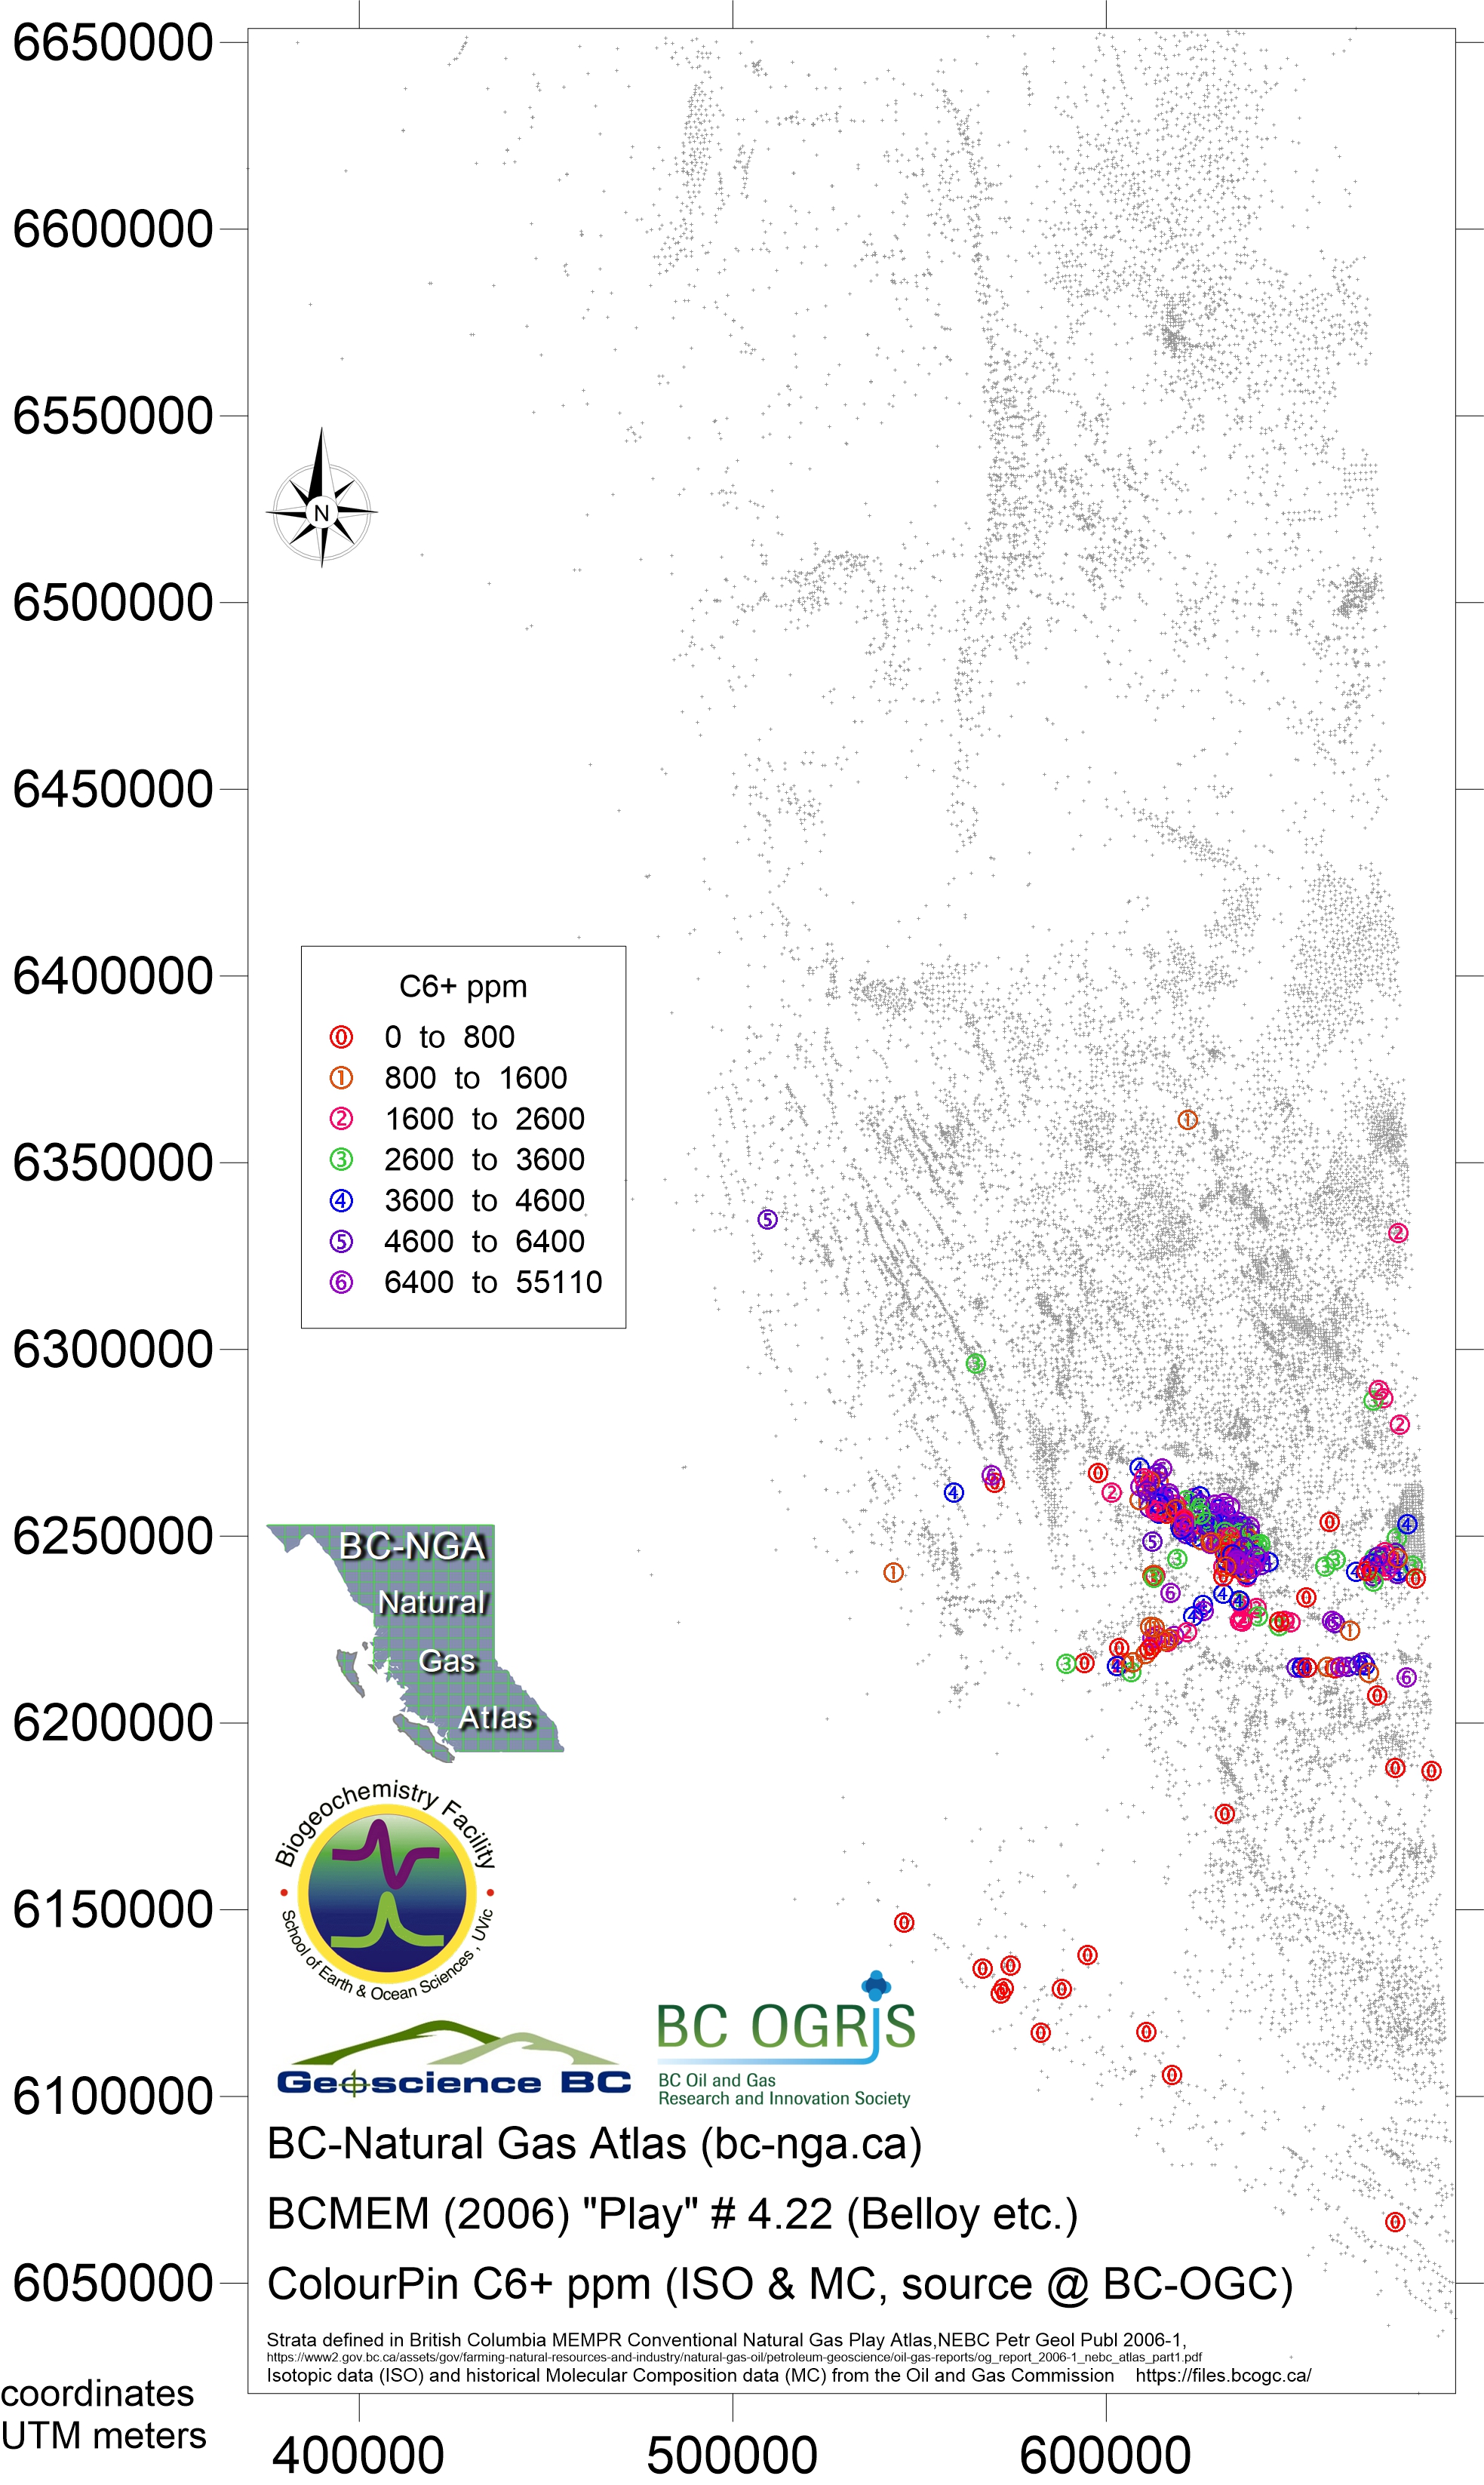
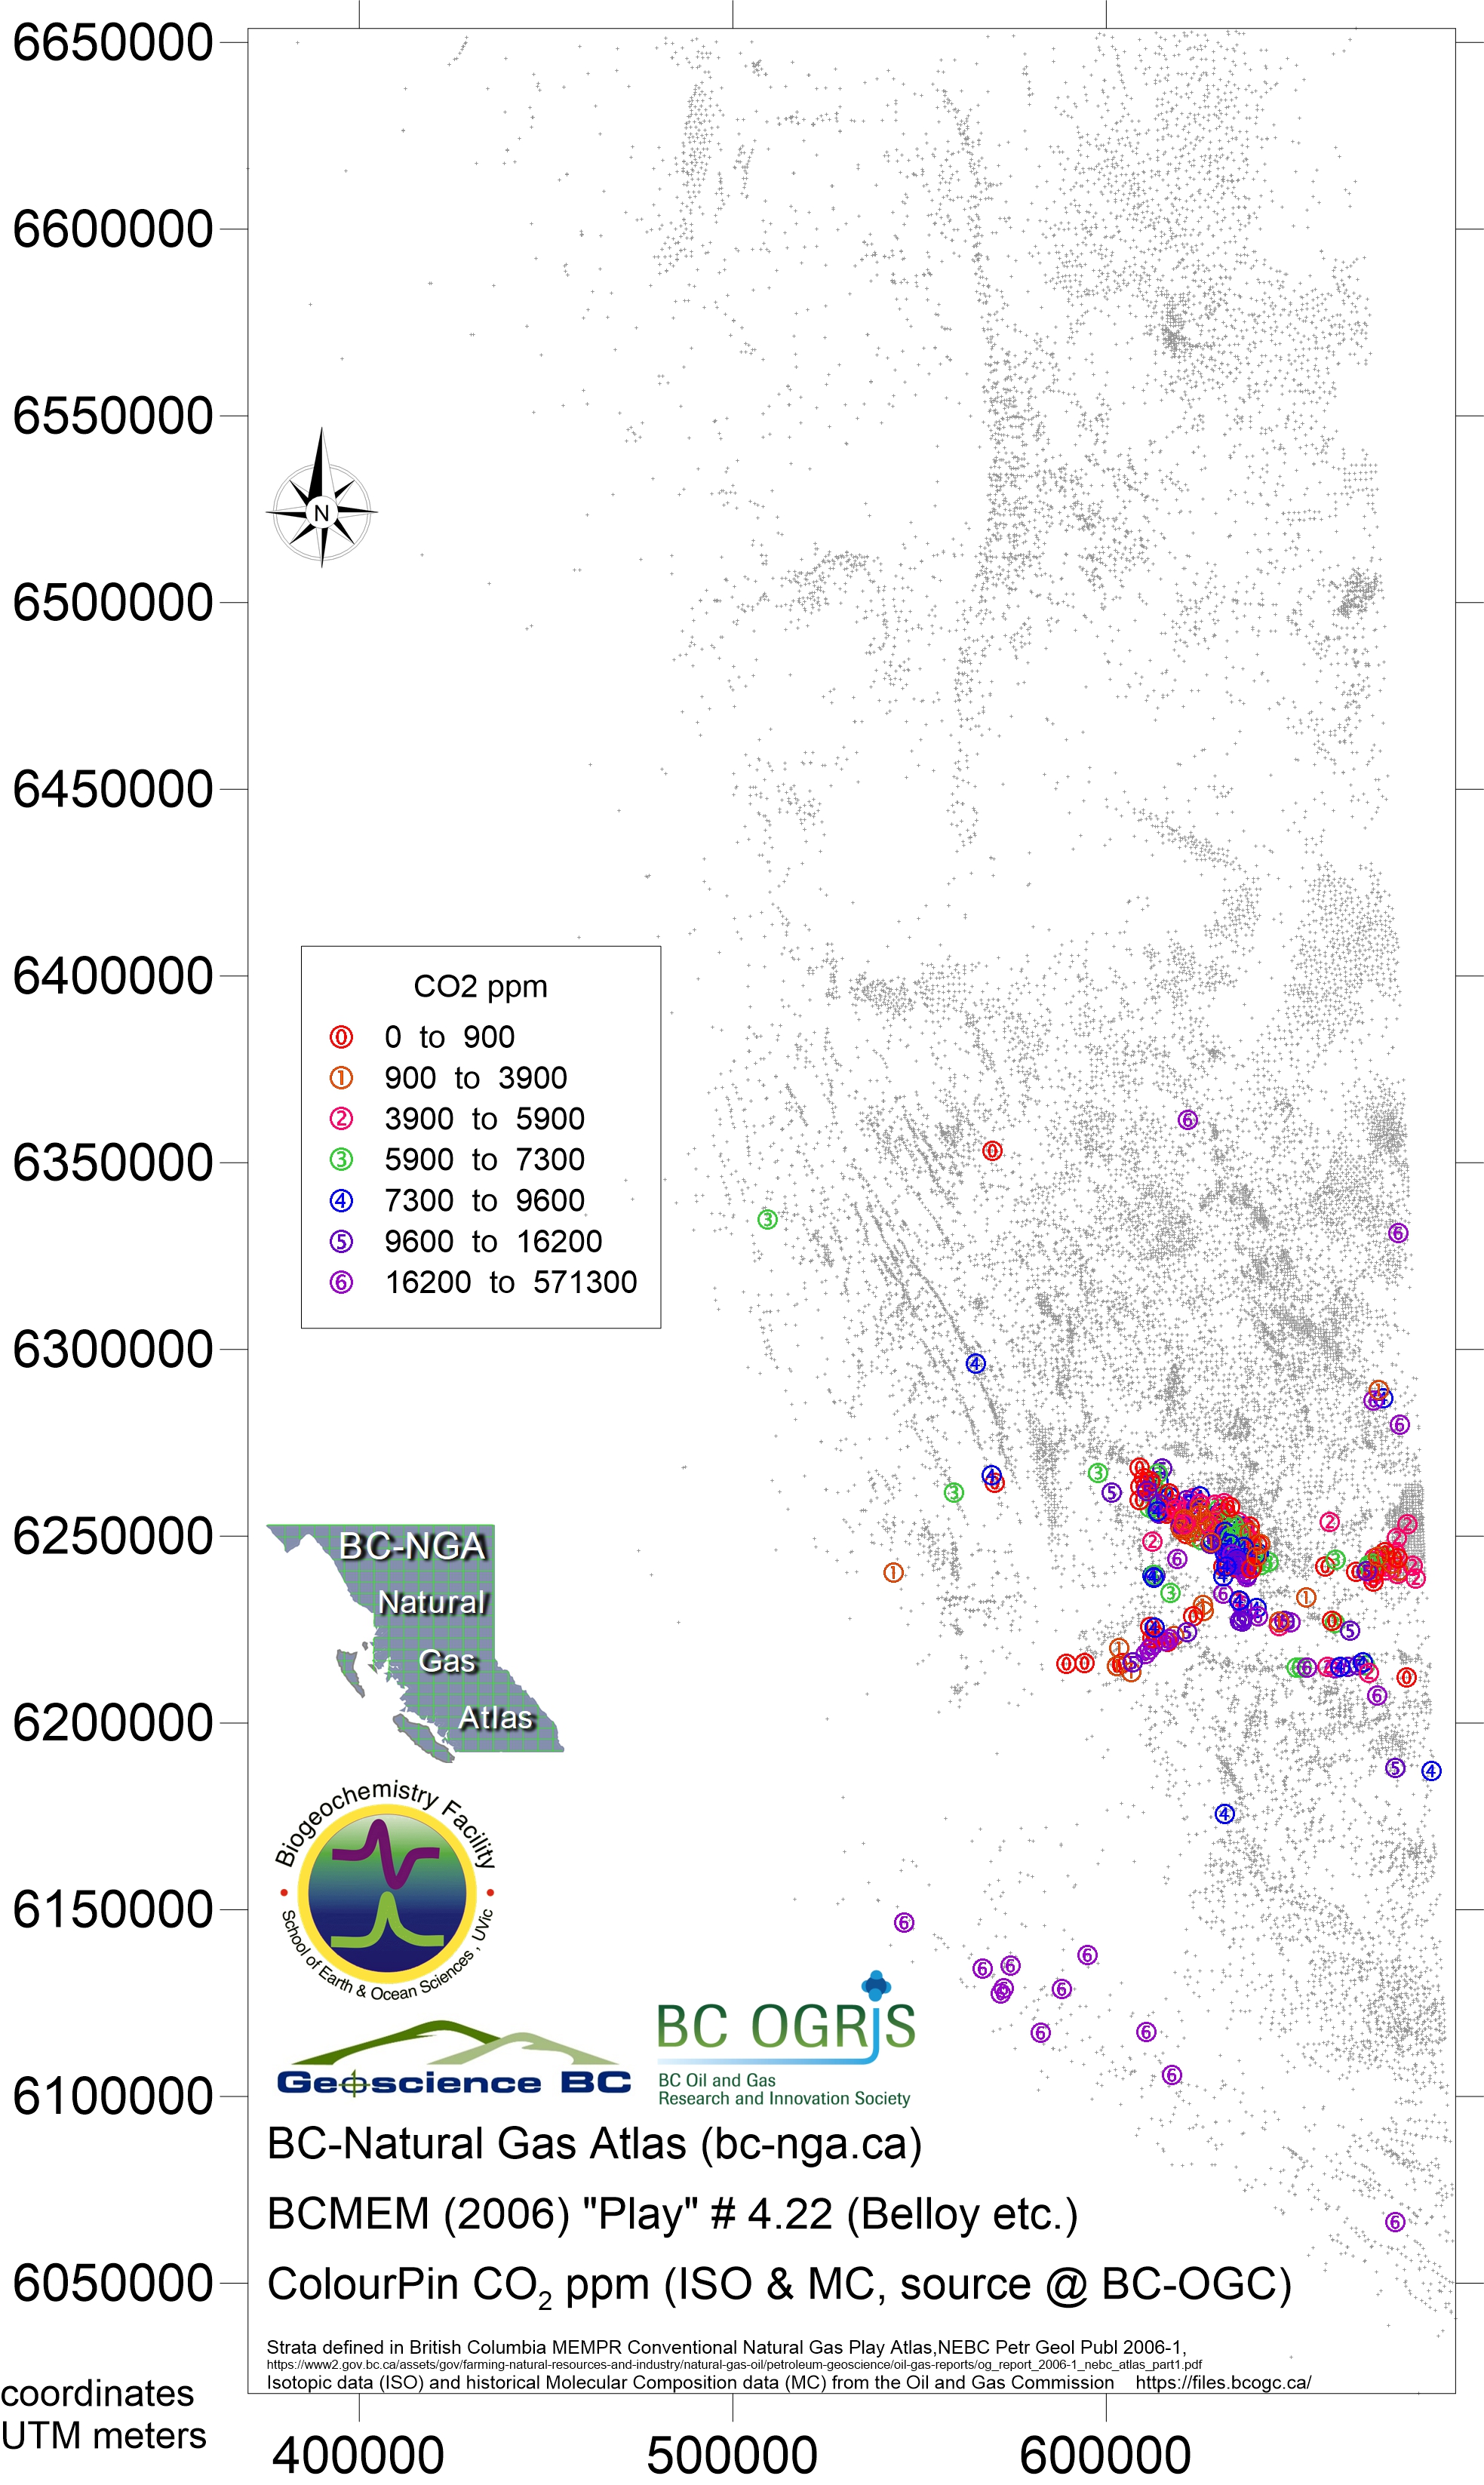
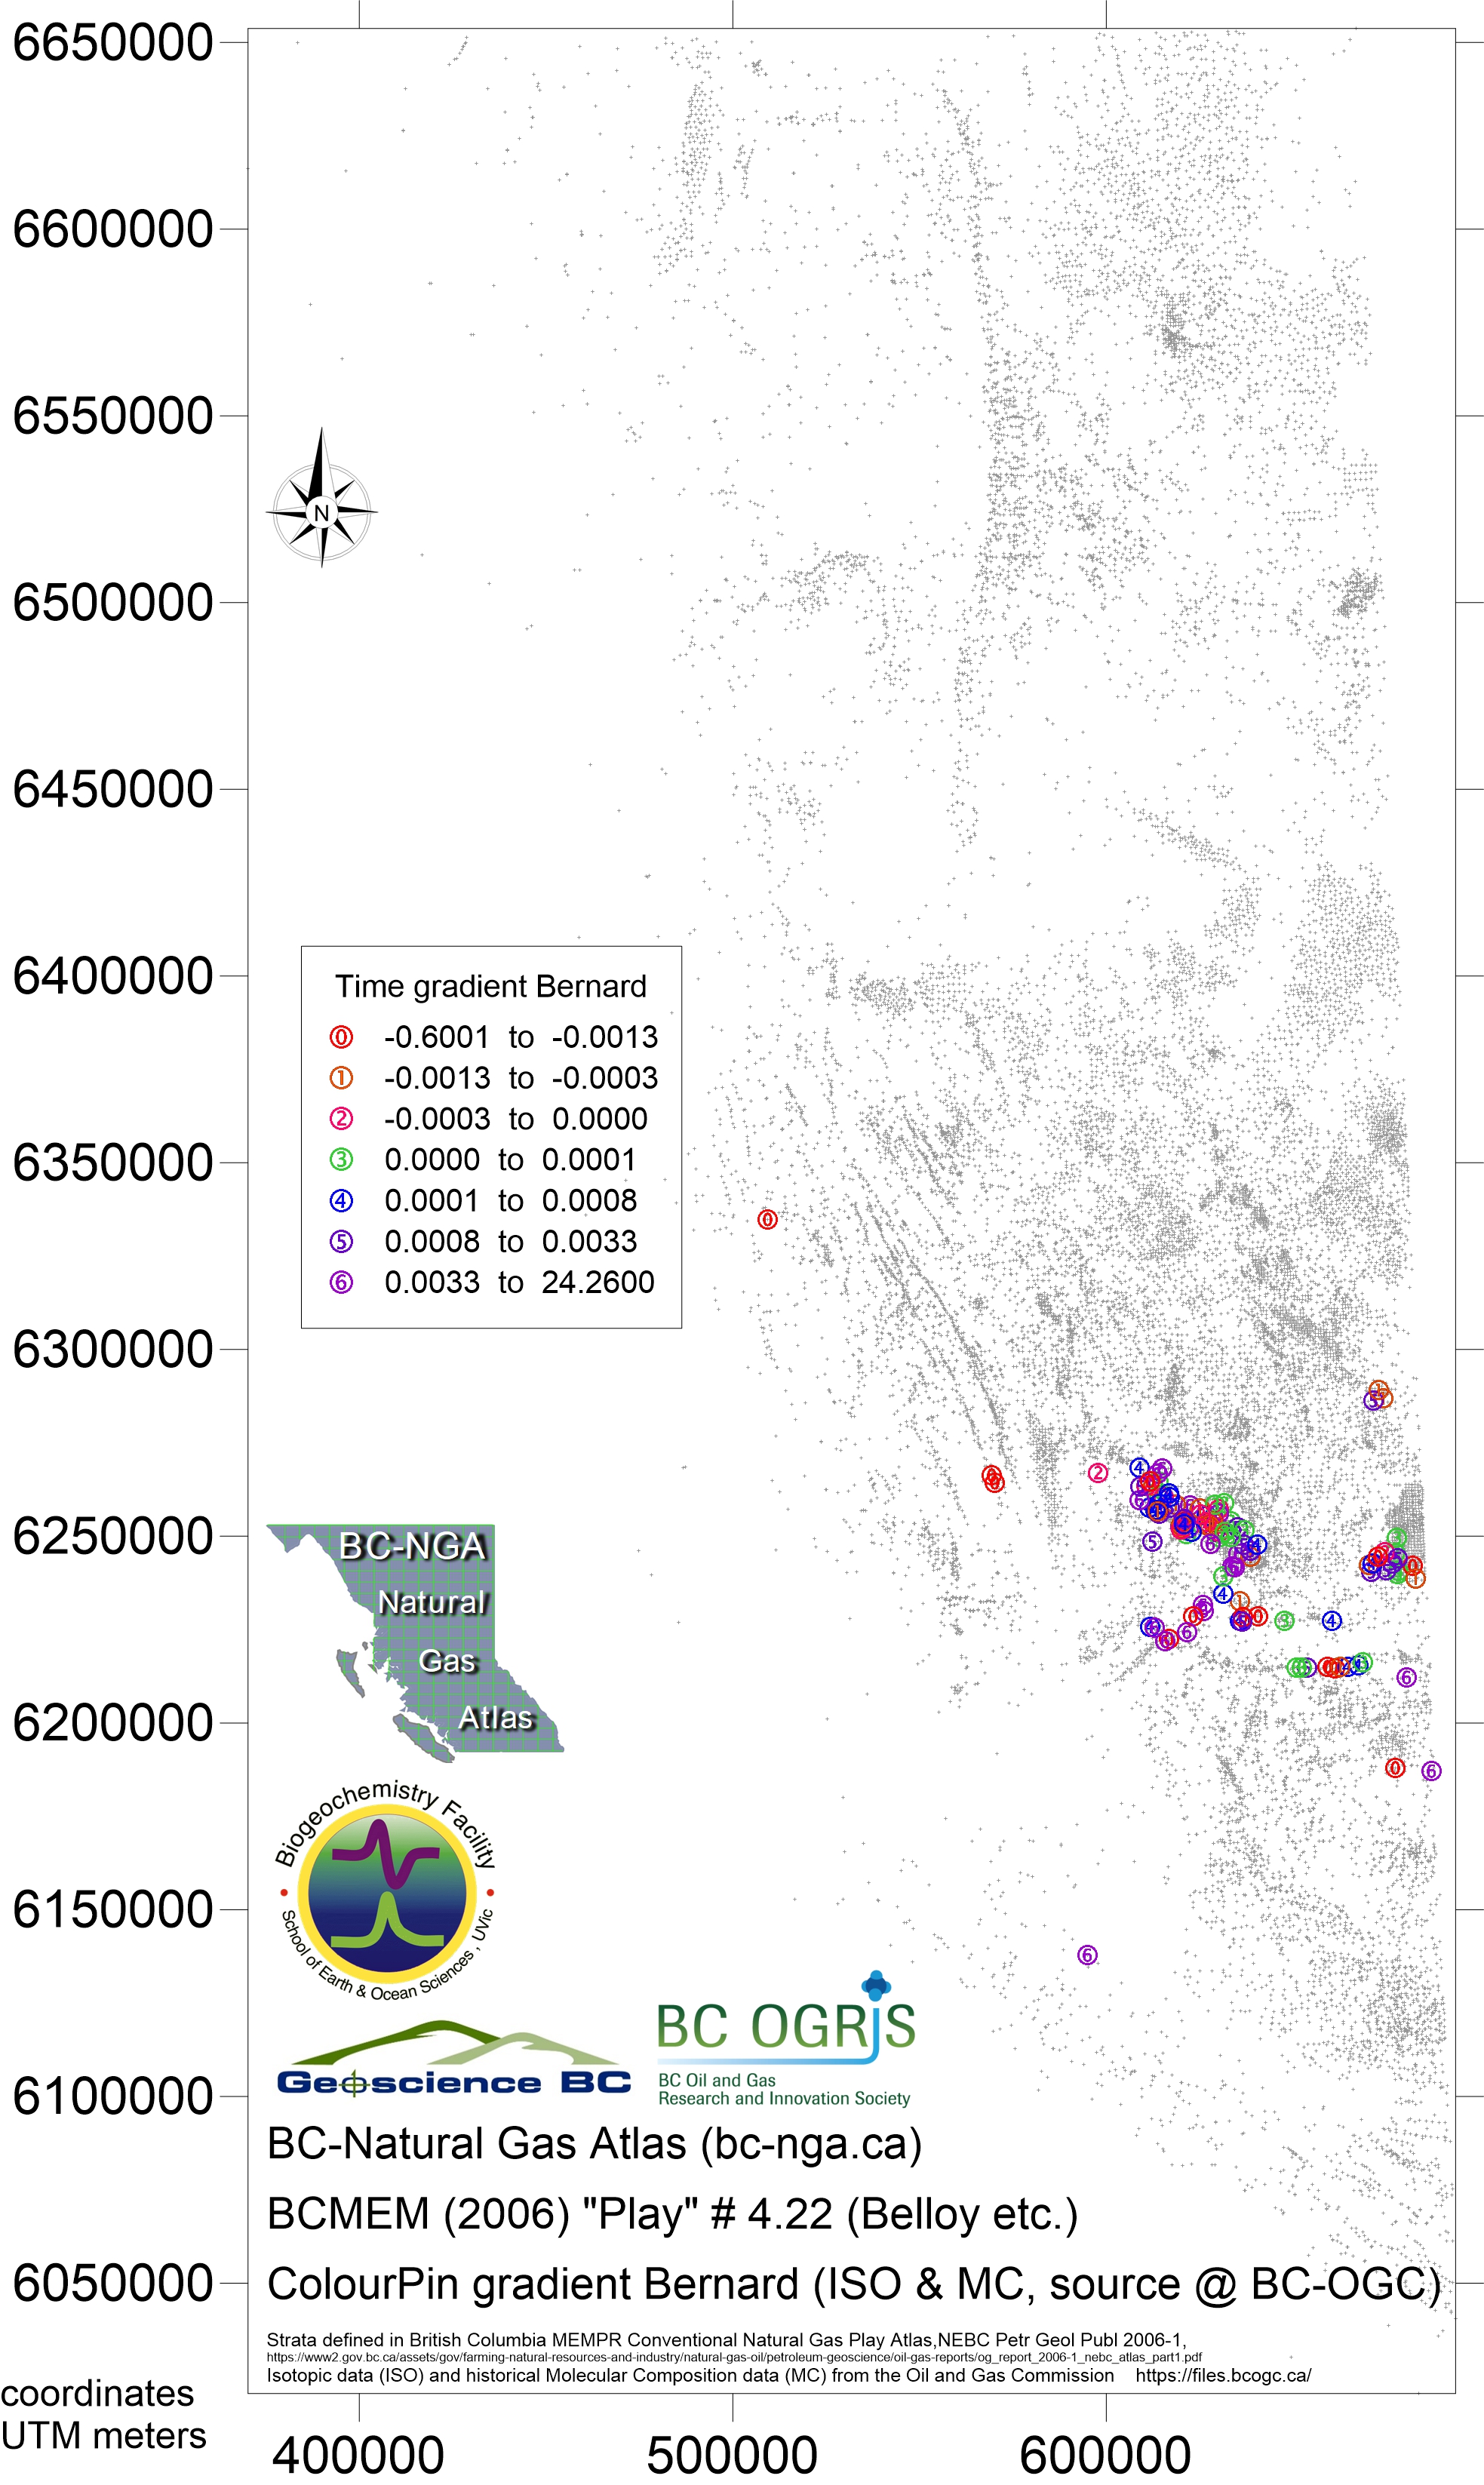
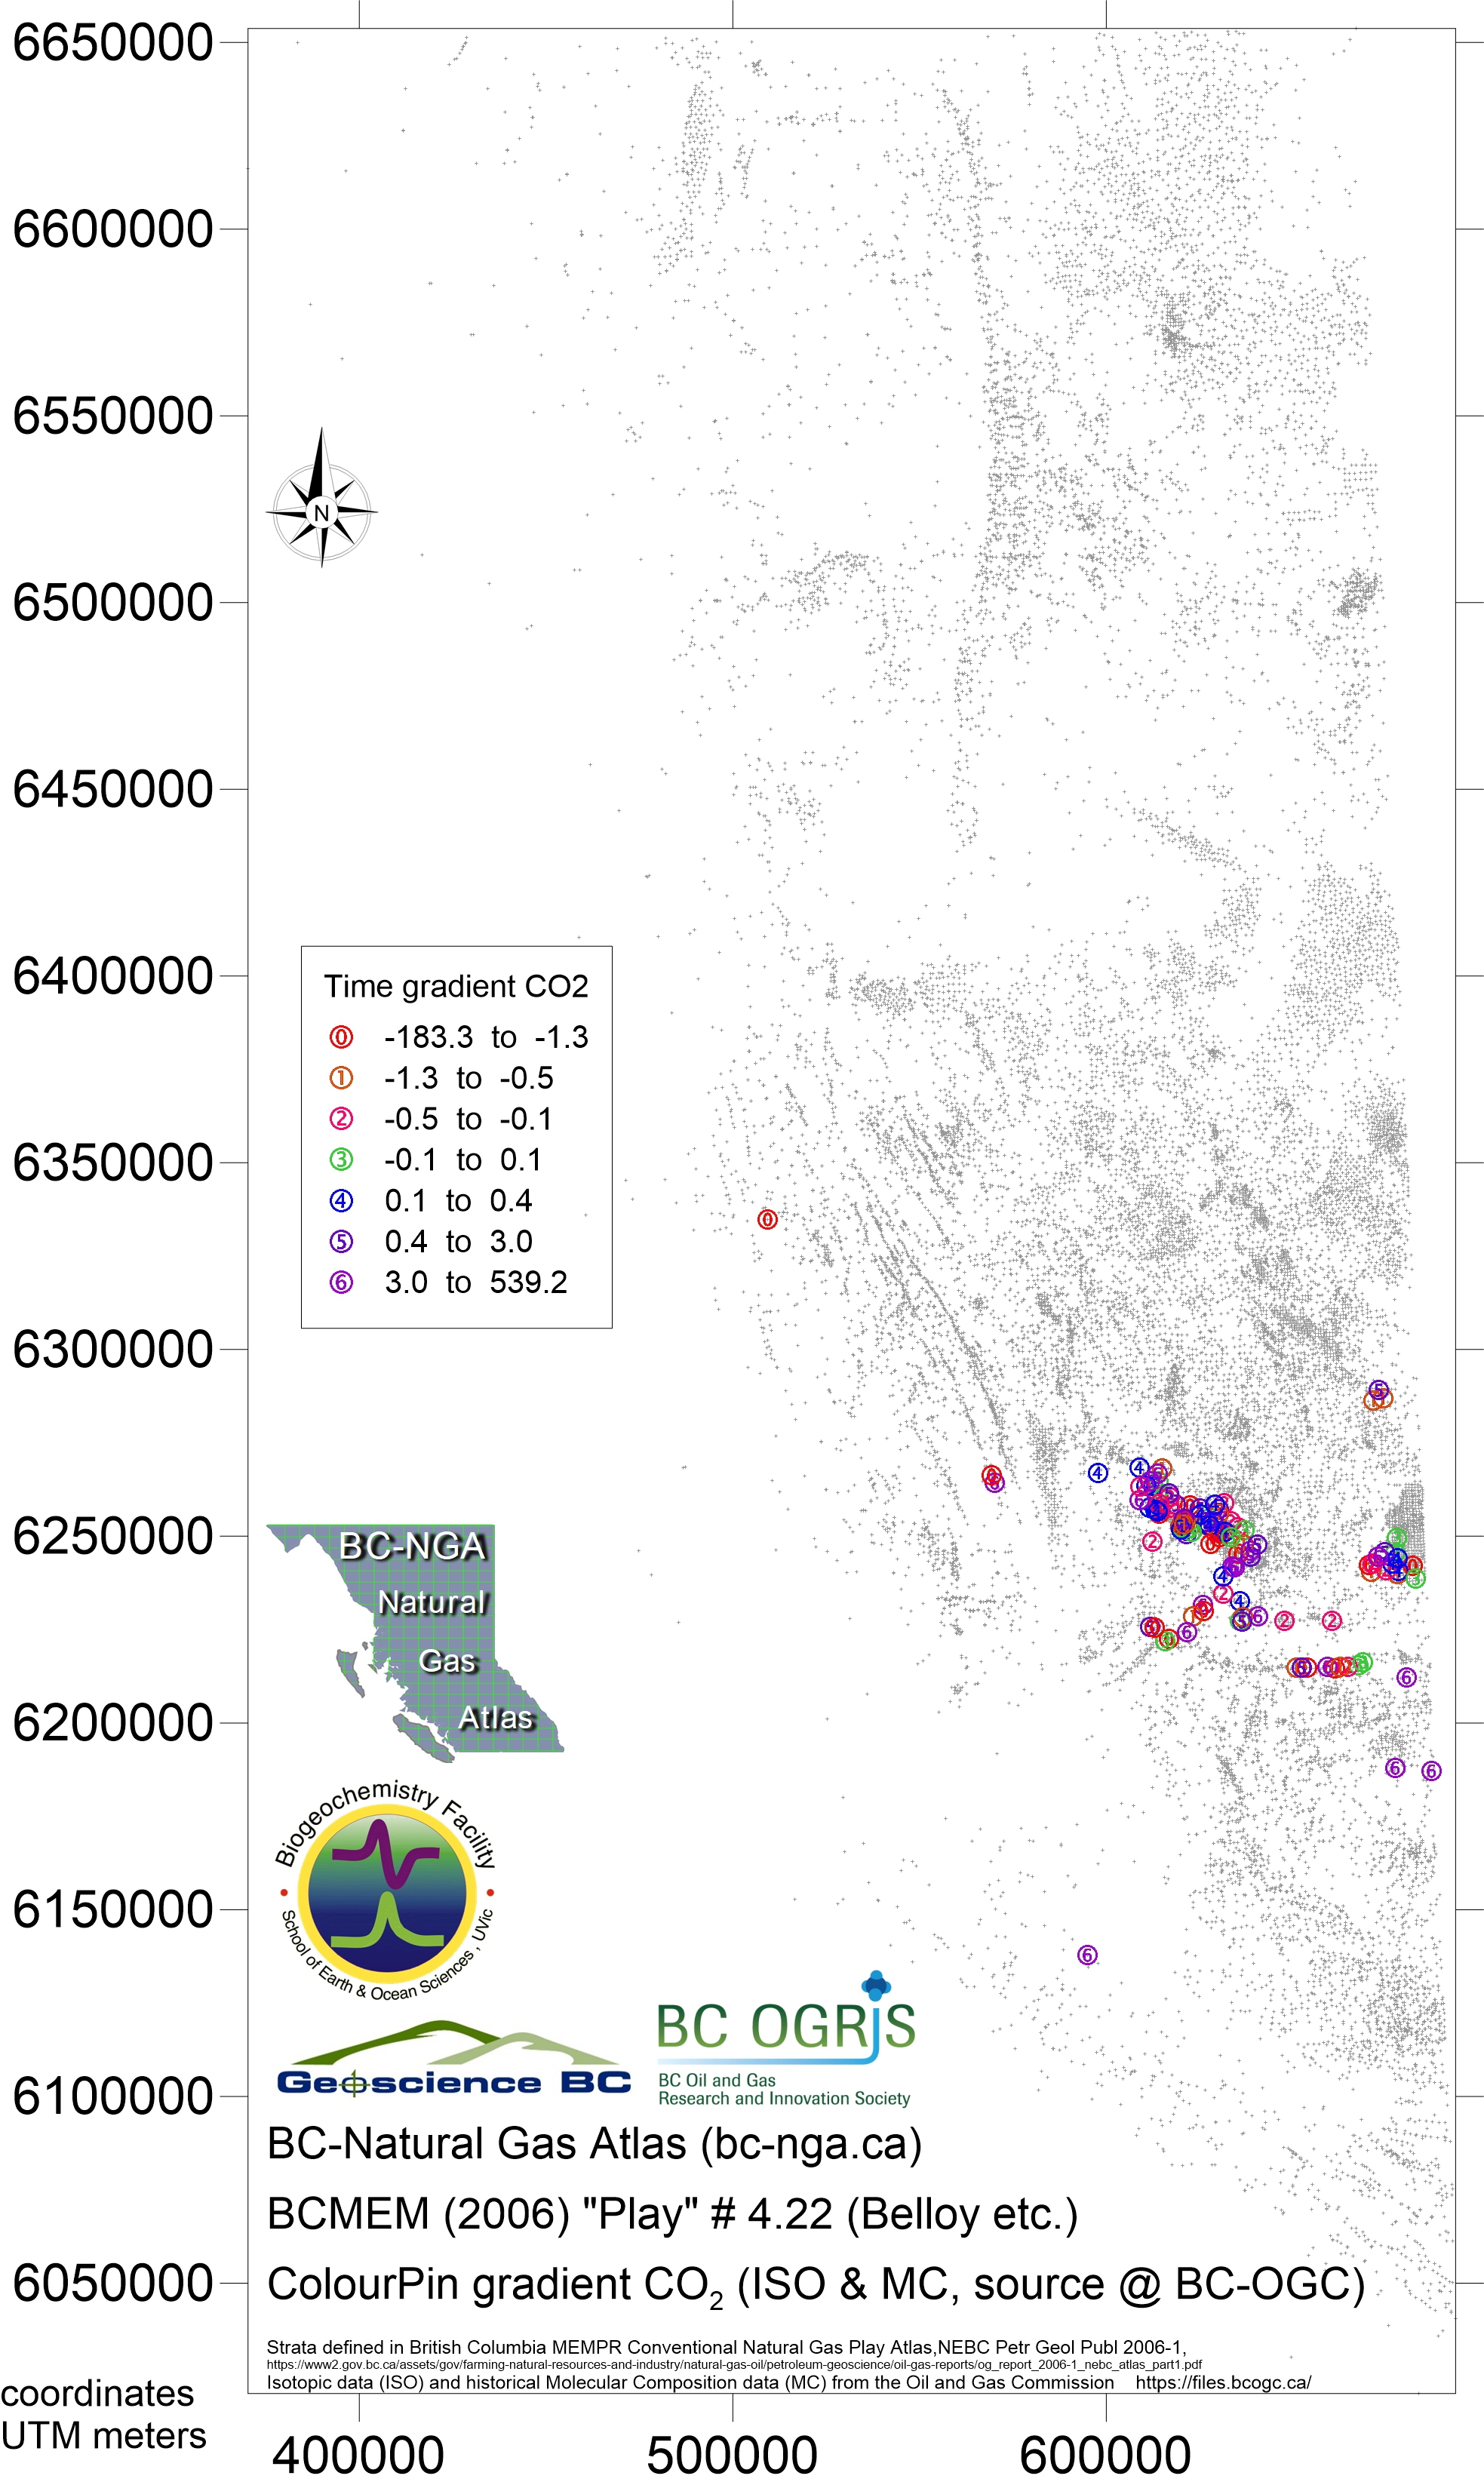
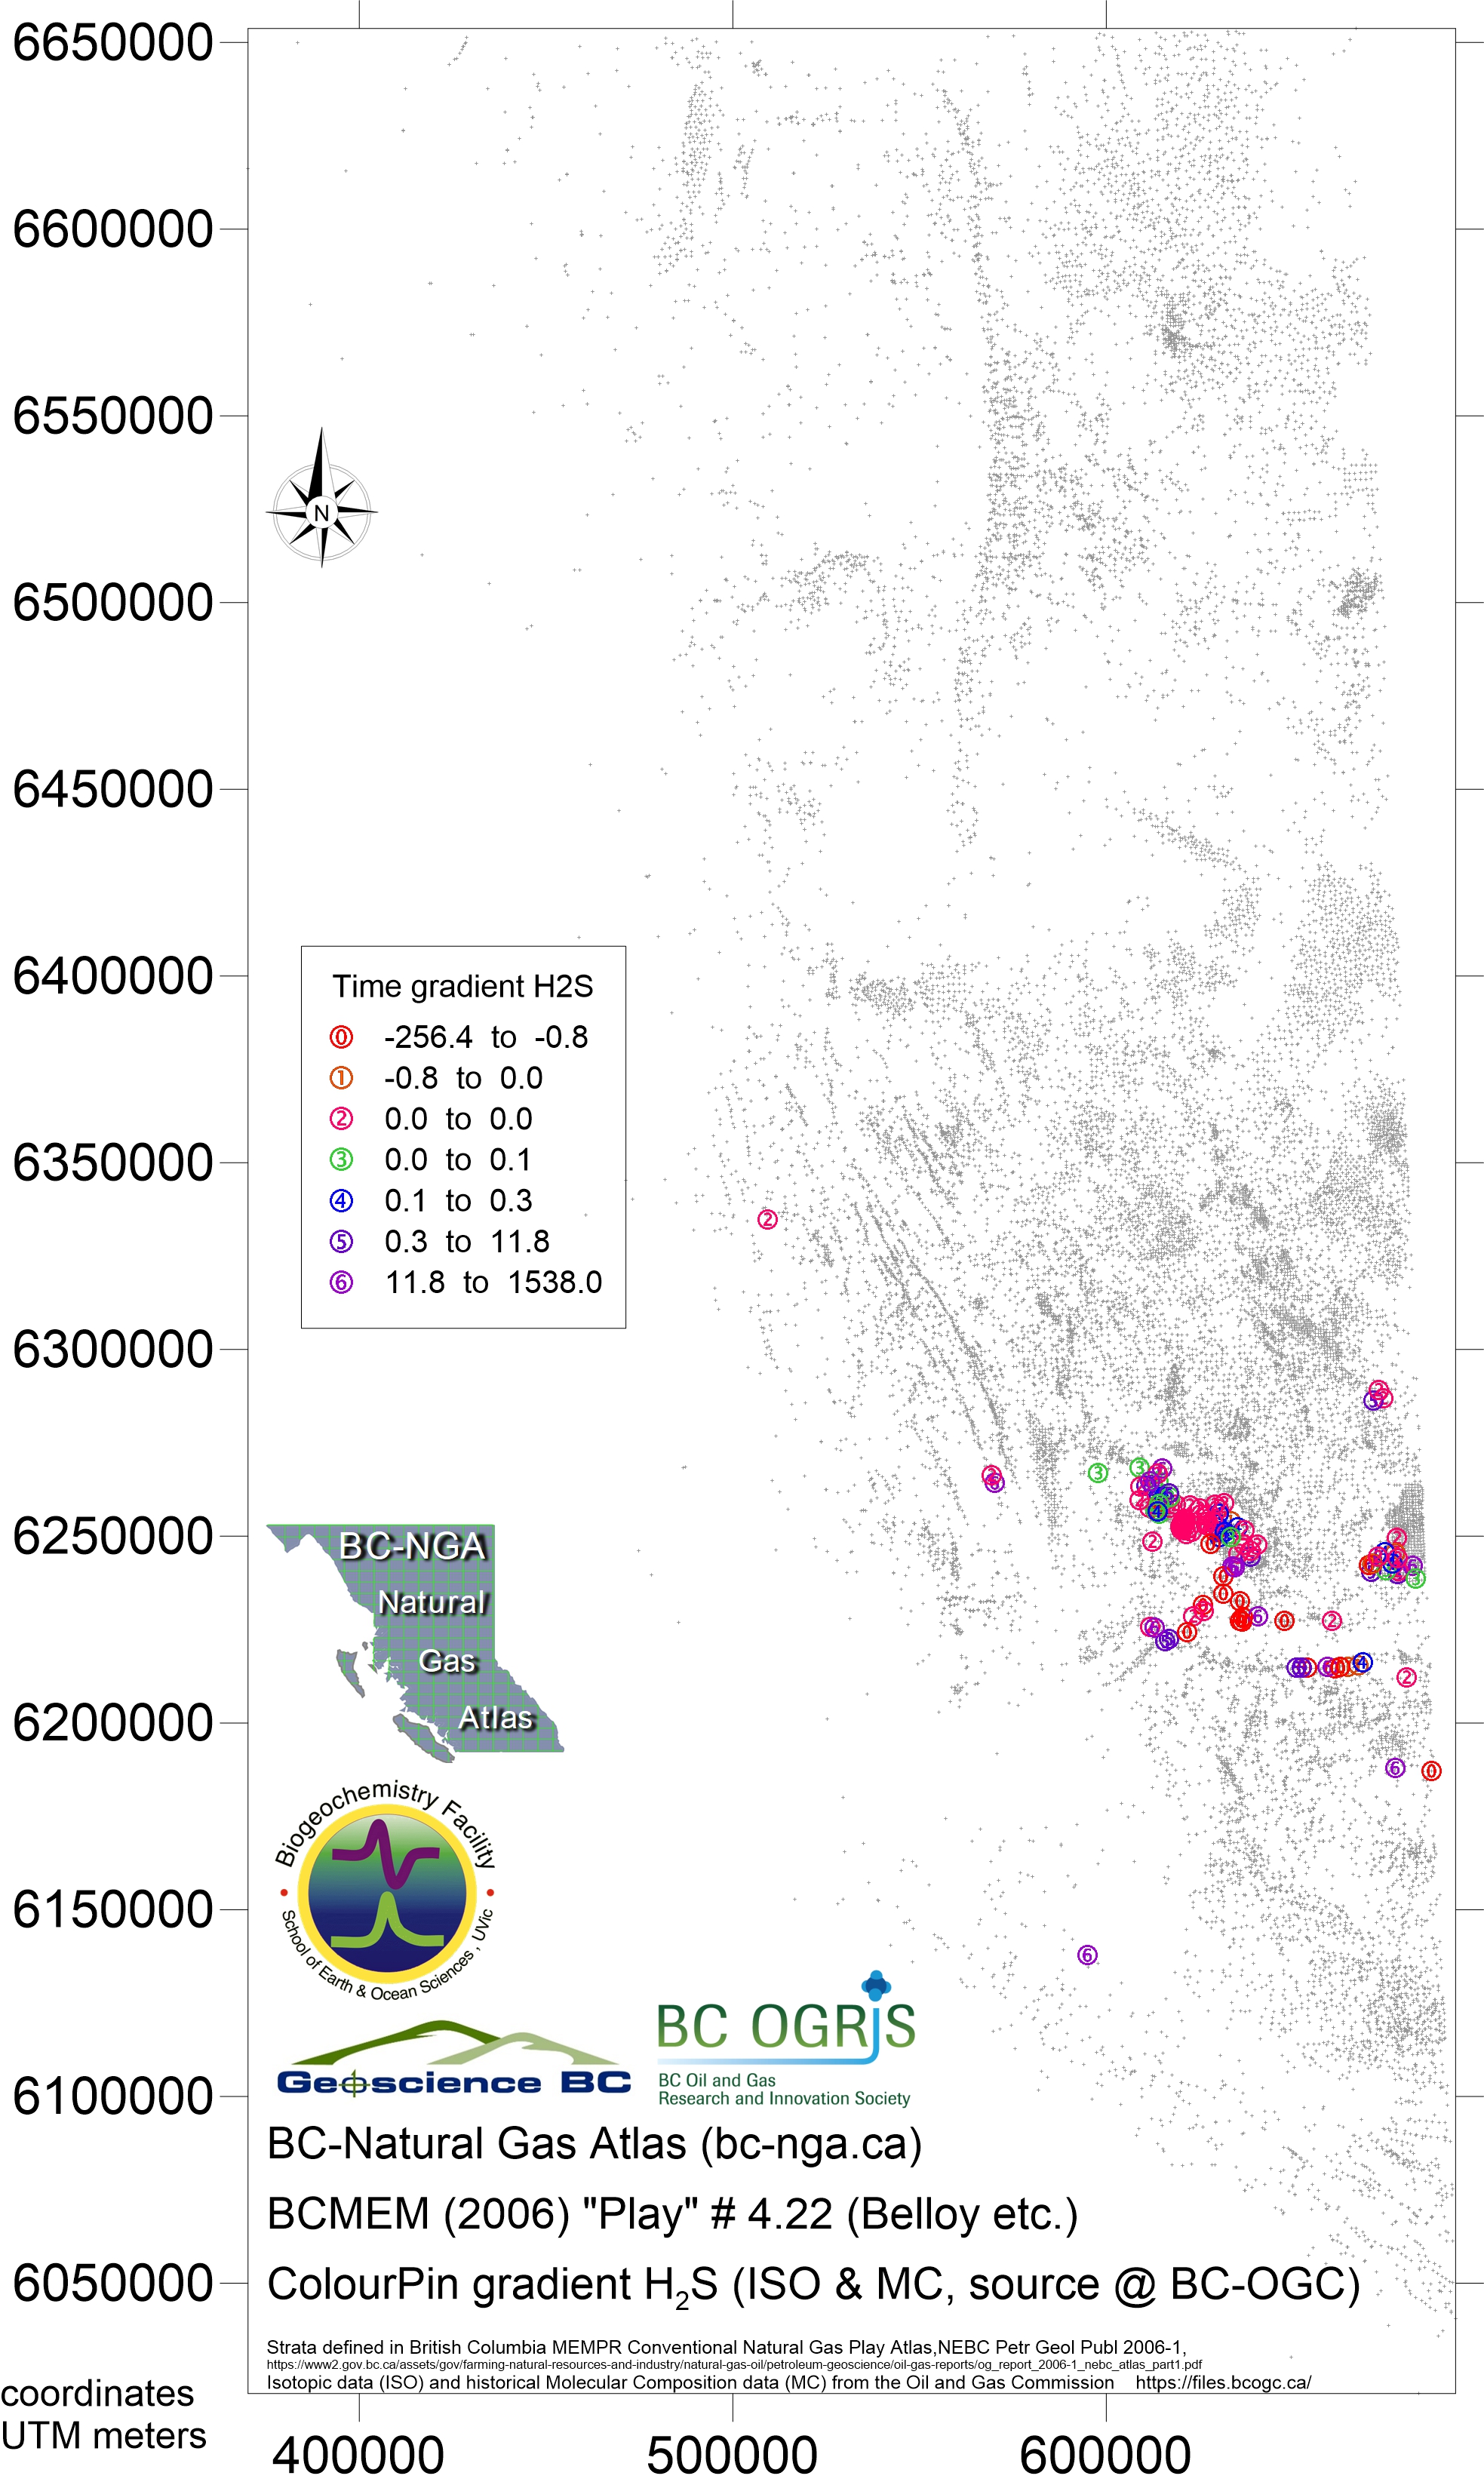
Play 4.22 Belloy / Taylor Flat / Fantasque Formations and equivalents
- Map230 Nov 2018 play 4.22 Belloy eqv Bernard ratio
- Map231 Nov 2018 play 4.22 Belloy eqv dryness ratio
- Map232 Nov 2018 play 4.22 Belloy eqv iC4nC4 ratio
- Map233 Nov 2018 play 4.22 Belloy eqv H2S ppm
- Map234 Nov 2018 play 4.22 Belloy eqv CH4 ppm
- Map235 Nov 2018 play 4.22 Belloy eqv C2H6 ppm
- Map236 Nov 2018 play 4.22 Belloy eqv C3H8 ppm
- Map237 Nov 2018 play 4.22 Belloy eqv iC4H10 ppm
- Map238 Nov 2018 play 4.22 Belloy eqv nC4H10 ppm
- Map239 Nov 2018 play 4.22 Belloy eqv iC5H12 ppm
- Map240 Nov 2018 play 4.22 Belloy eqv nC5H12 ppm
- Map241 Nov 2018 play 4.22 Belloy eqv C6H14 plus ppm
- Map242 Nov 2018 play 4.22 Belloy eqv CO2 ppm
- Map243 Nov 2018 play 4.22 Belloy eqv time series gradient Bernard ratio
- Map244 Nov 2018 play 4.22 Belloy eqv time series gradient CO2
- Map245 Nov 2018 play 4.22 Belloy eqv time series gradient H2S
- Map246 Nov 2018 play 4.22 Belloy eqv time series start point Bernard ratio
- Map247 Nov 2018 play 4.22 Belloy eqv time series start point CO2
- Map248 Nov 2018 play 4.22 Belloy eqv time series start point H2S
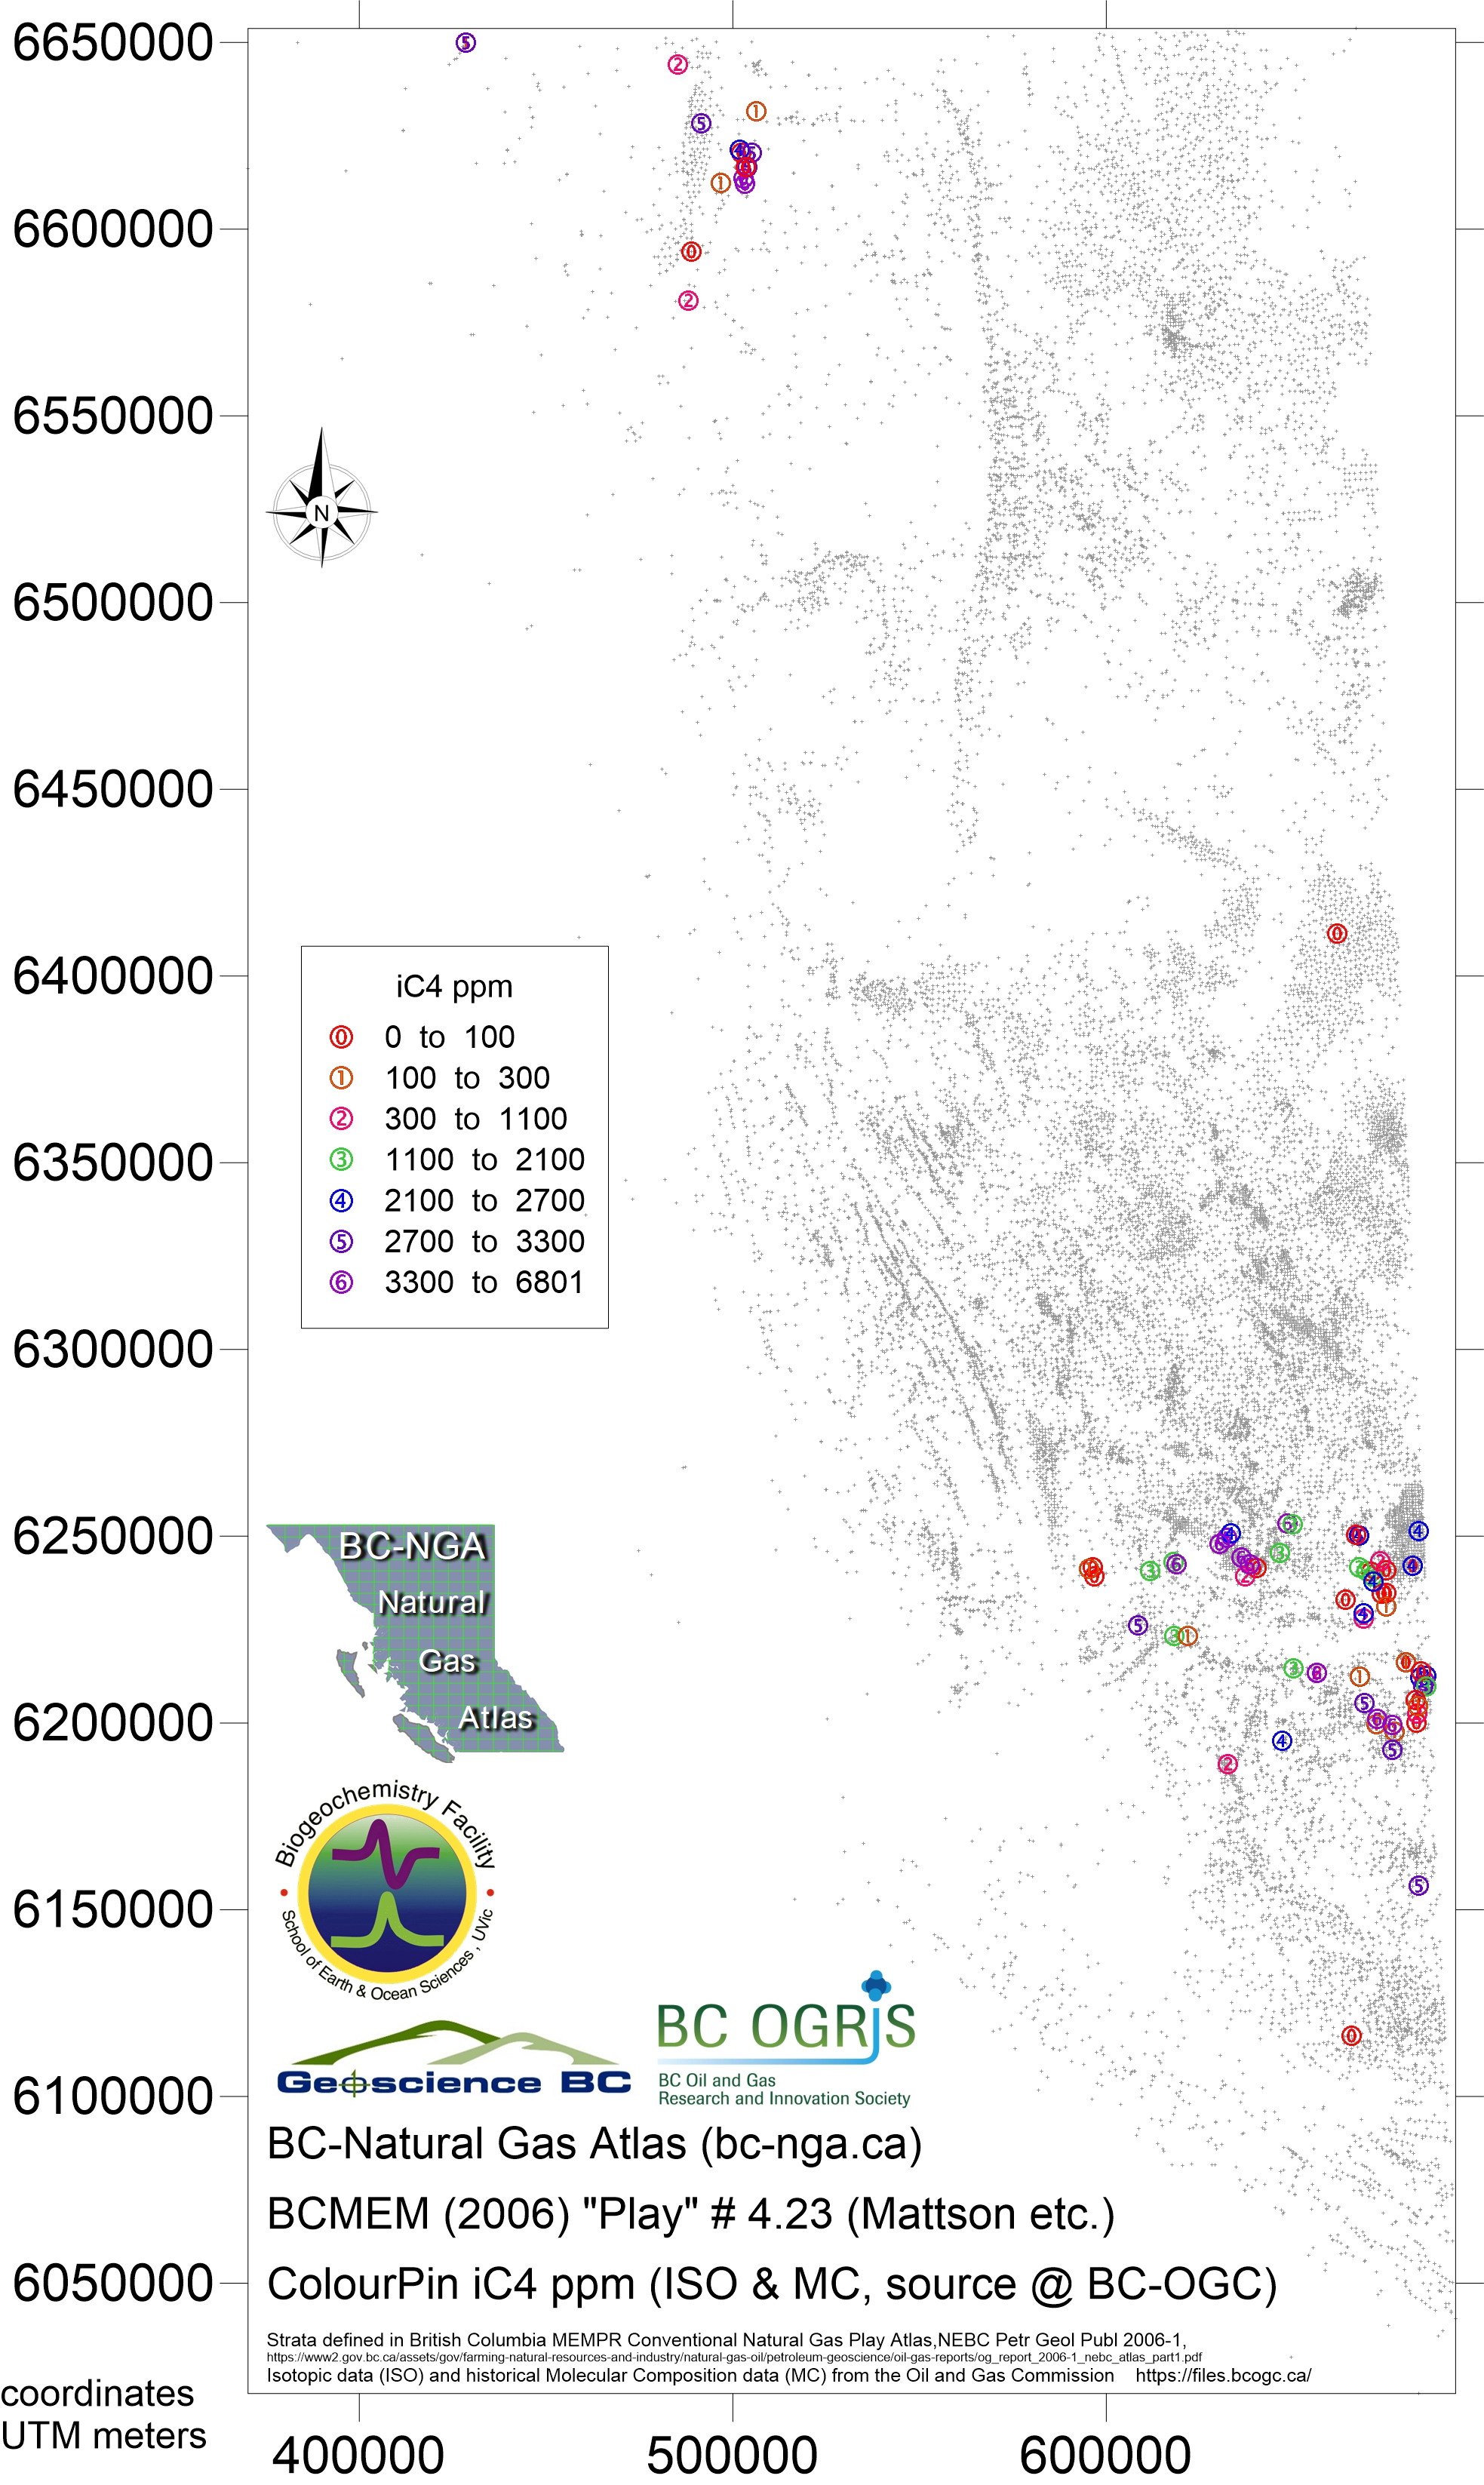
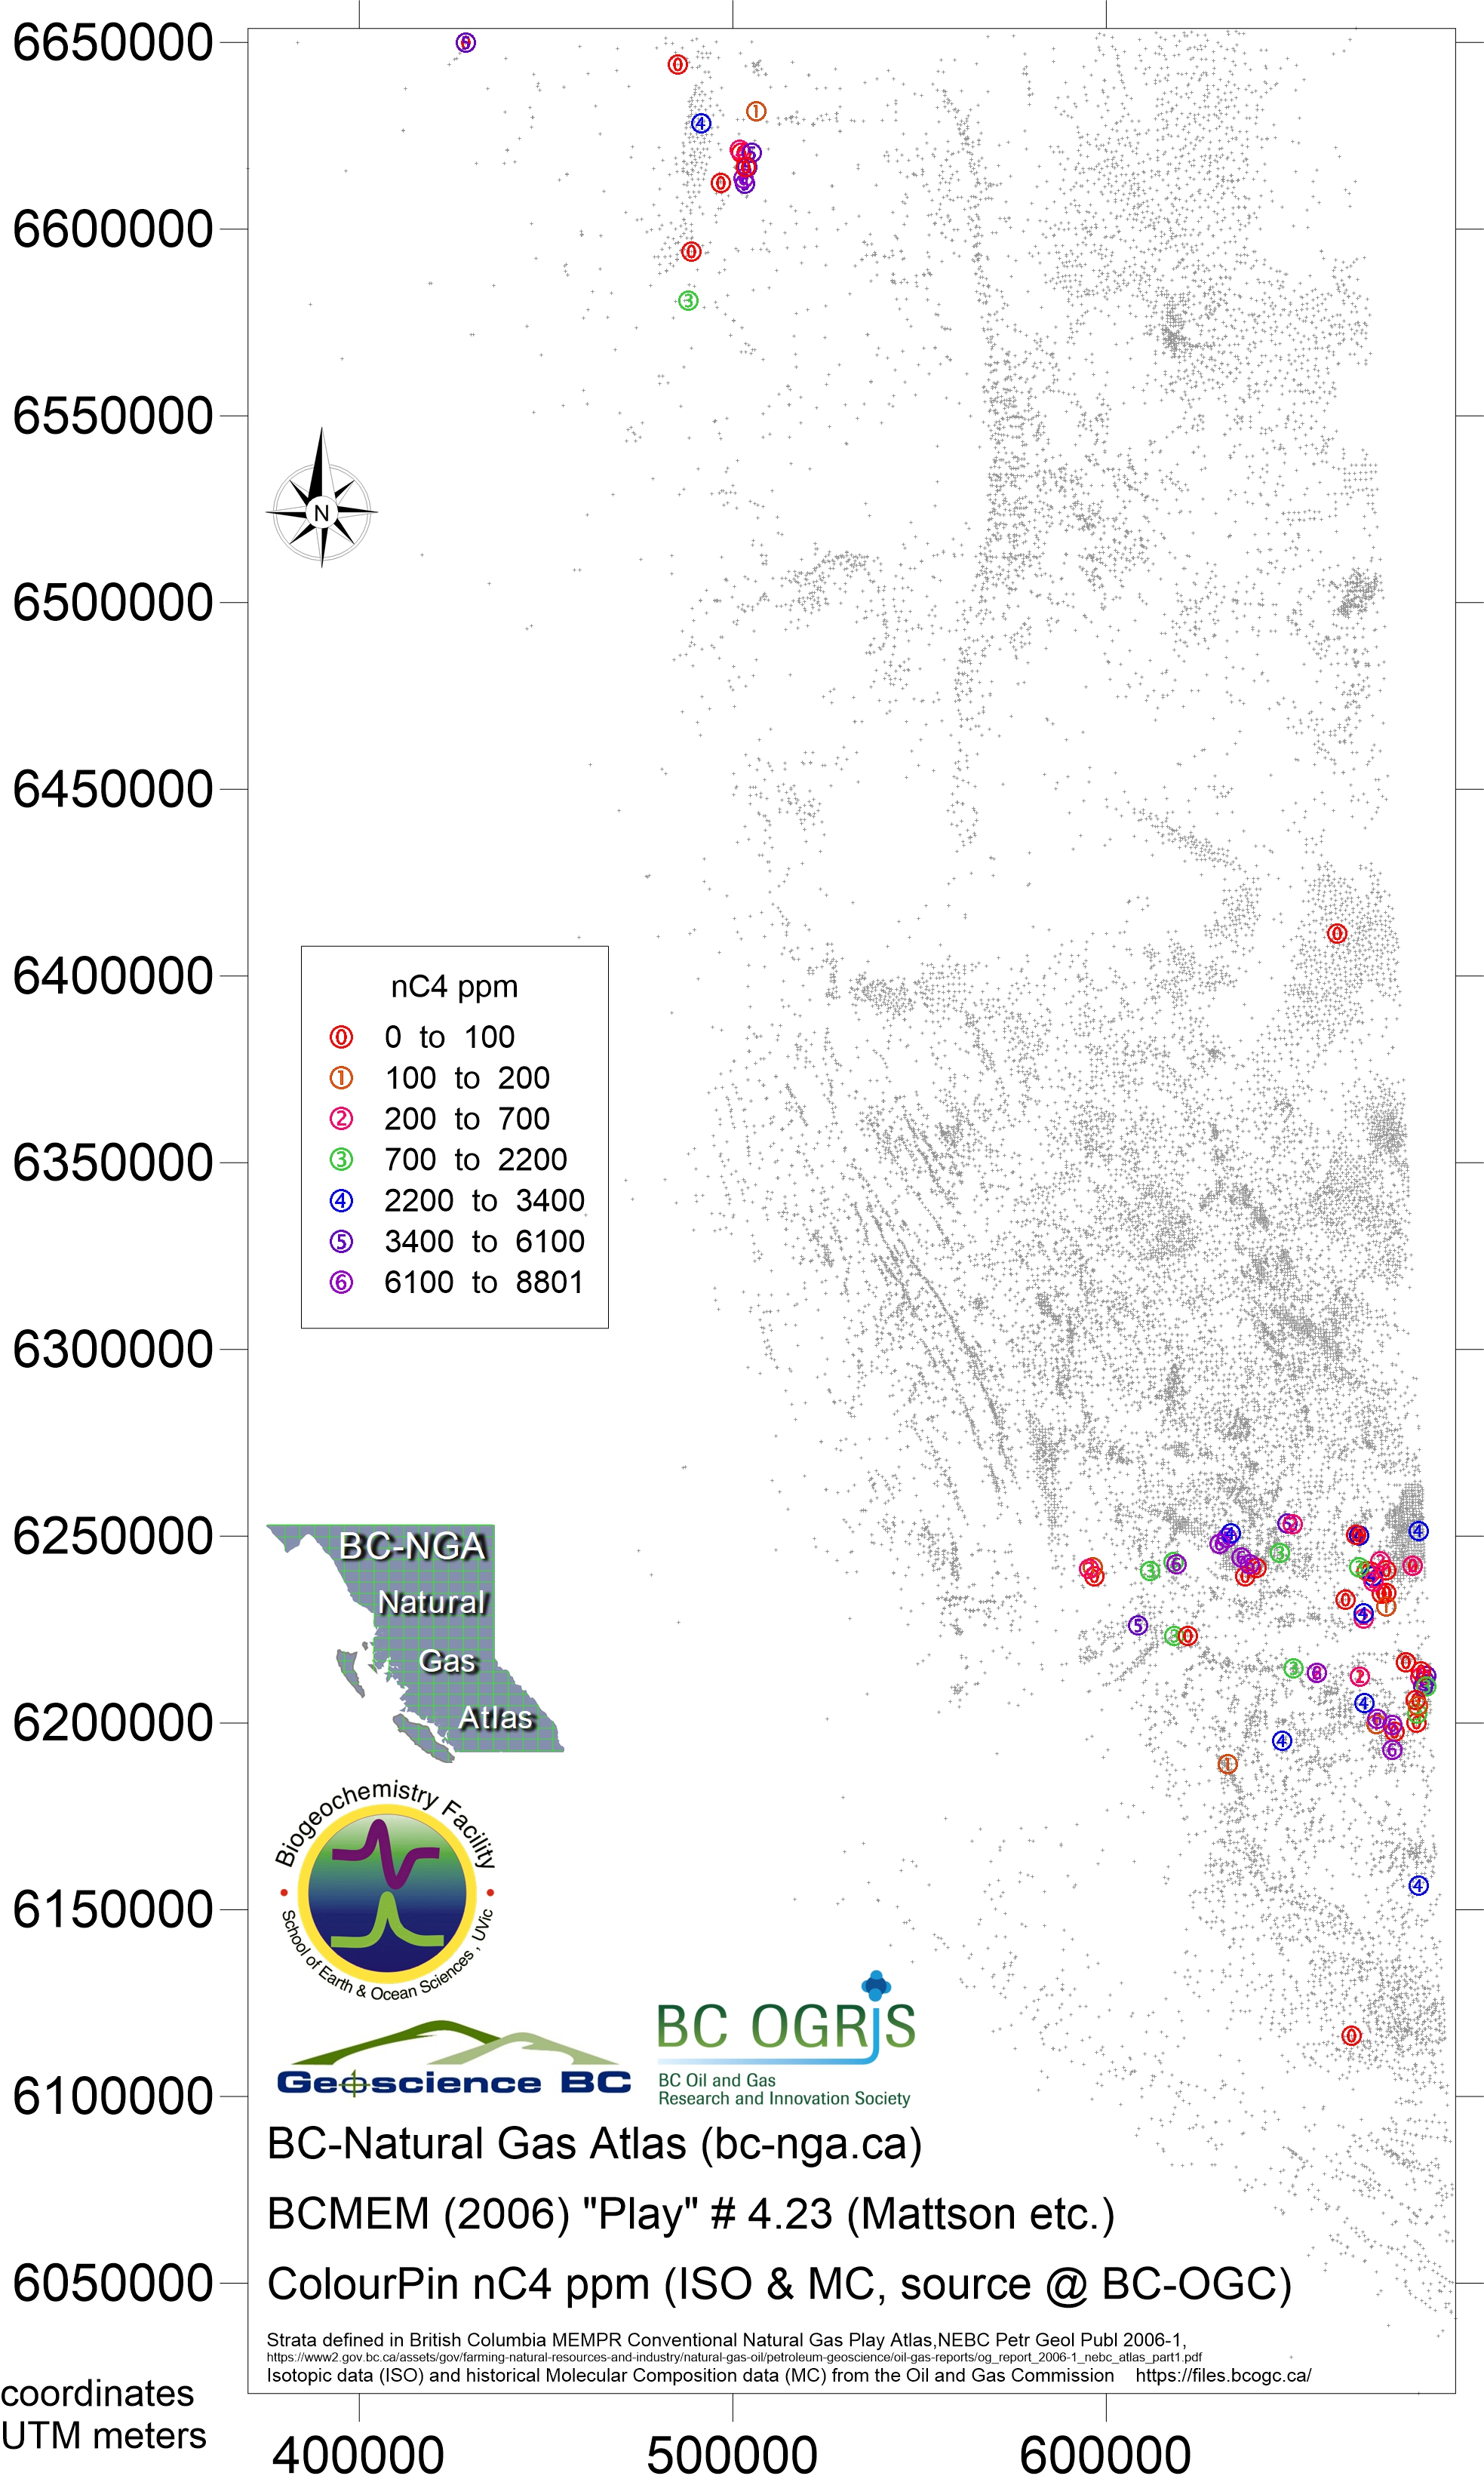
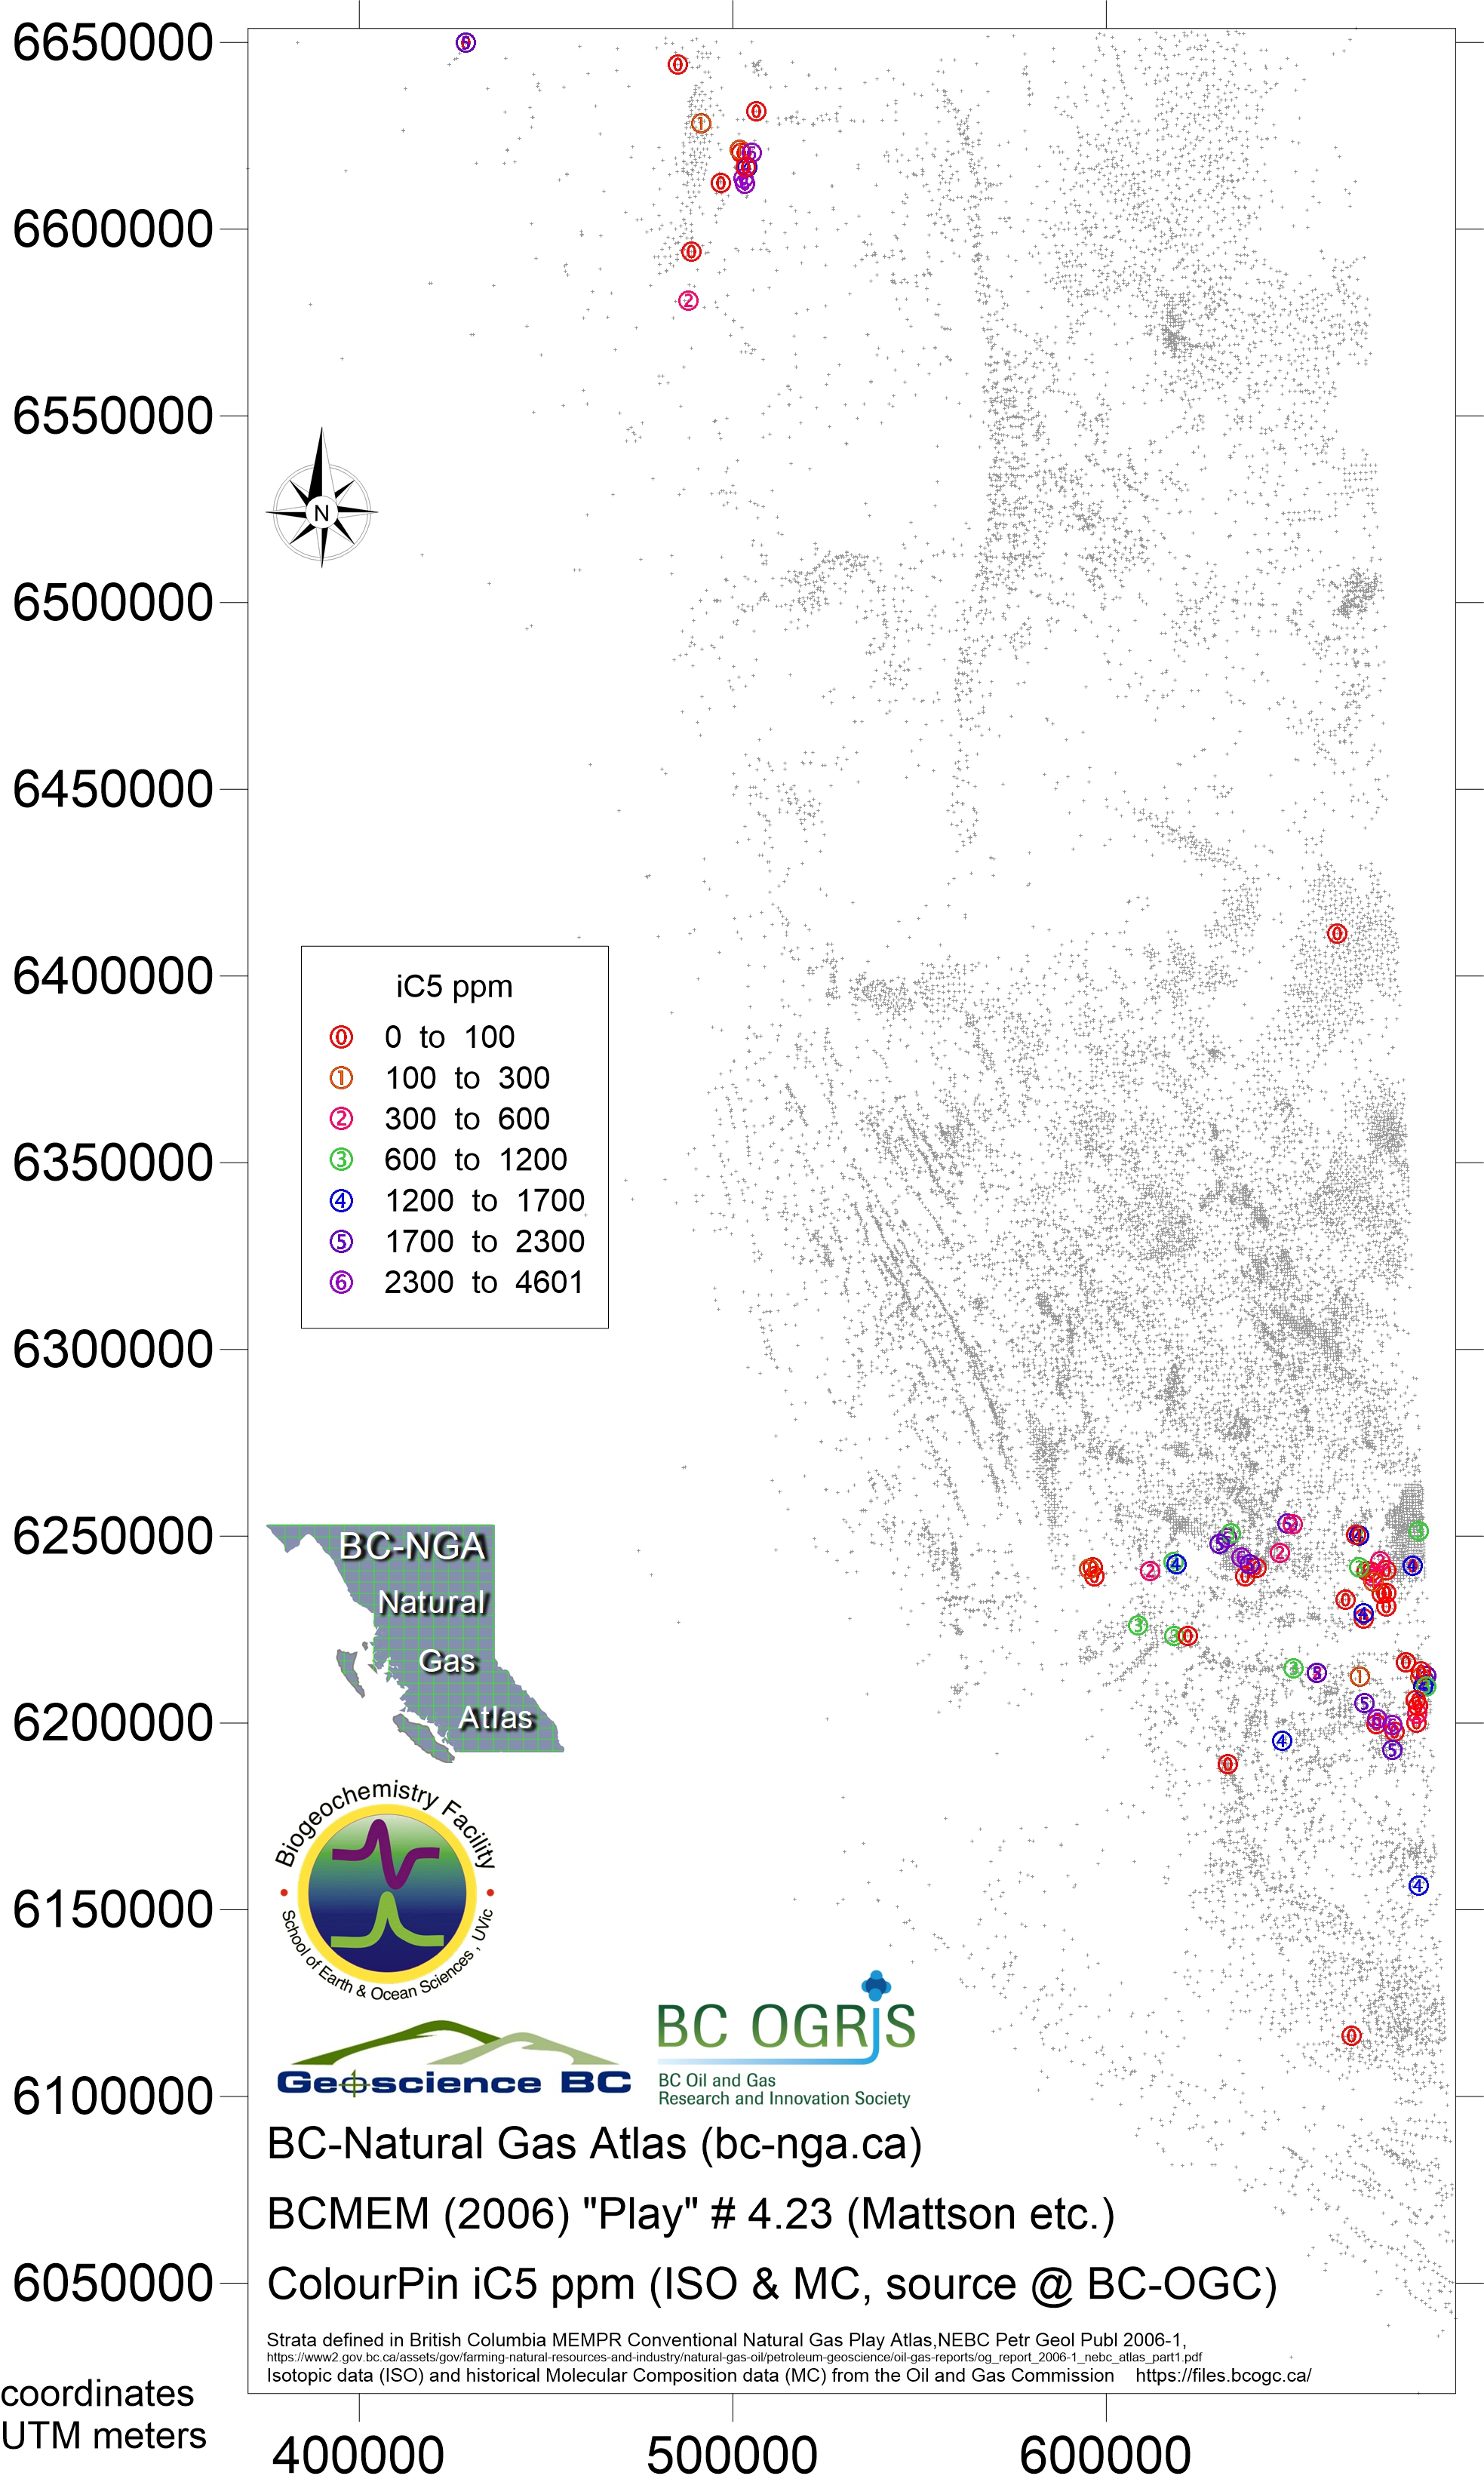
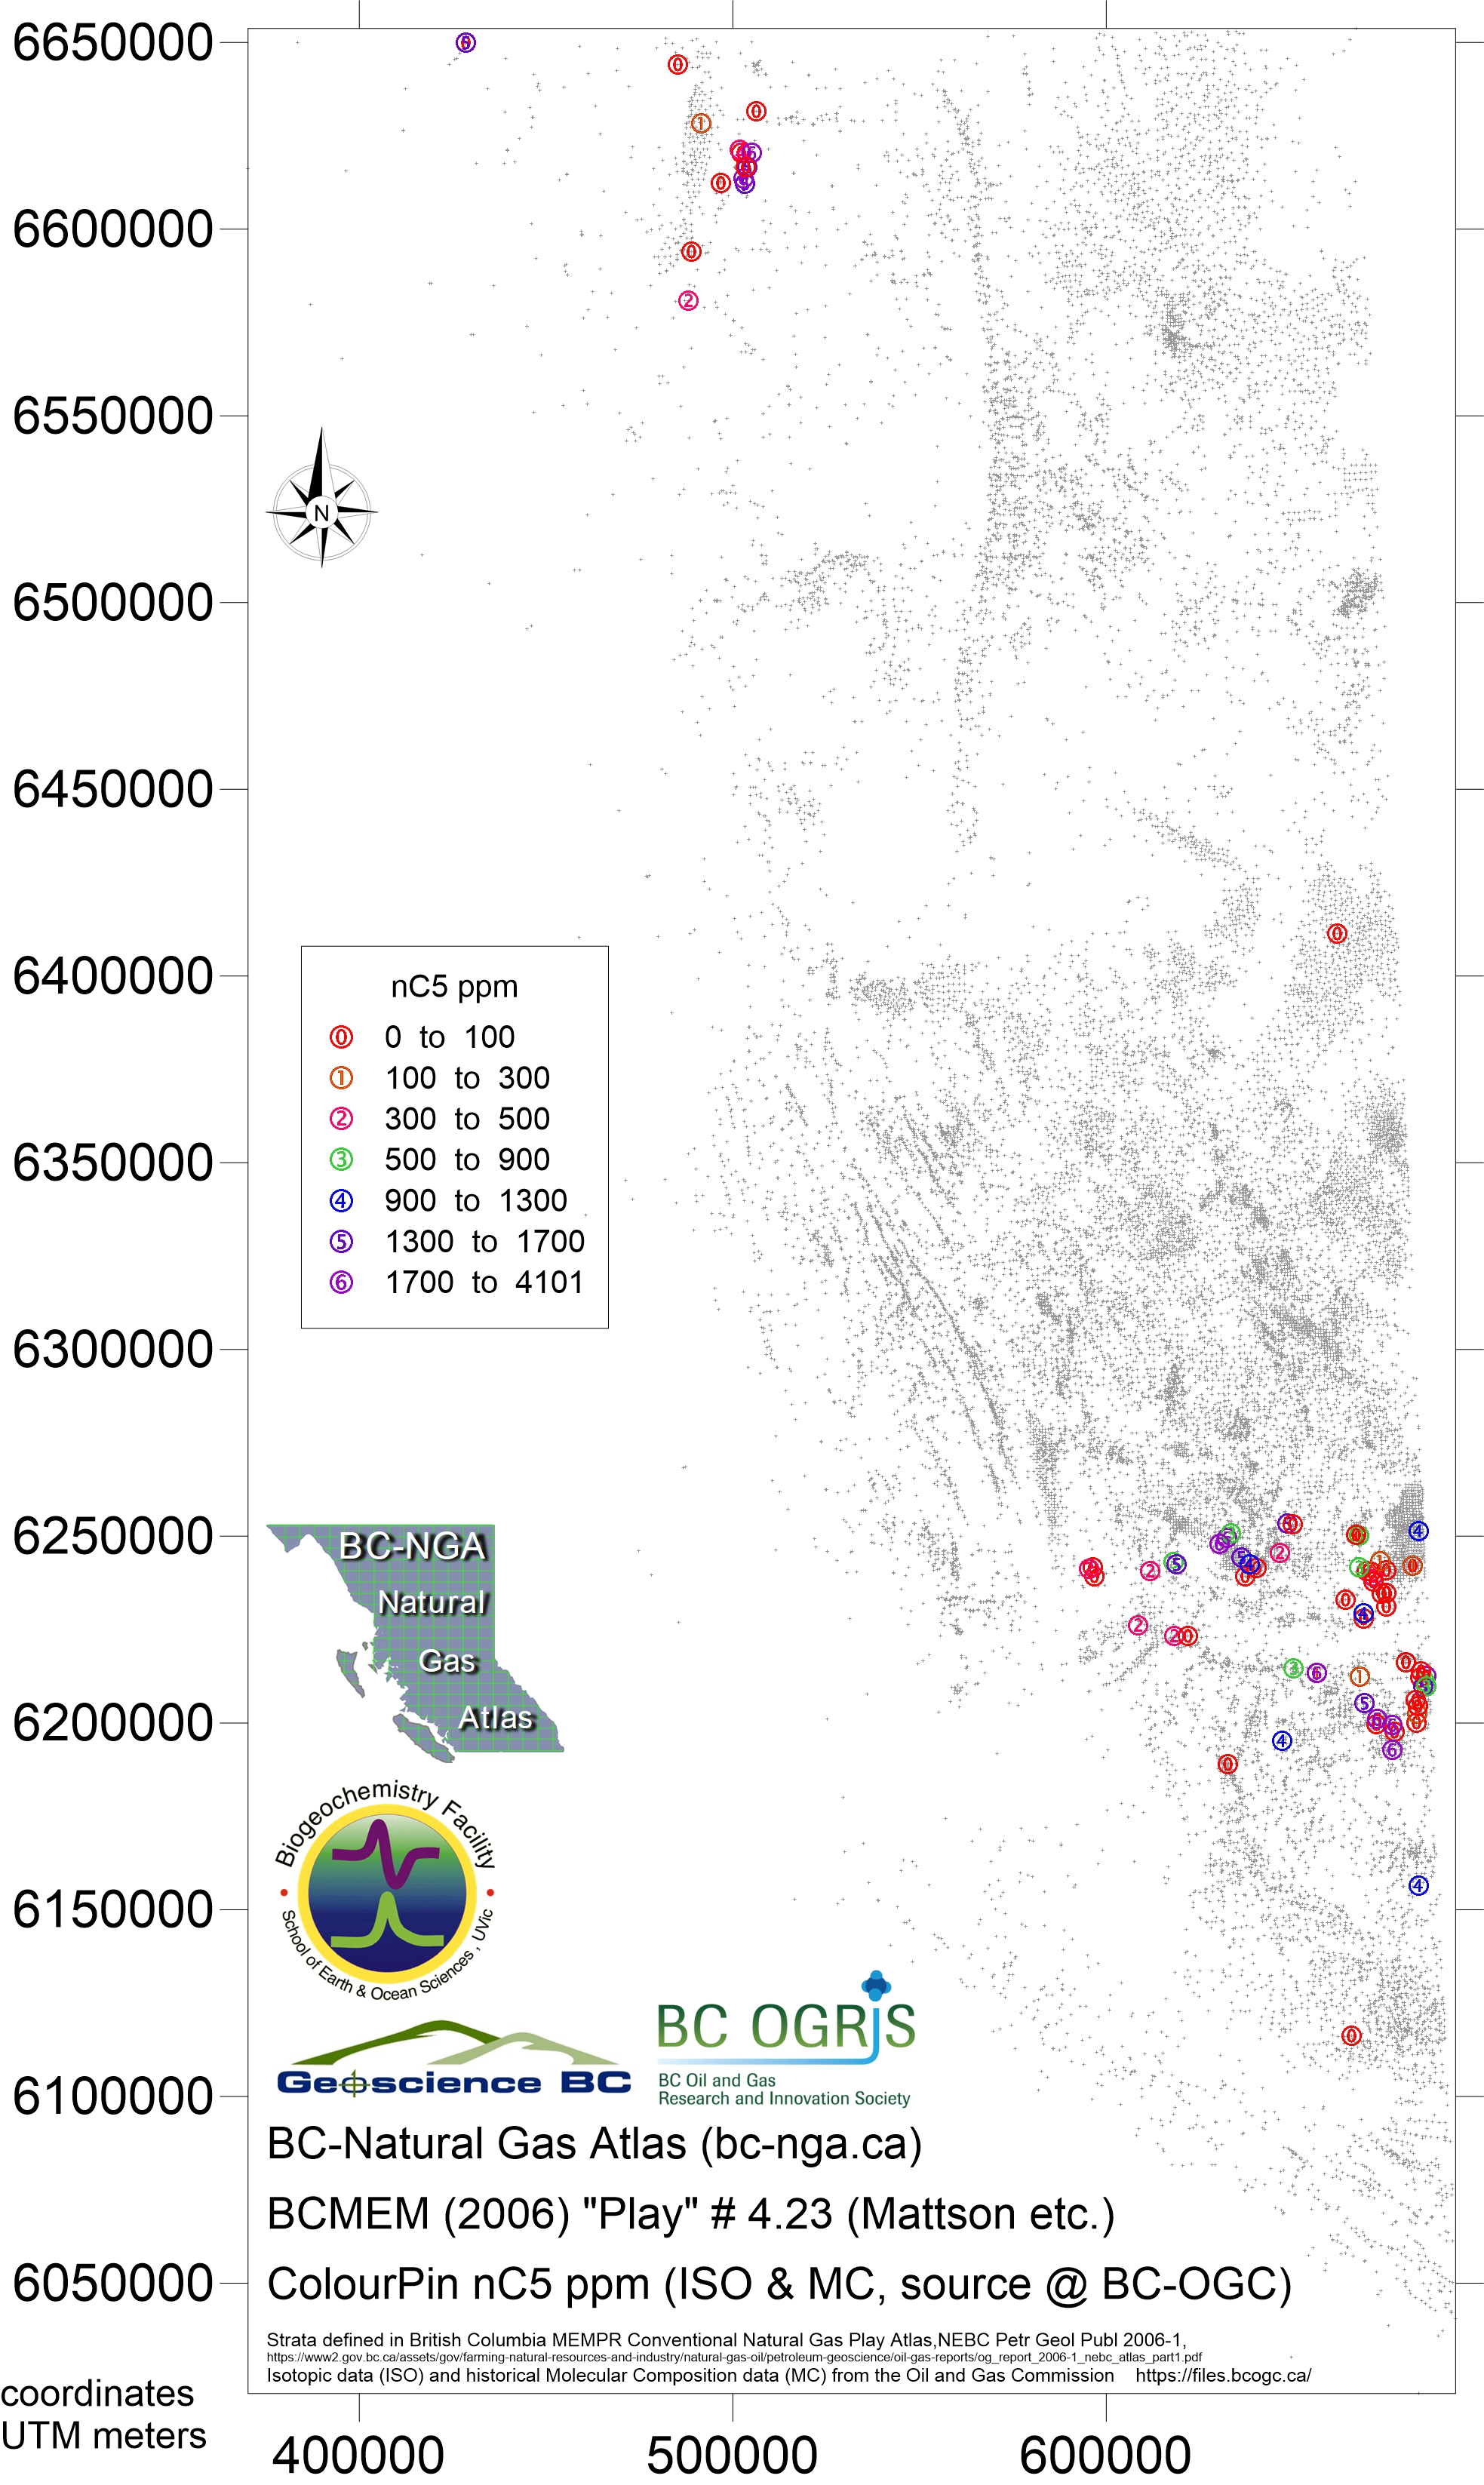
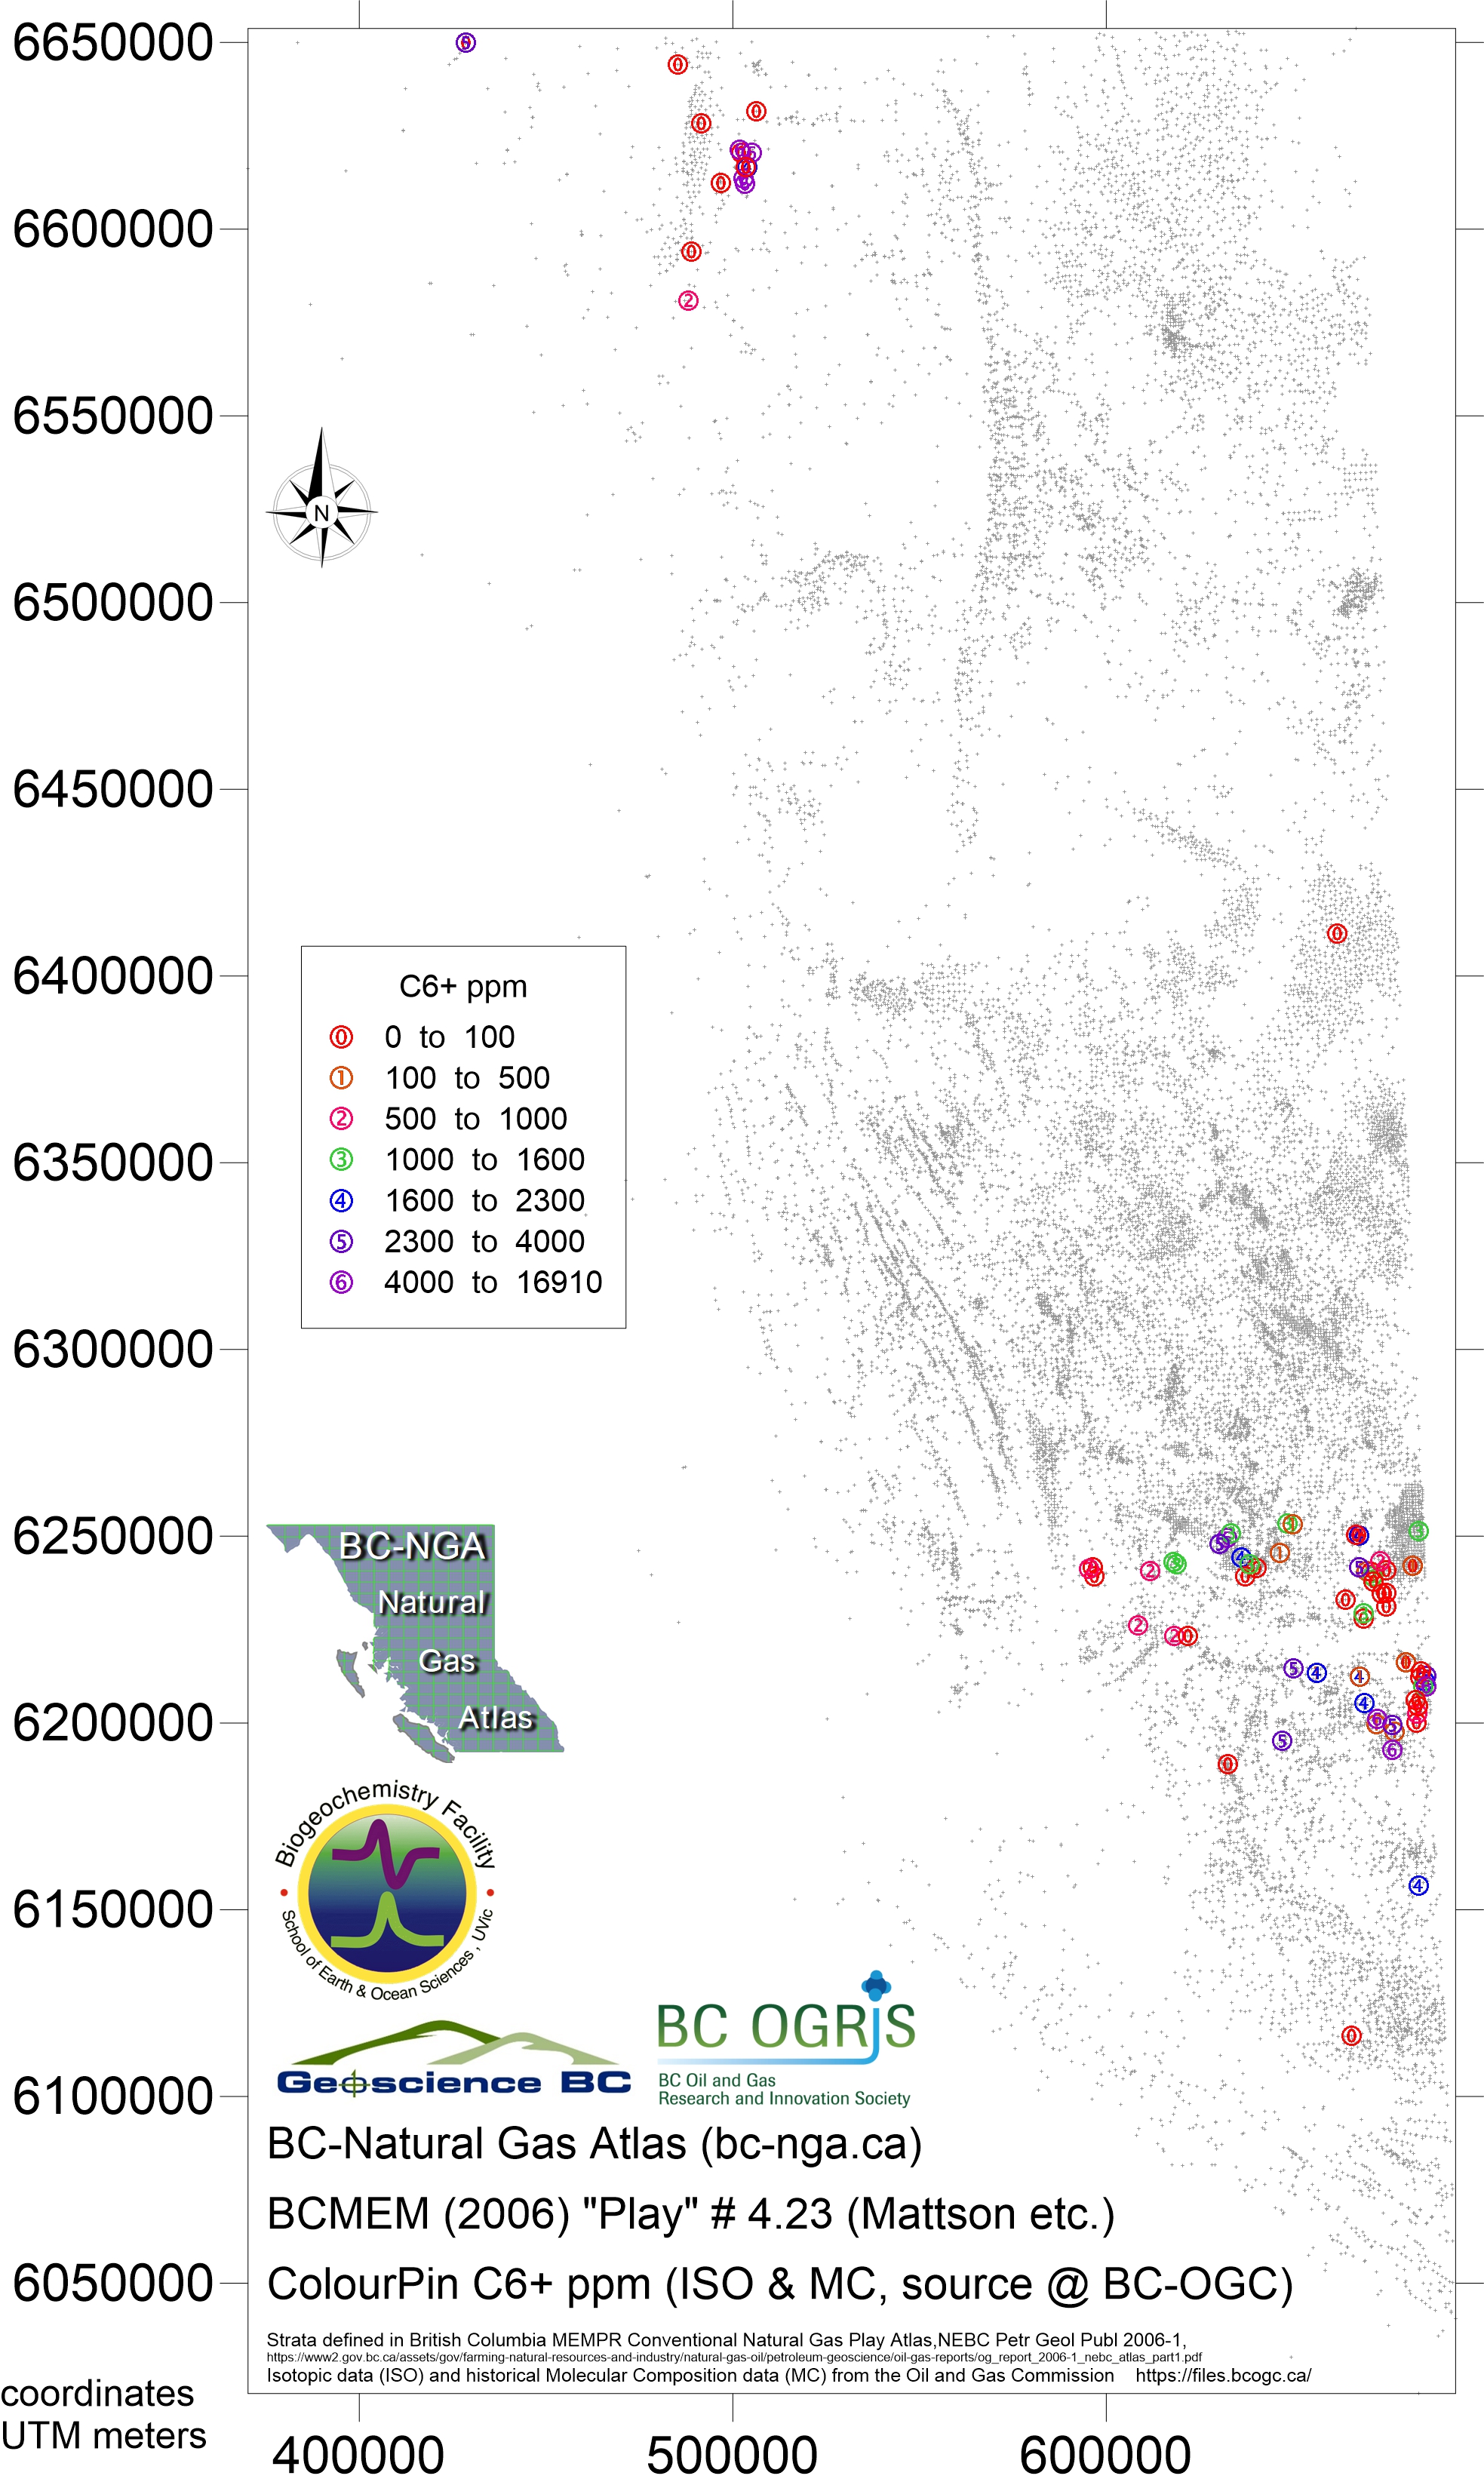
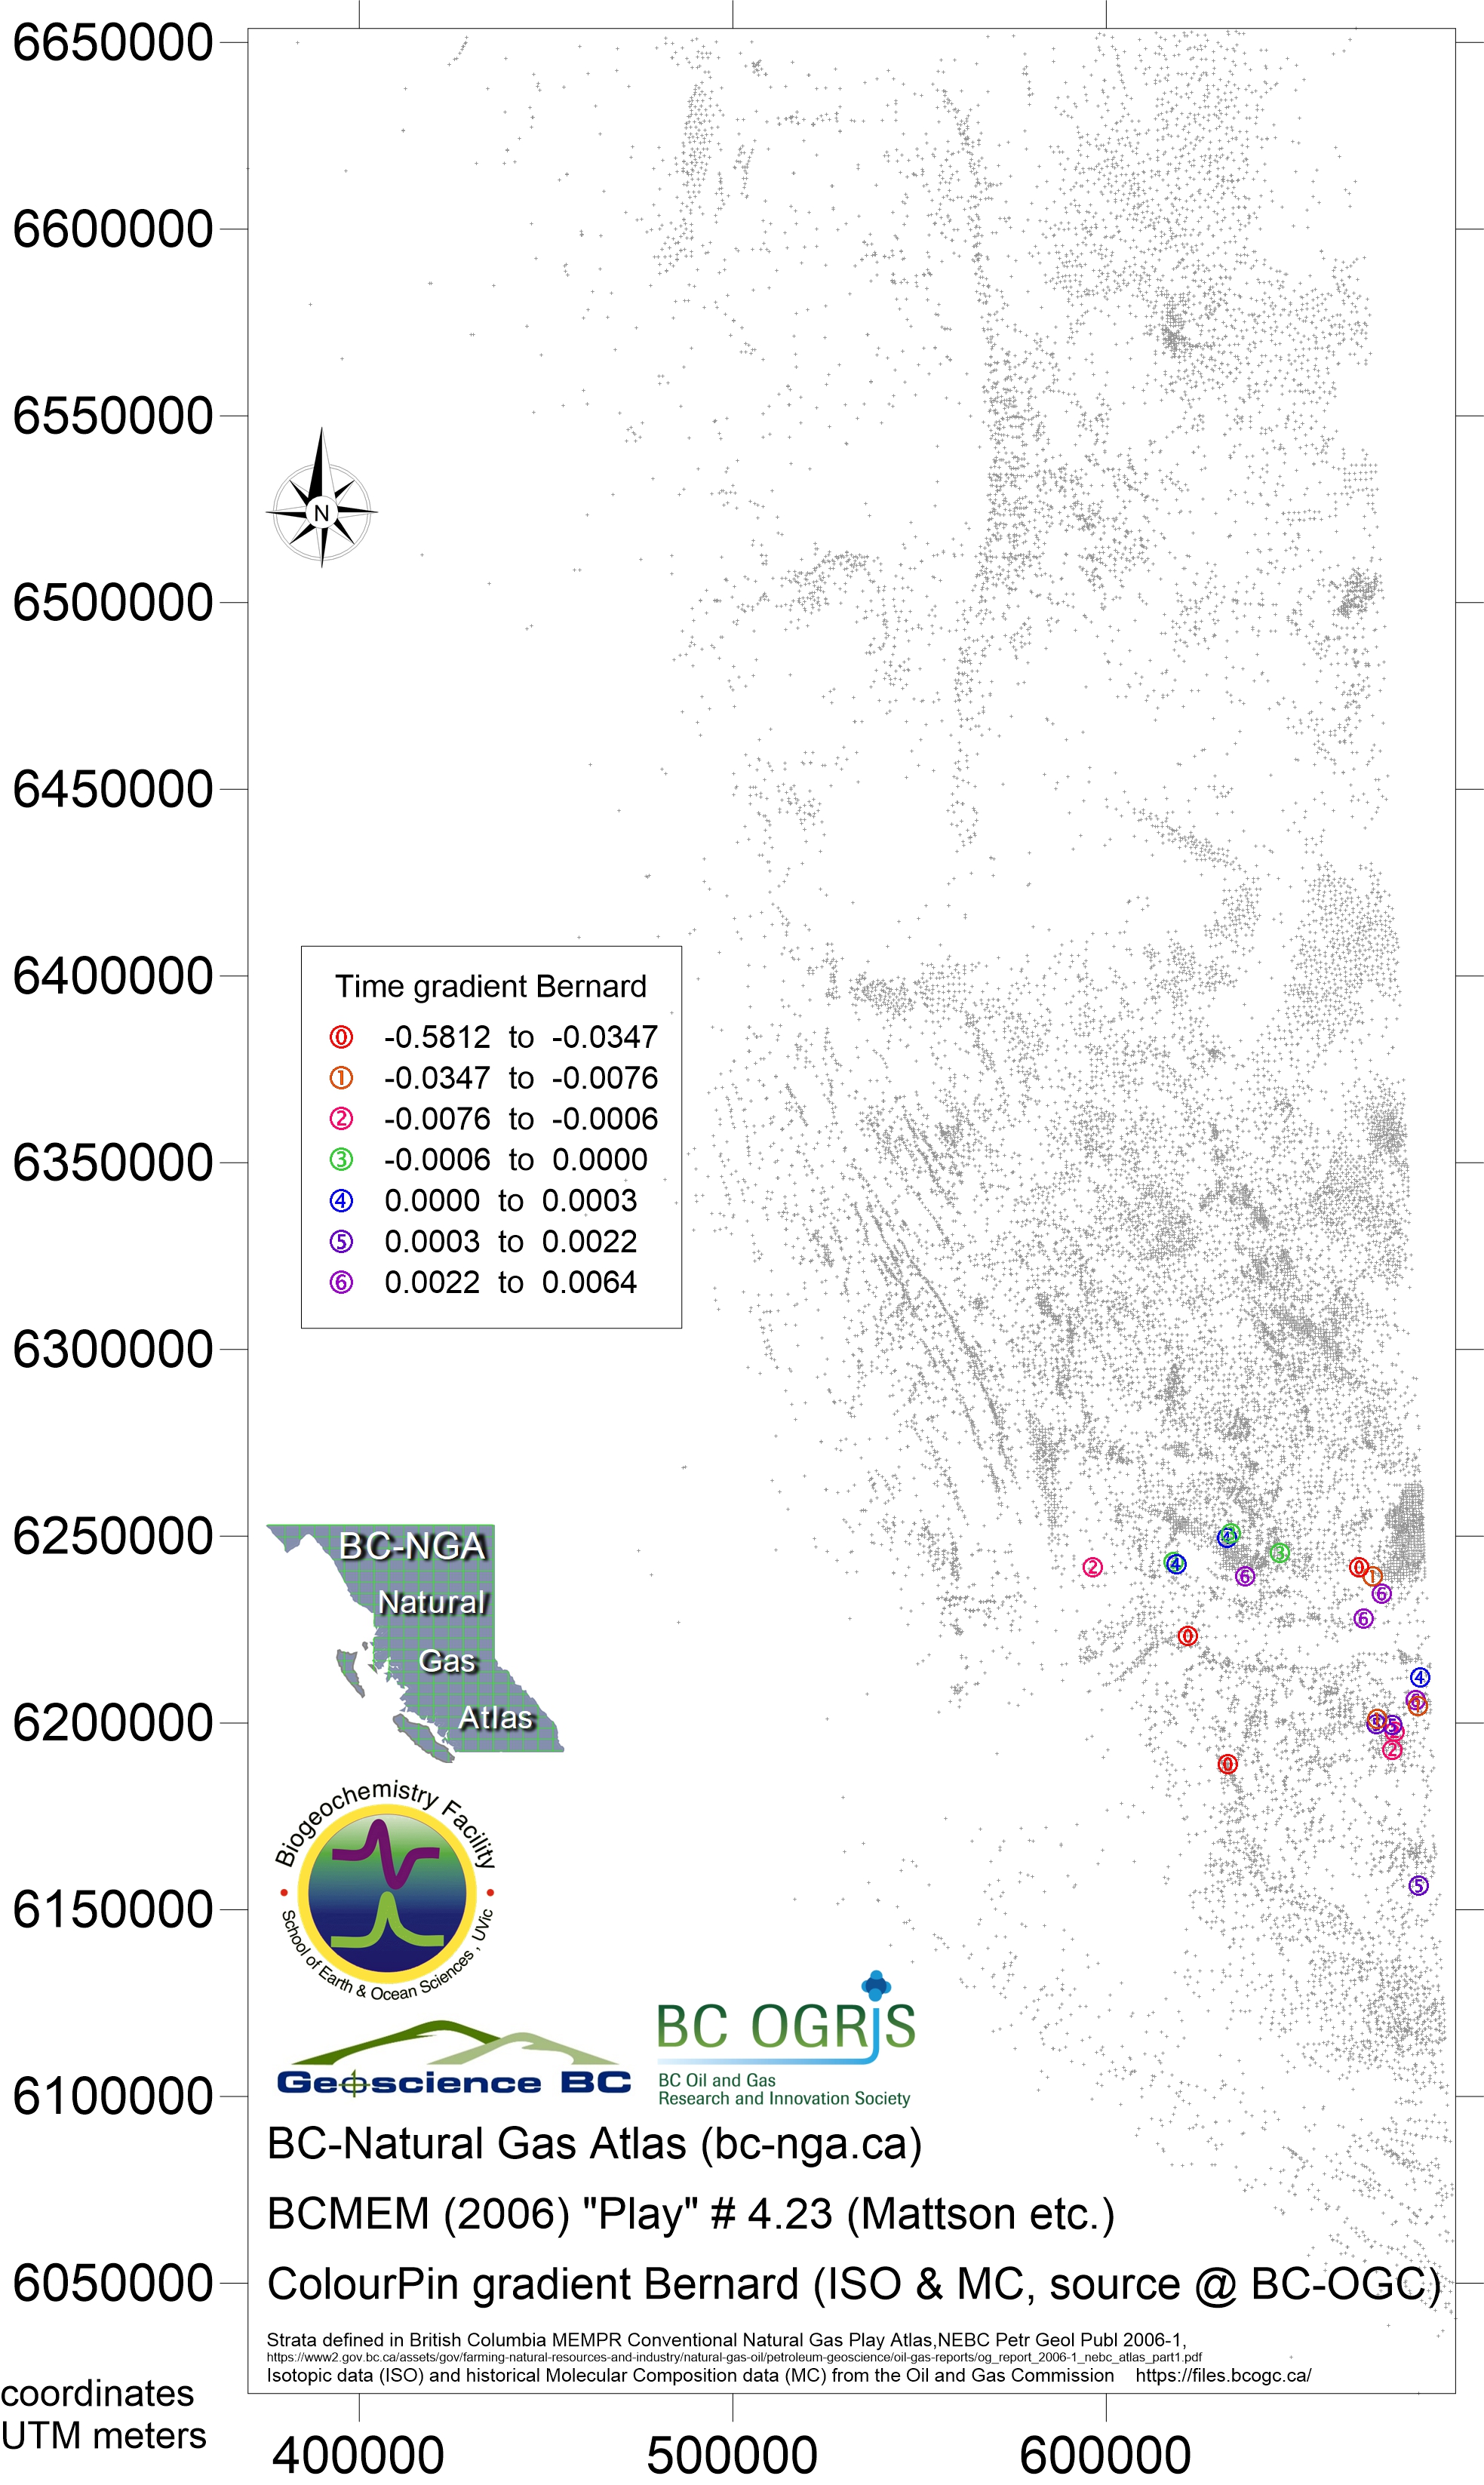
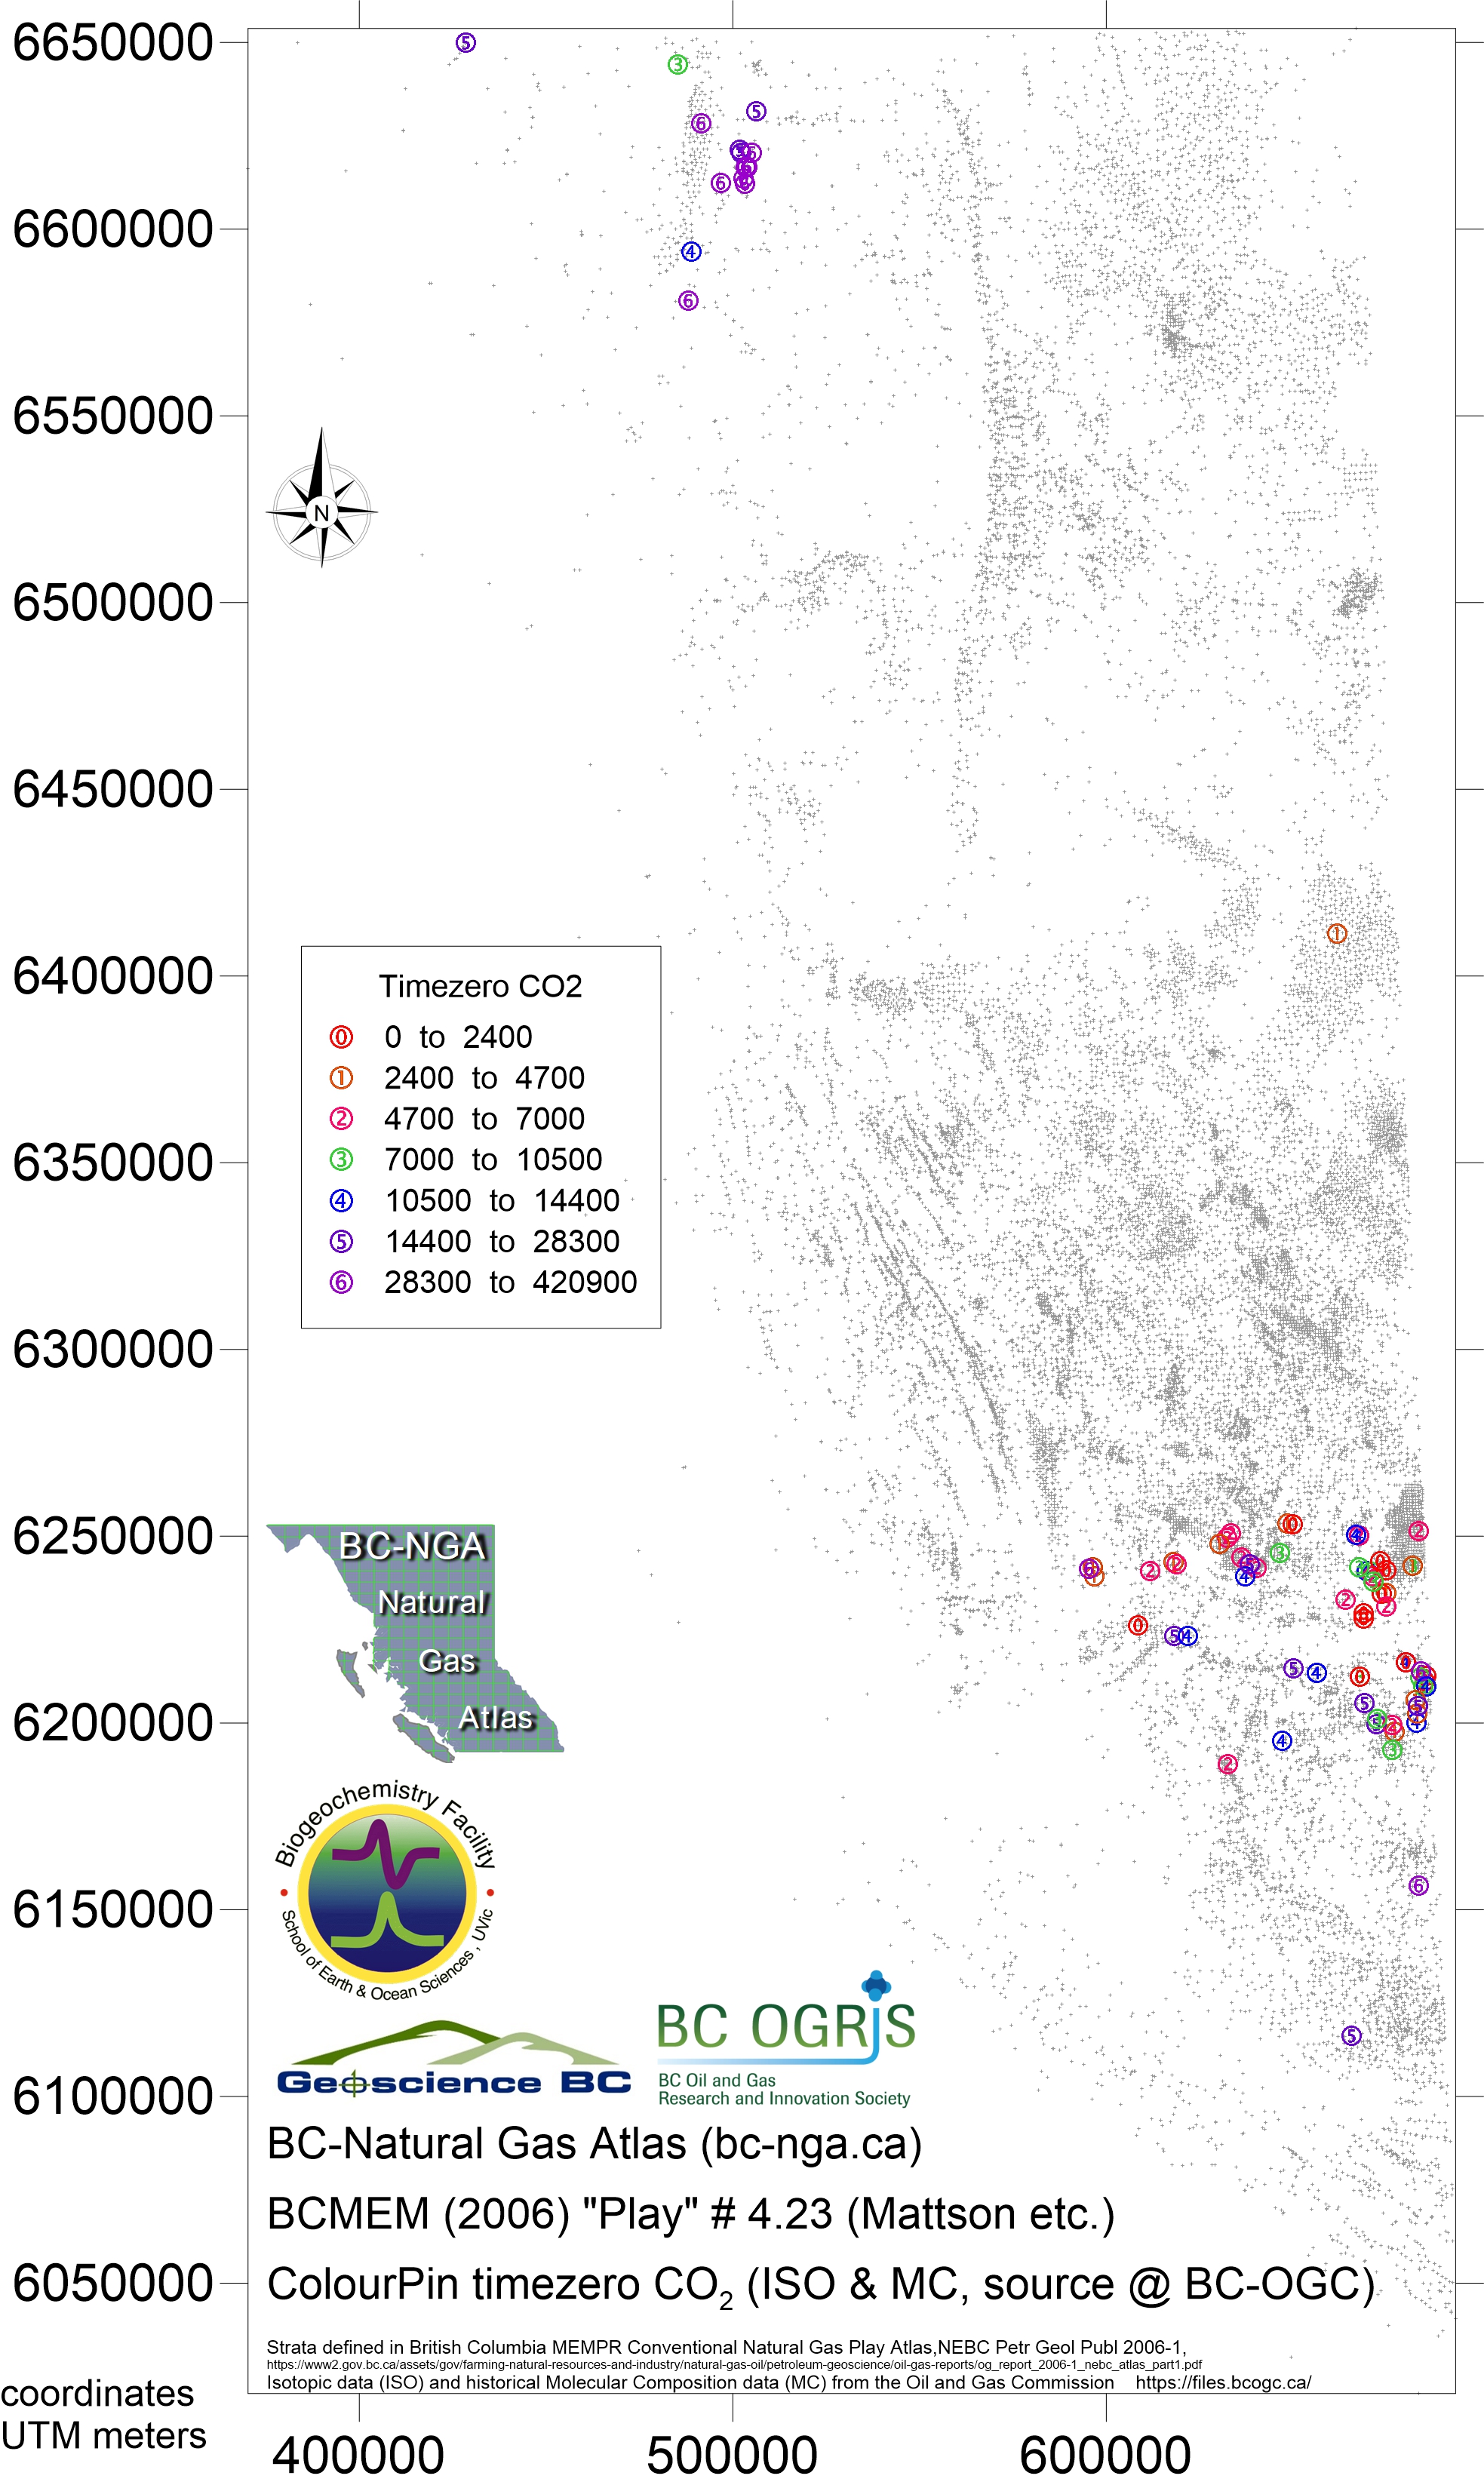
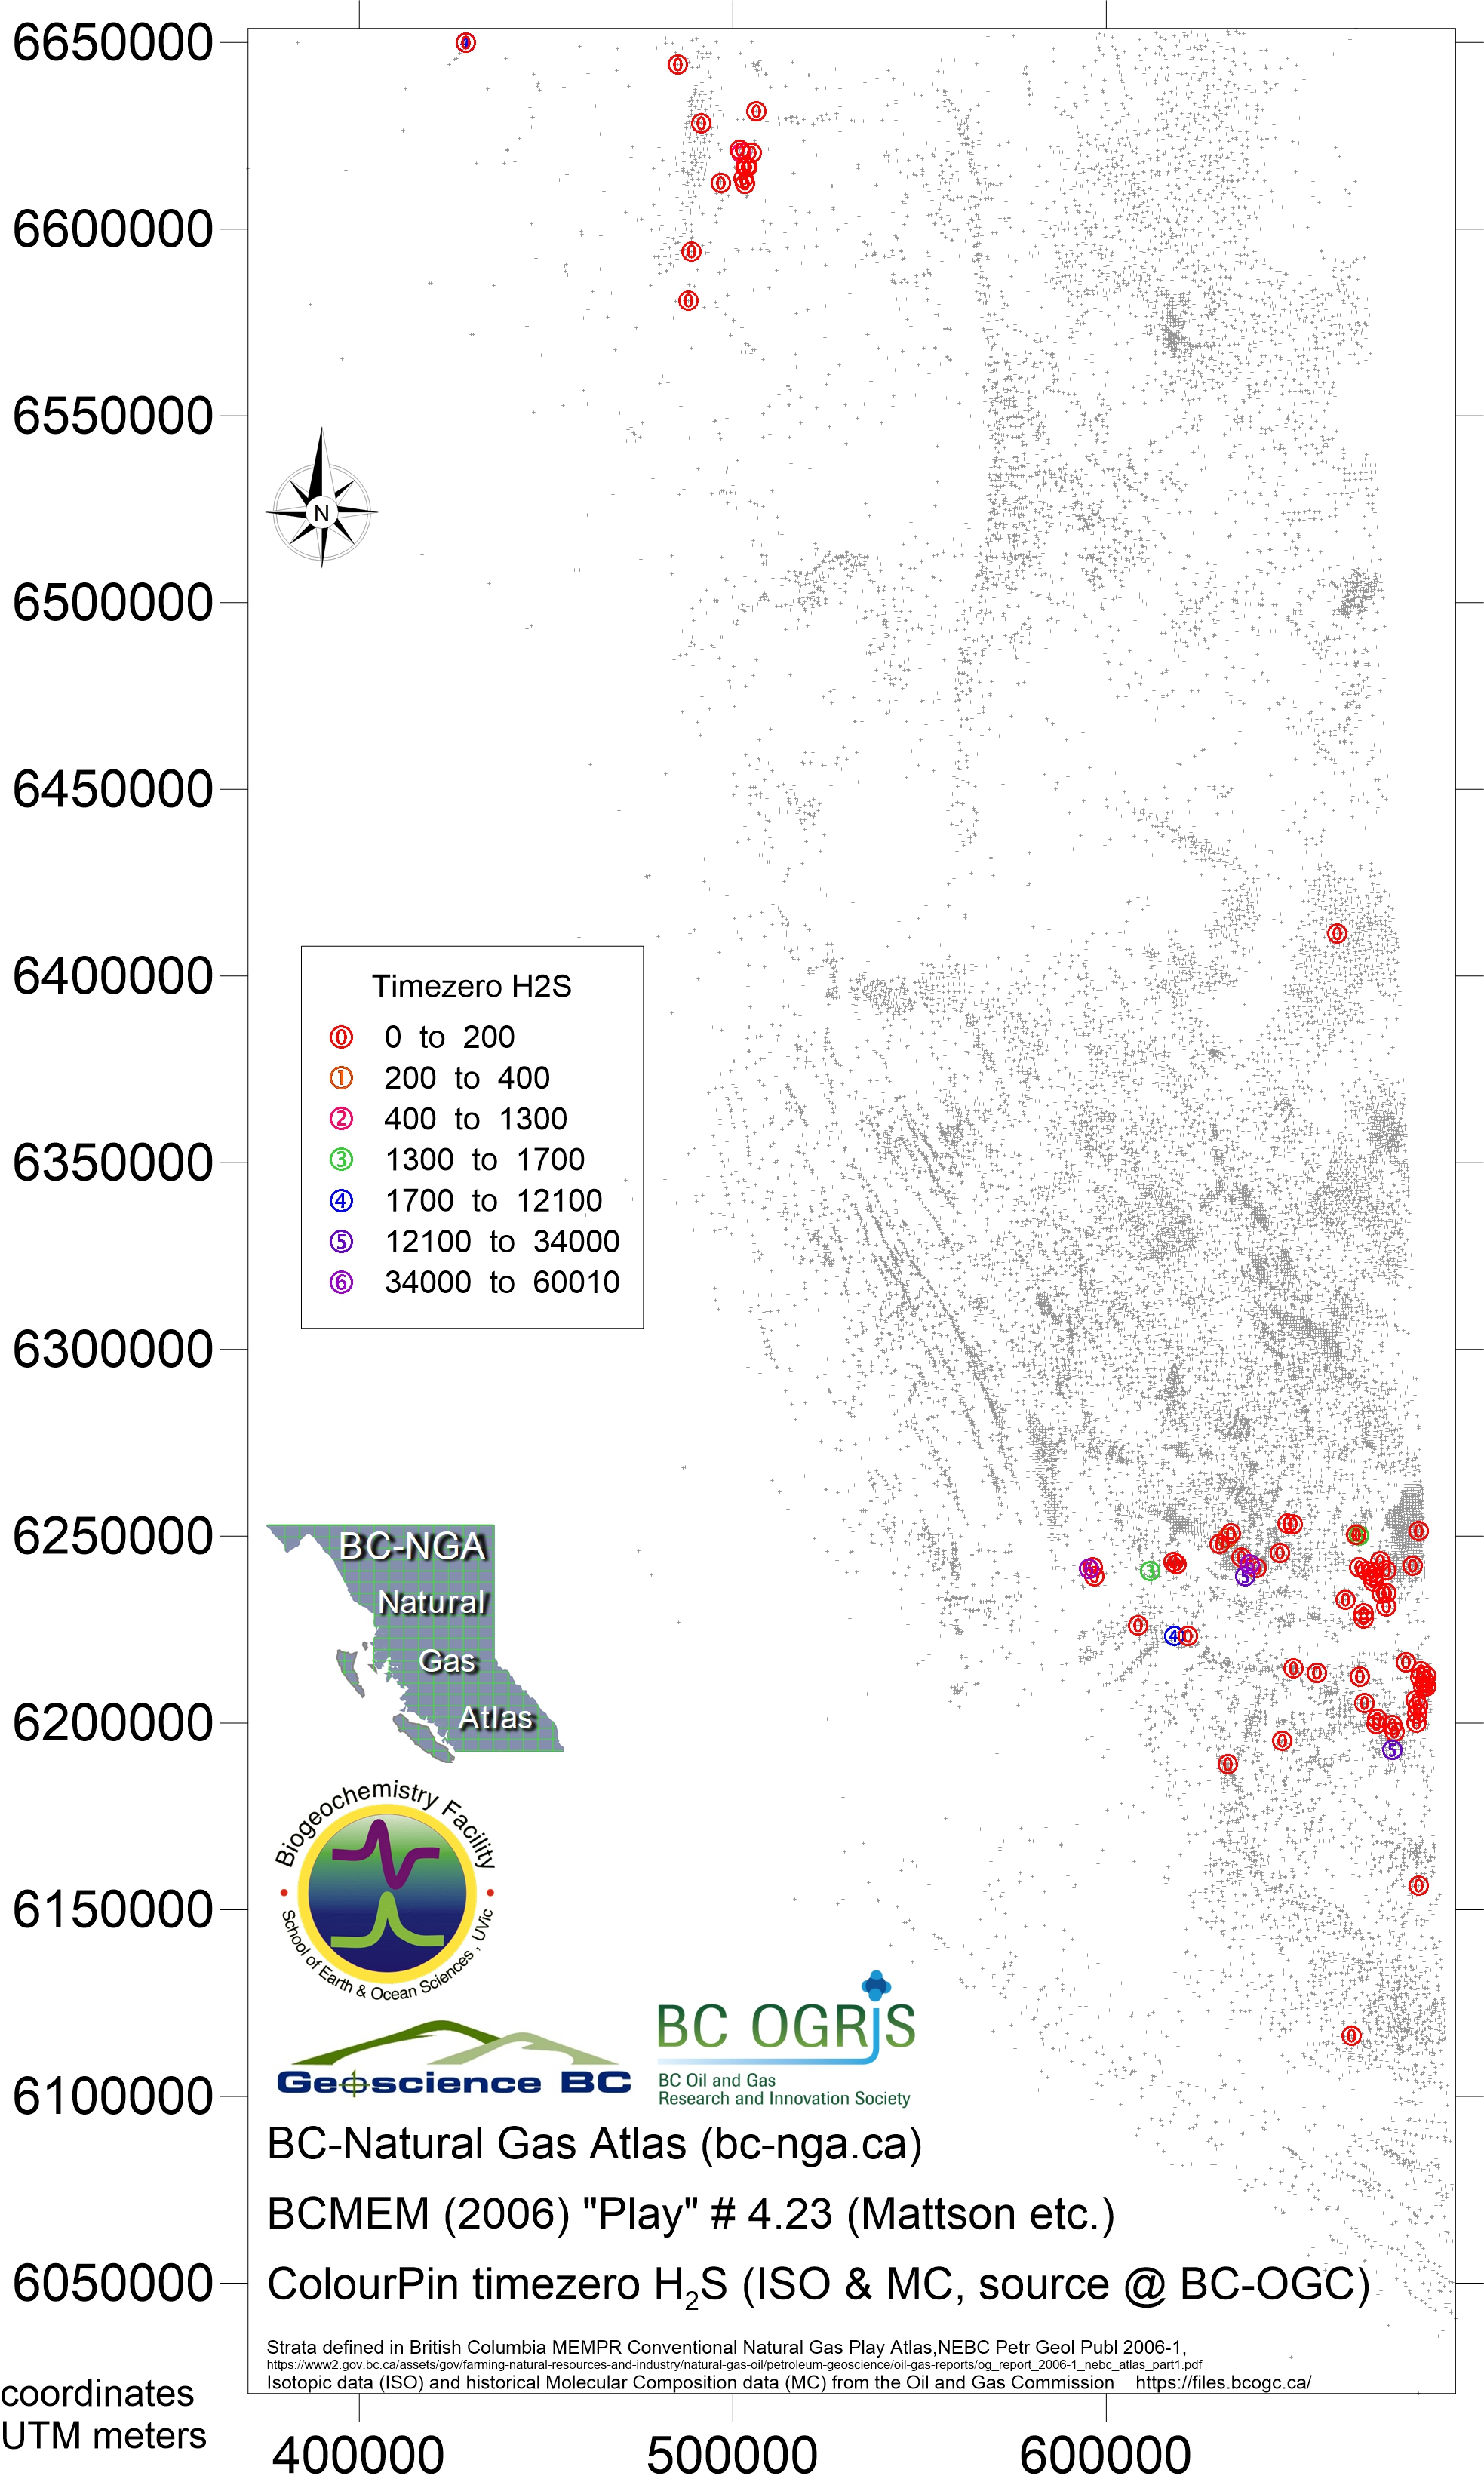
Play 4.23 Mattson / Kiskatinaw Formations and equivalents
- Map249 Nov 2018 play 4.23 Mattson/Kiskatinaw eqv Bernard ratio
- Map250 Nov 2018 play 4.23 Mattson/Kiskatinaw eqv dryness ratio
- Map251 Nov 2018 play 4.23 Mattson/Kiskatinaw eqv iC4nC4 ratio
- Map252 Nov 2018 play 4.23 Mattson/Kiskatinaw eqv H2S ppm
- Map253 Nov 2018 play 4.23 Mattson/Kiskatinaw eqv CH4 ppm
- Map254 Nov 2018 play 4.23 Mattson/Kiskatinaw eqv C2H6 ppm
- Map255 Nov 2018 play 4.23 Mattson/Kiskatinaw eqv C3H8 ppm
- Map256 Nov 2018 play 4.23 Mattson/Kiskatinaw eqv iC4H10 ppm
- Map257 Nov 2018 play 4.23 Mattson/Kiskatinaw eqv nC4H10 ppm
- Map258 Nov 2018 play 4.23 Mattson/Kiskatinaw eqv iC5H12 ppm
- Map259 Nov 2018 play 4.23 Mattson/Kiskatinaw eqv nC5H12 ppm
- Map260 Nov 2018 play 4.23 Mattson/Kiskatinaw eqv C6H14 plus ppm
- Map261 Nov 2018 play 4.23 Mattson/Kiskatinaw eqv CO2 ppm
- Map262 Nov 2018 play 4.23 Mattson/Kiskatinaw eqv time series gradient Bernard ratio
- Map263 Nov 2018 play 4.23 Mattson/Kiskatinaw eqv time series gradient CO2
- Map264 Nov 2018 play 4.23 Mattson/Kiskatinaw eqv time series gradient H2S
- Map265 Nov 2018 play 4.23 Mattson/Kiskatinaw eqv time series start point Bernard ratio
- Map266 Nov 2018 play 4.23 Mattson/Kiskatinaw eqv time series start point CO2
- Map267 Nov 2018 play 4.23 Mattson/Kiskatinaw eqv time series start point H2S
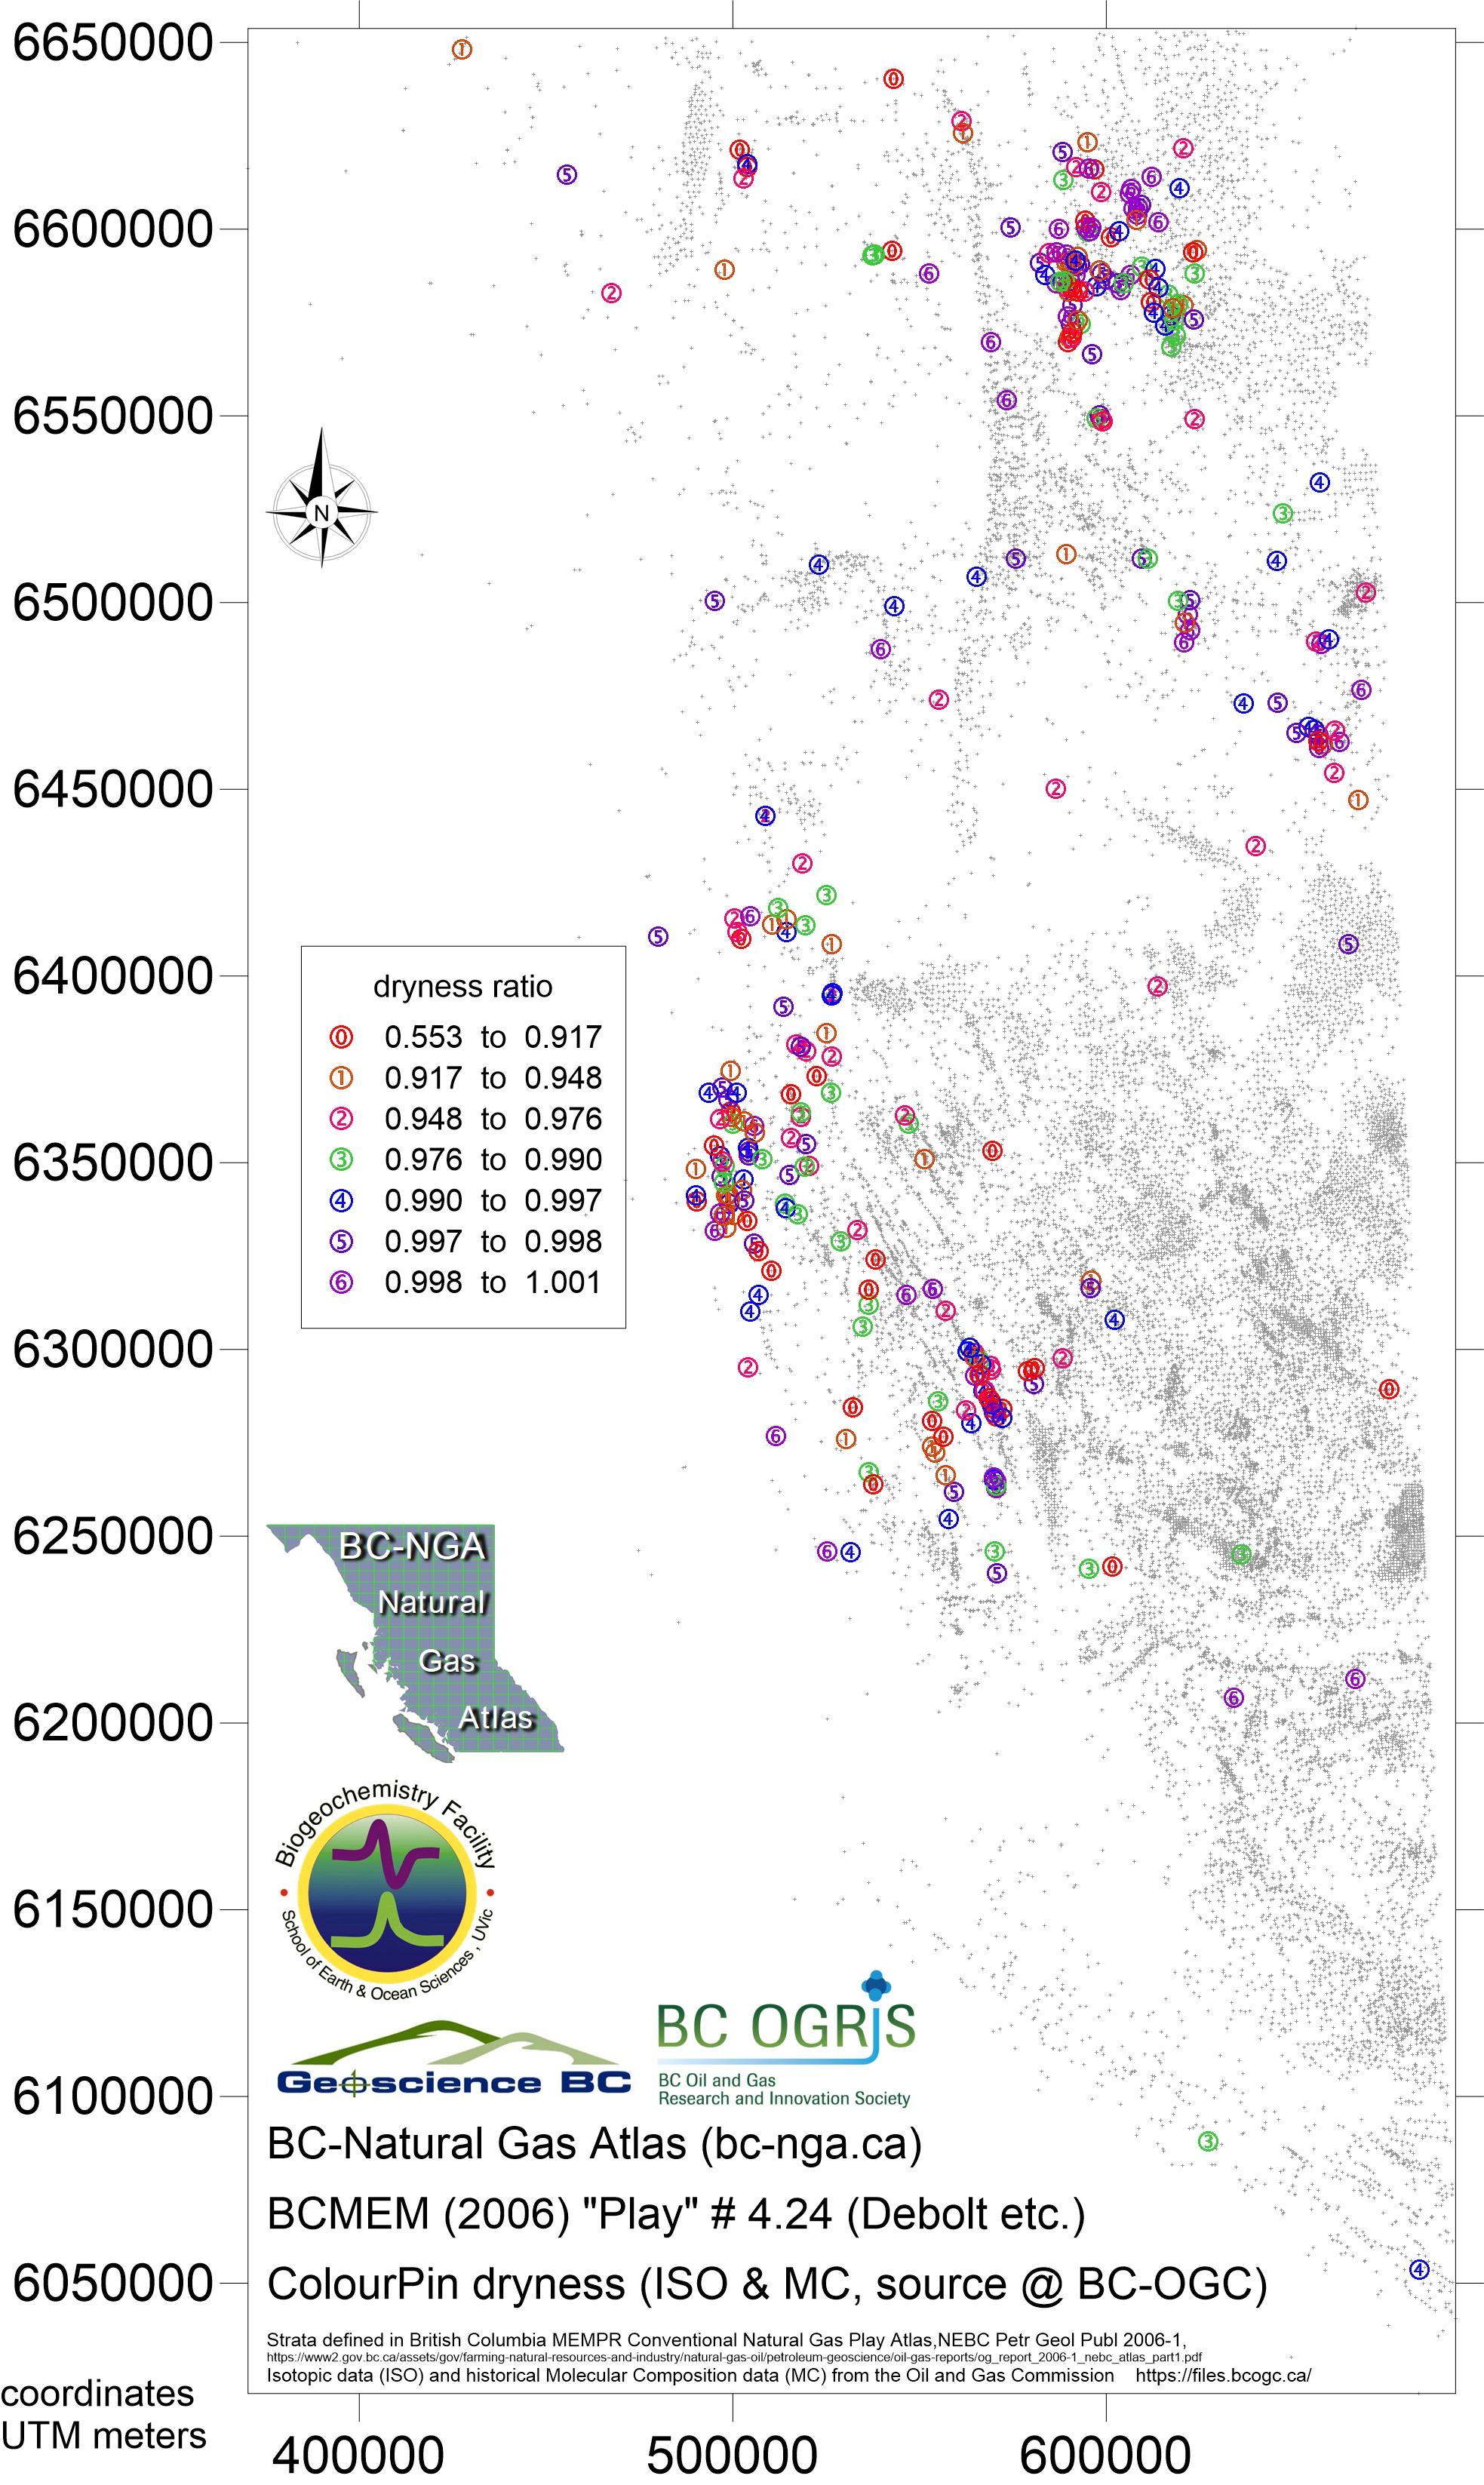
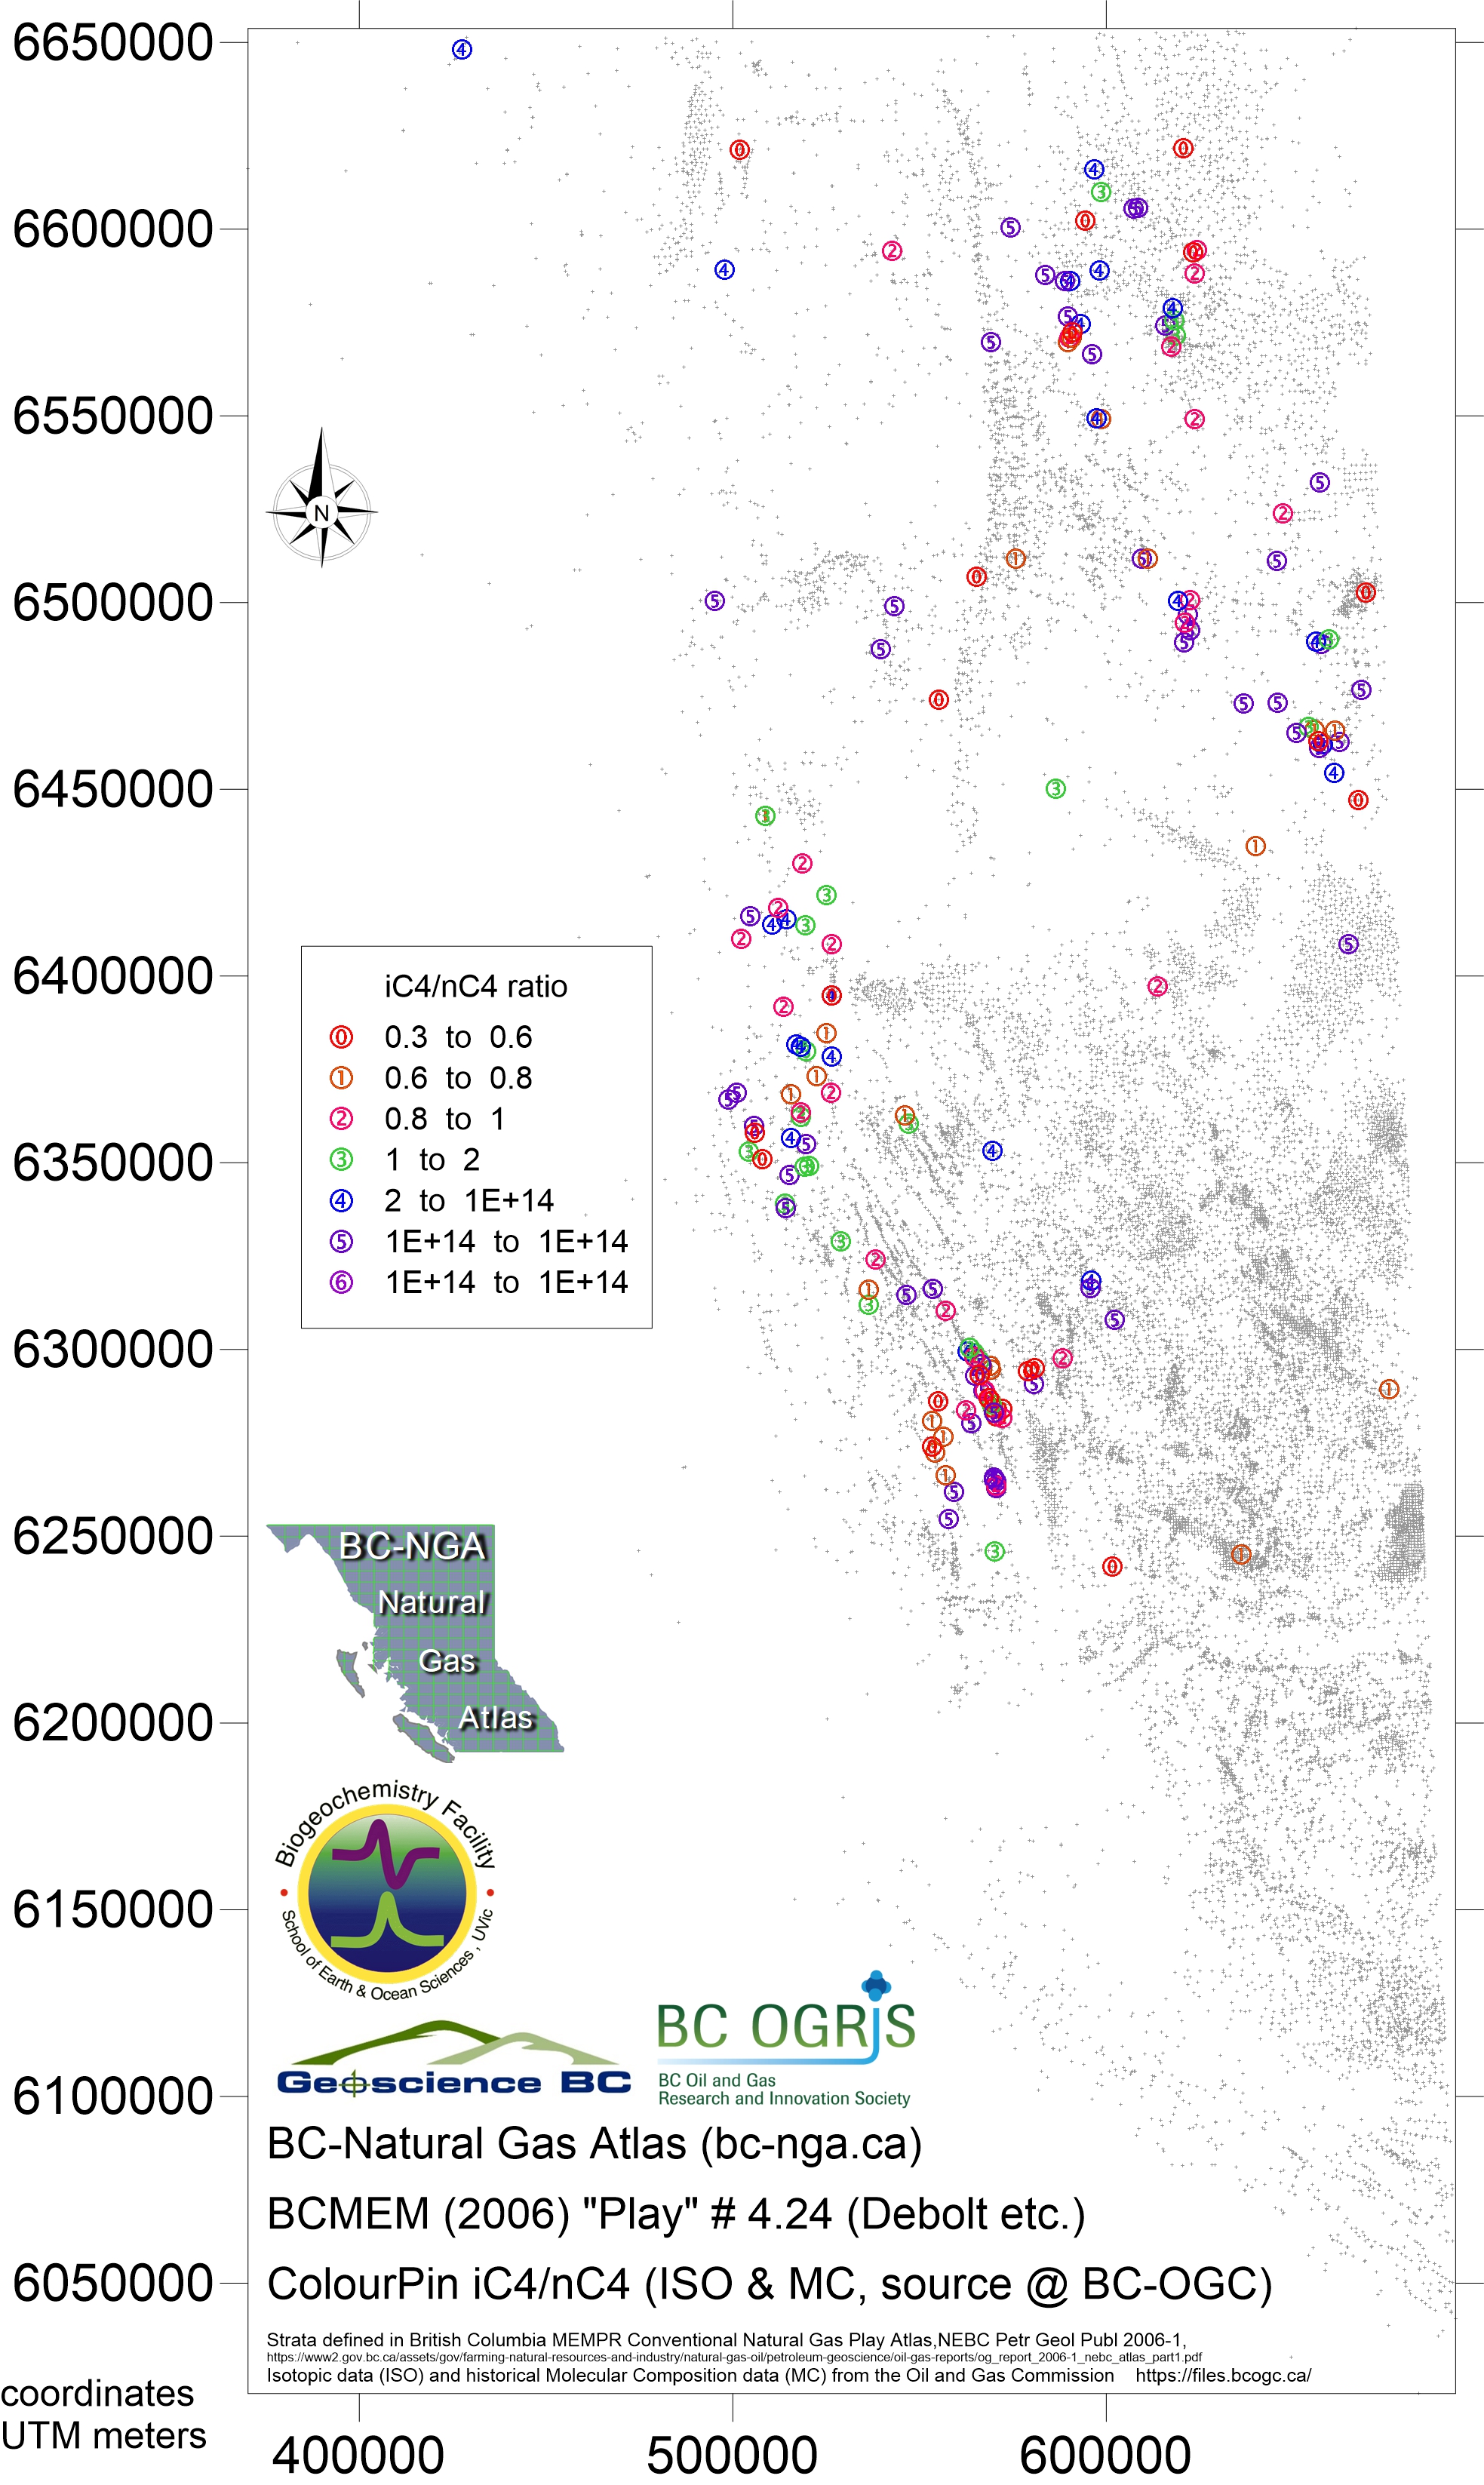
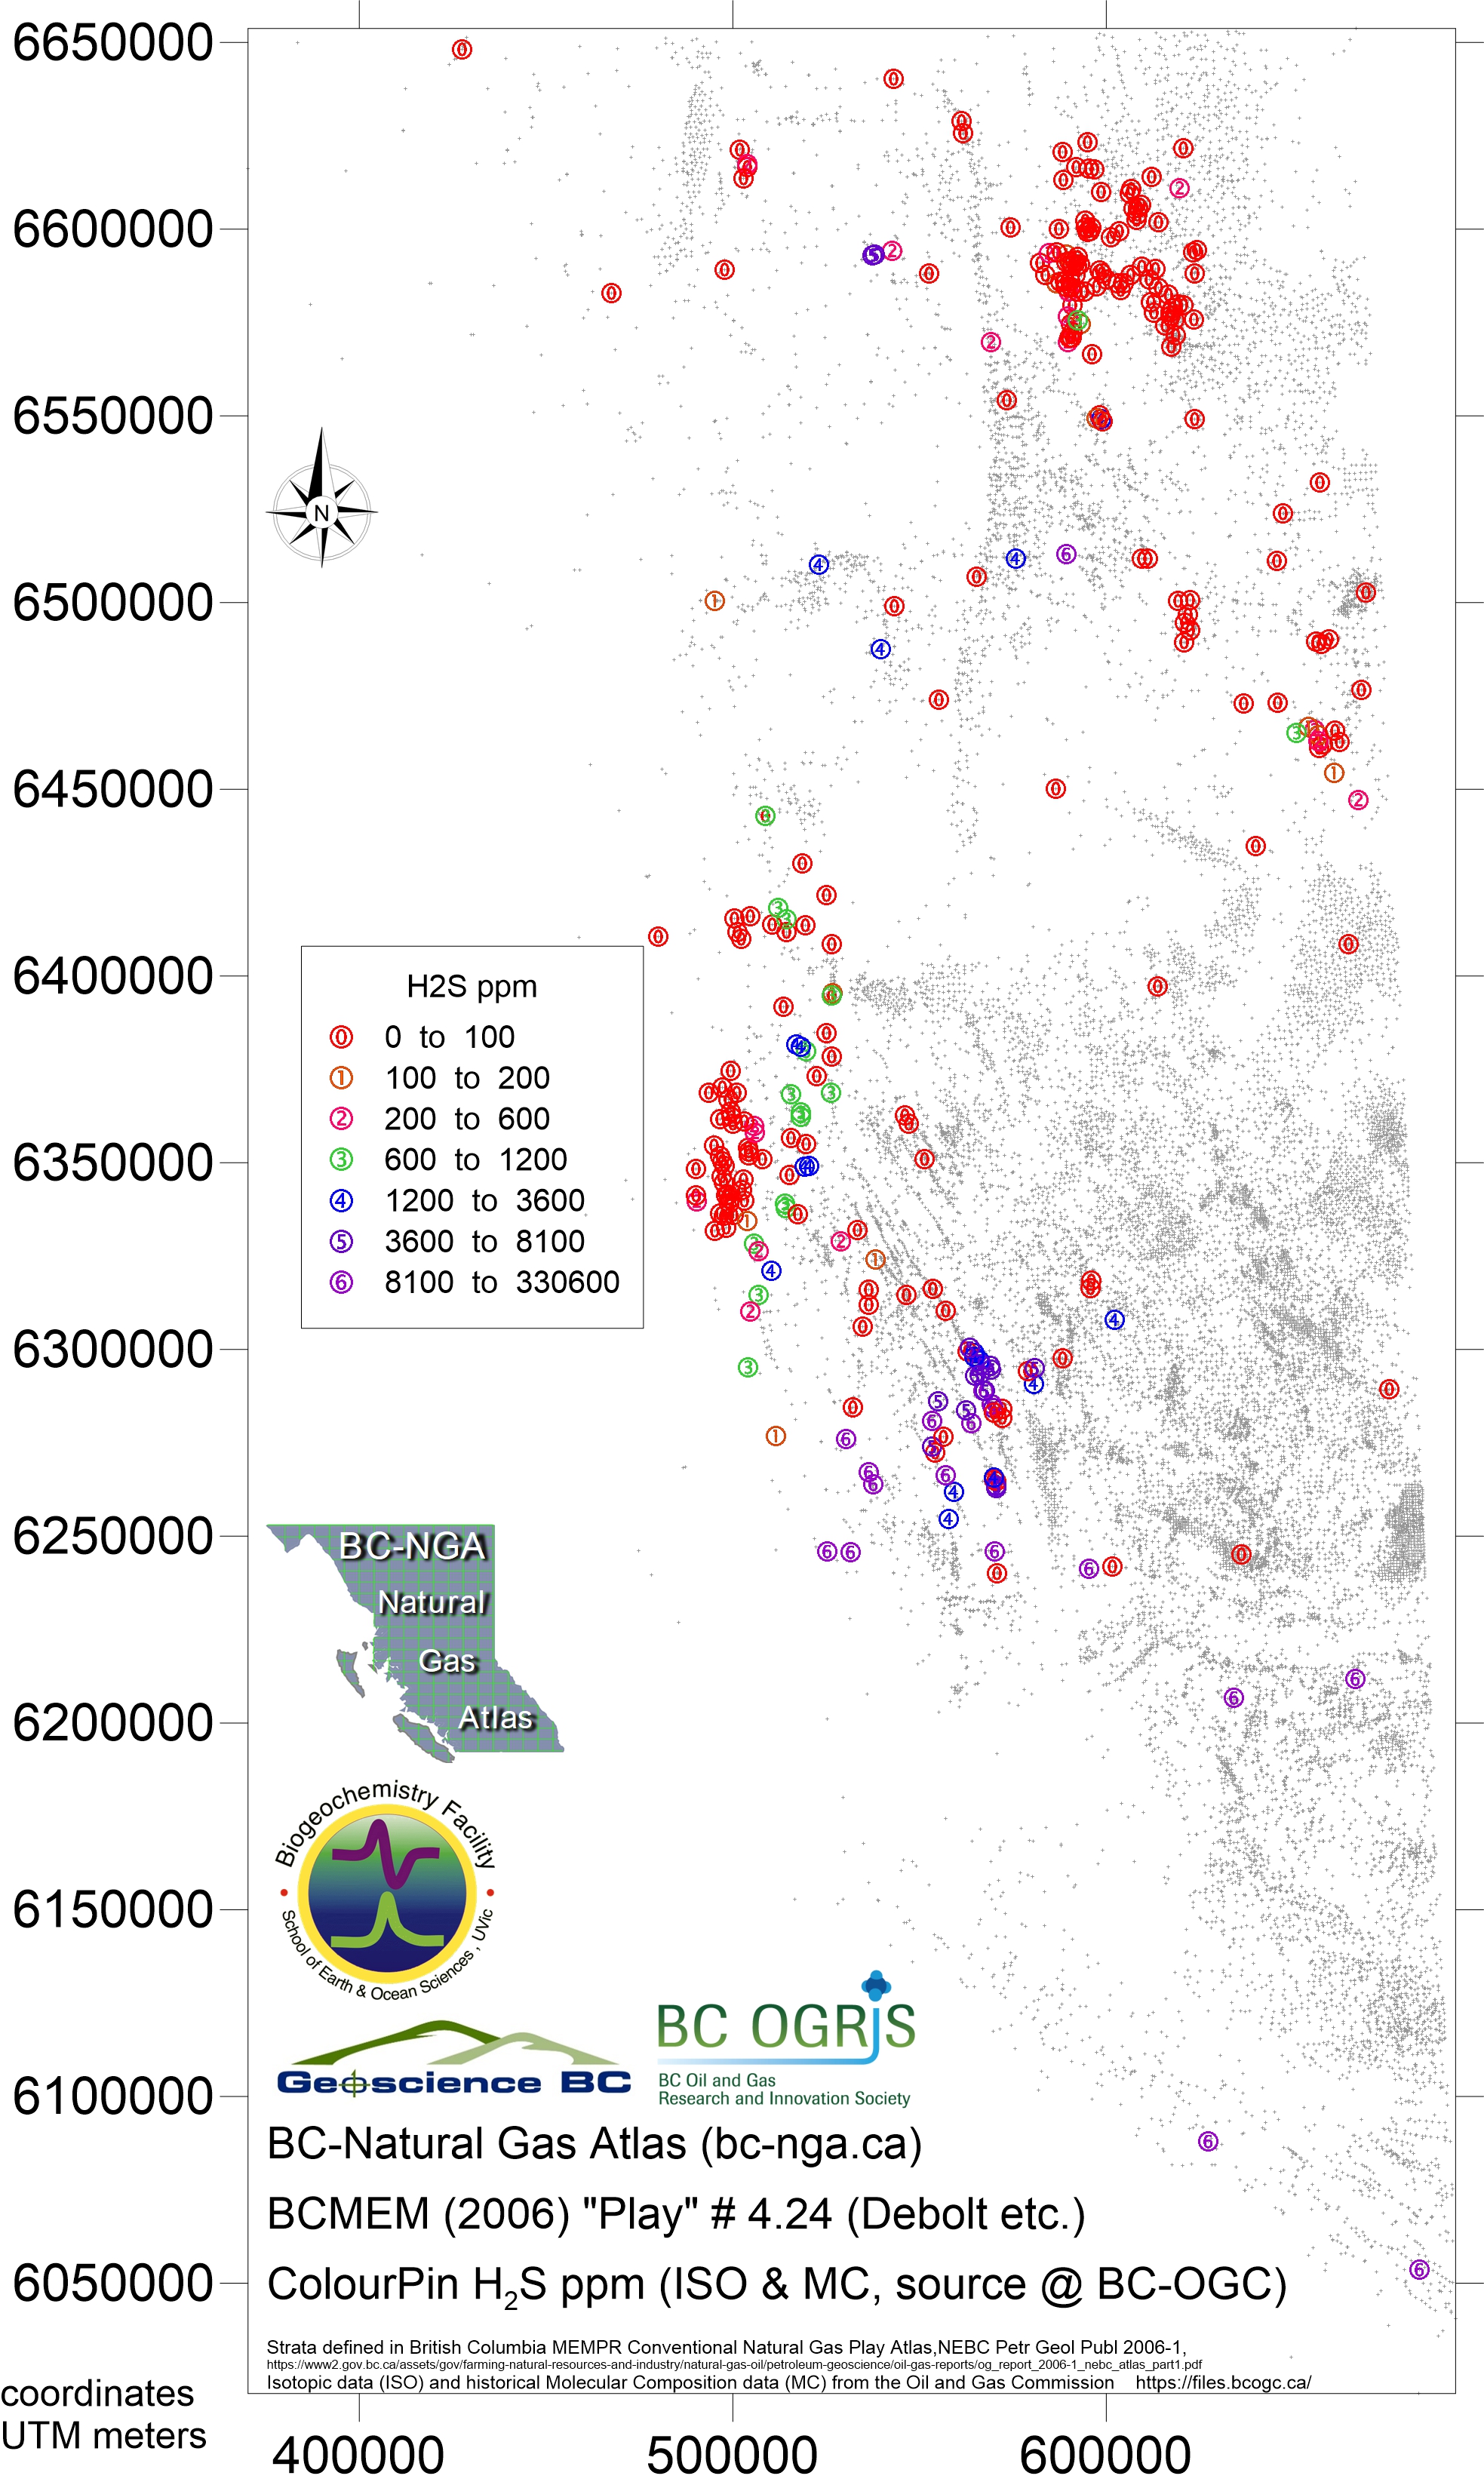
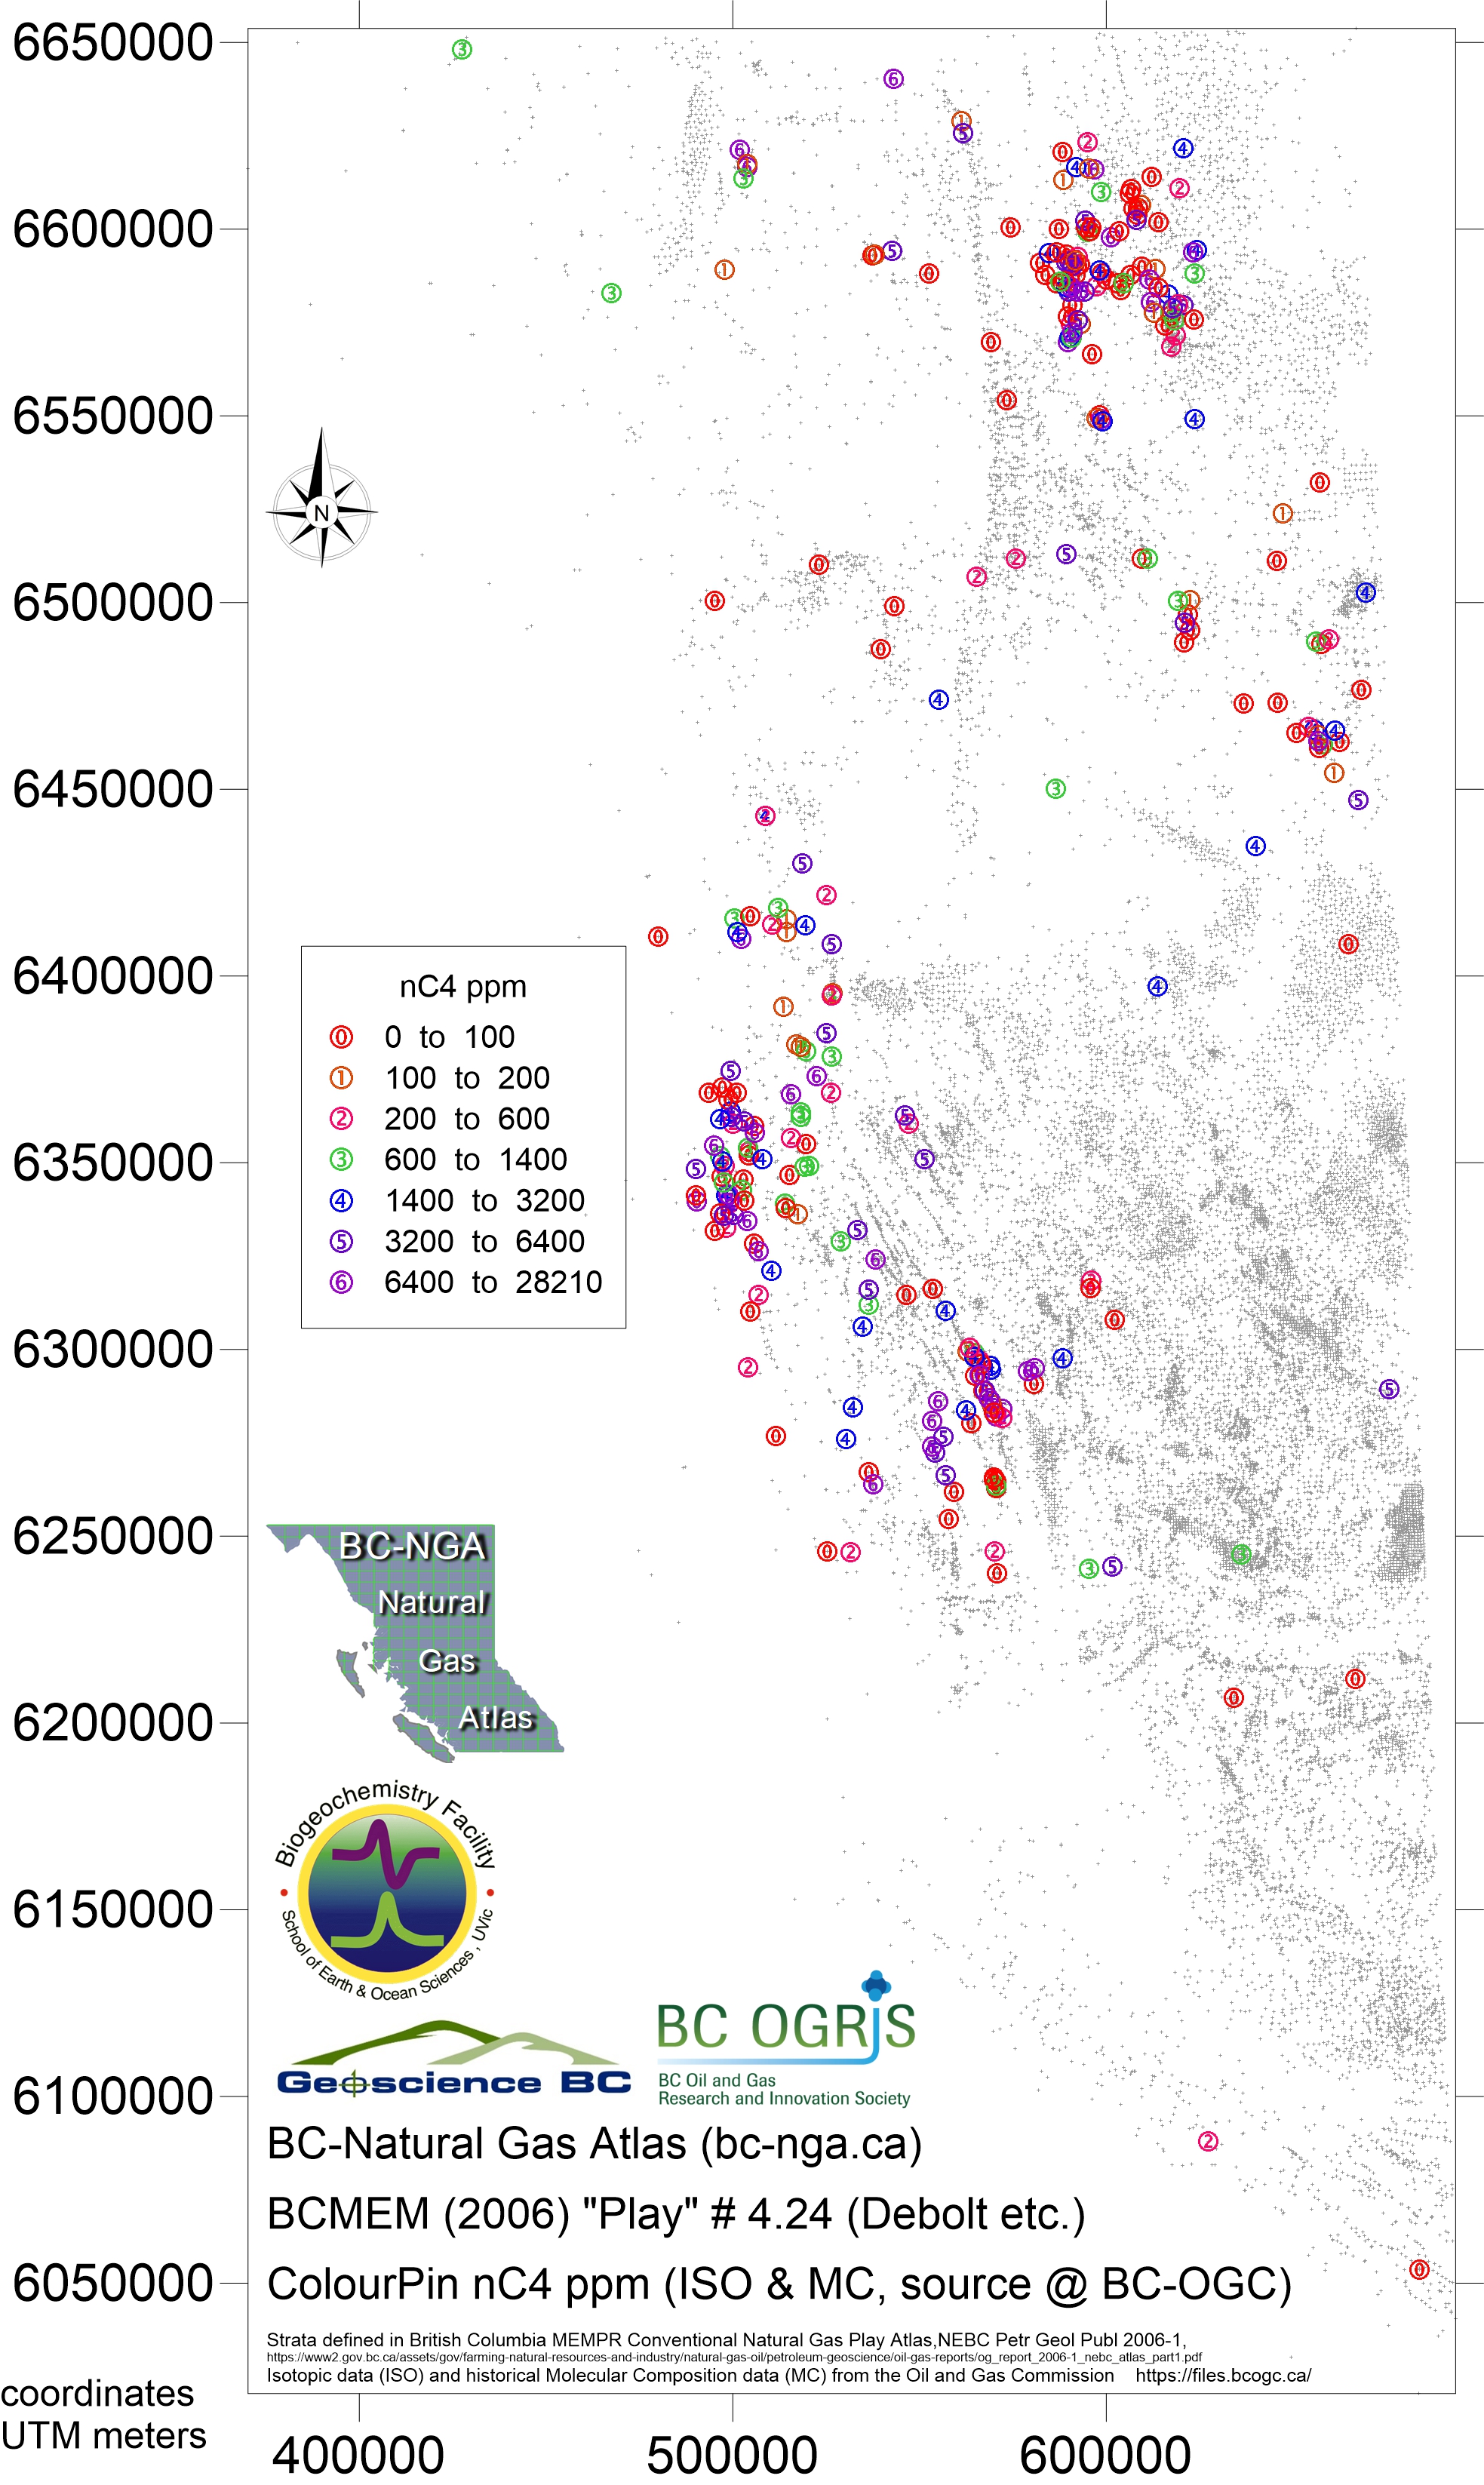
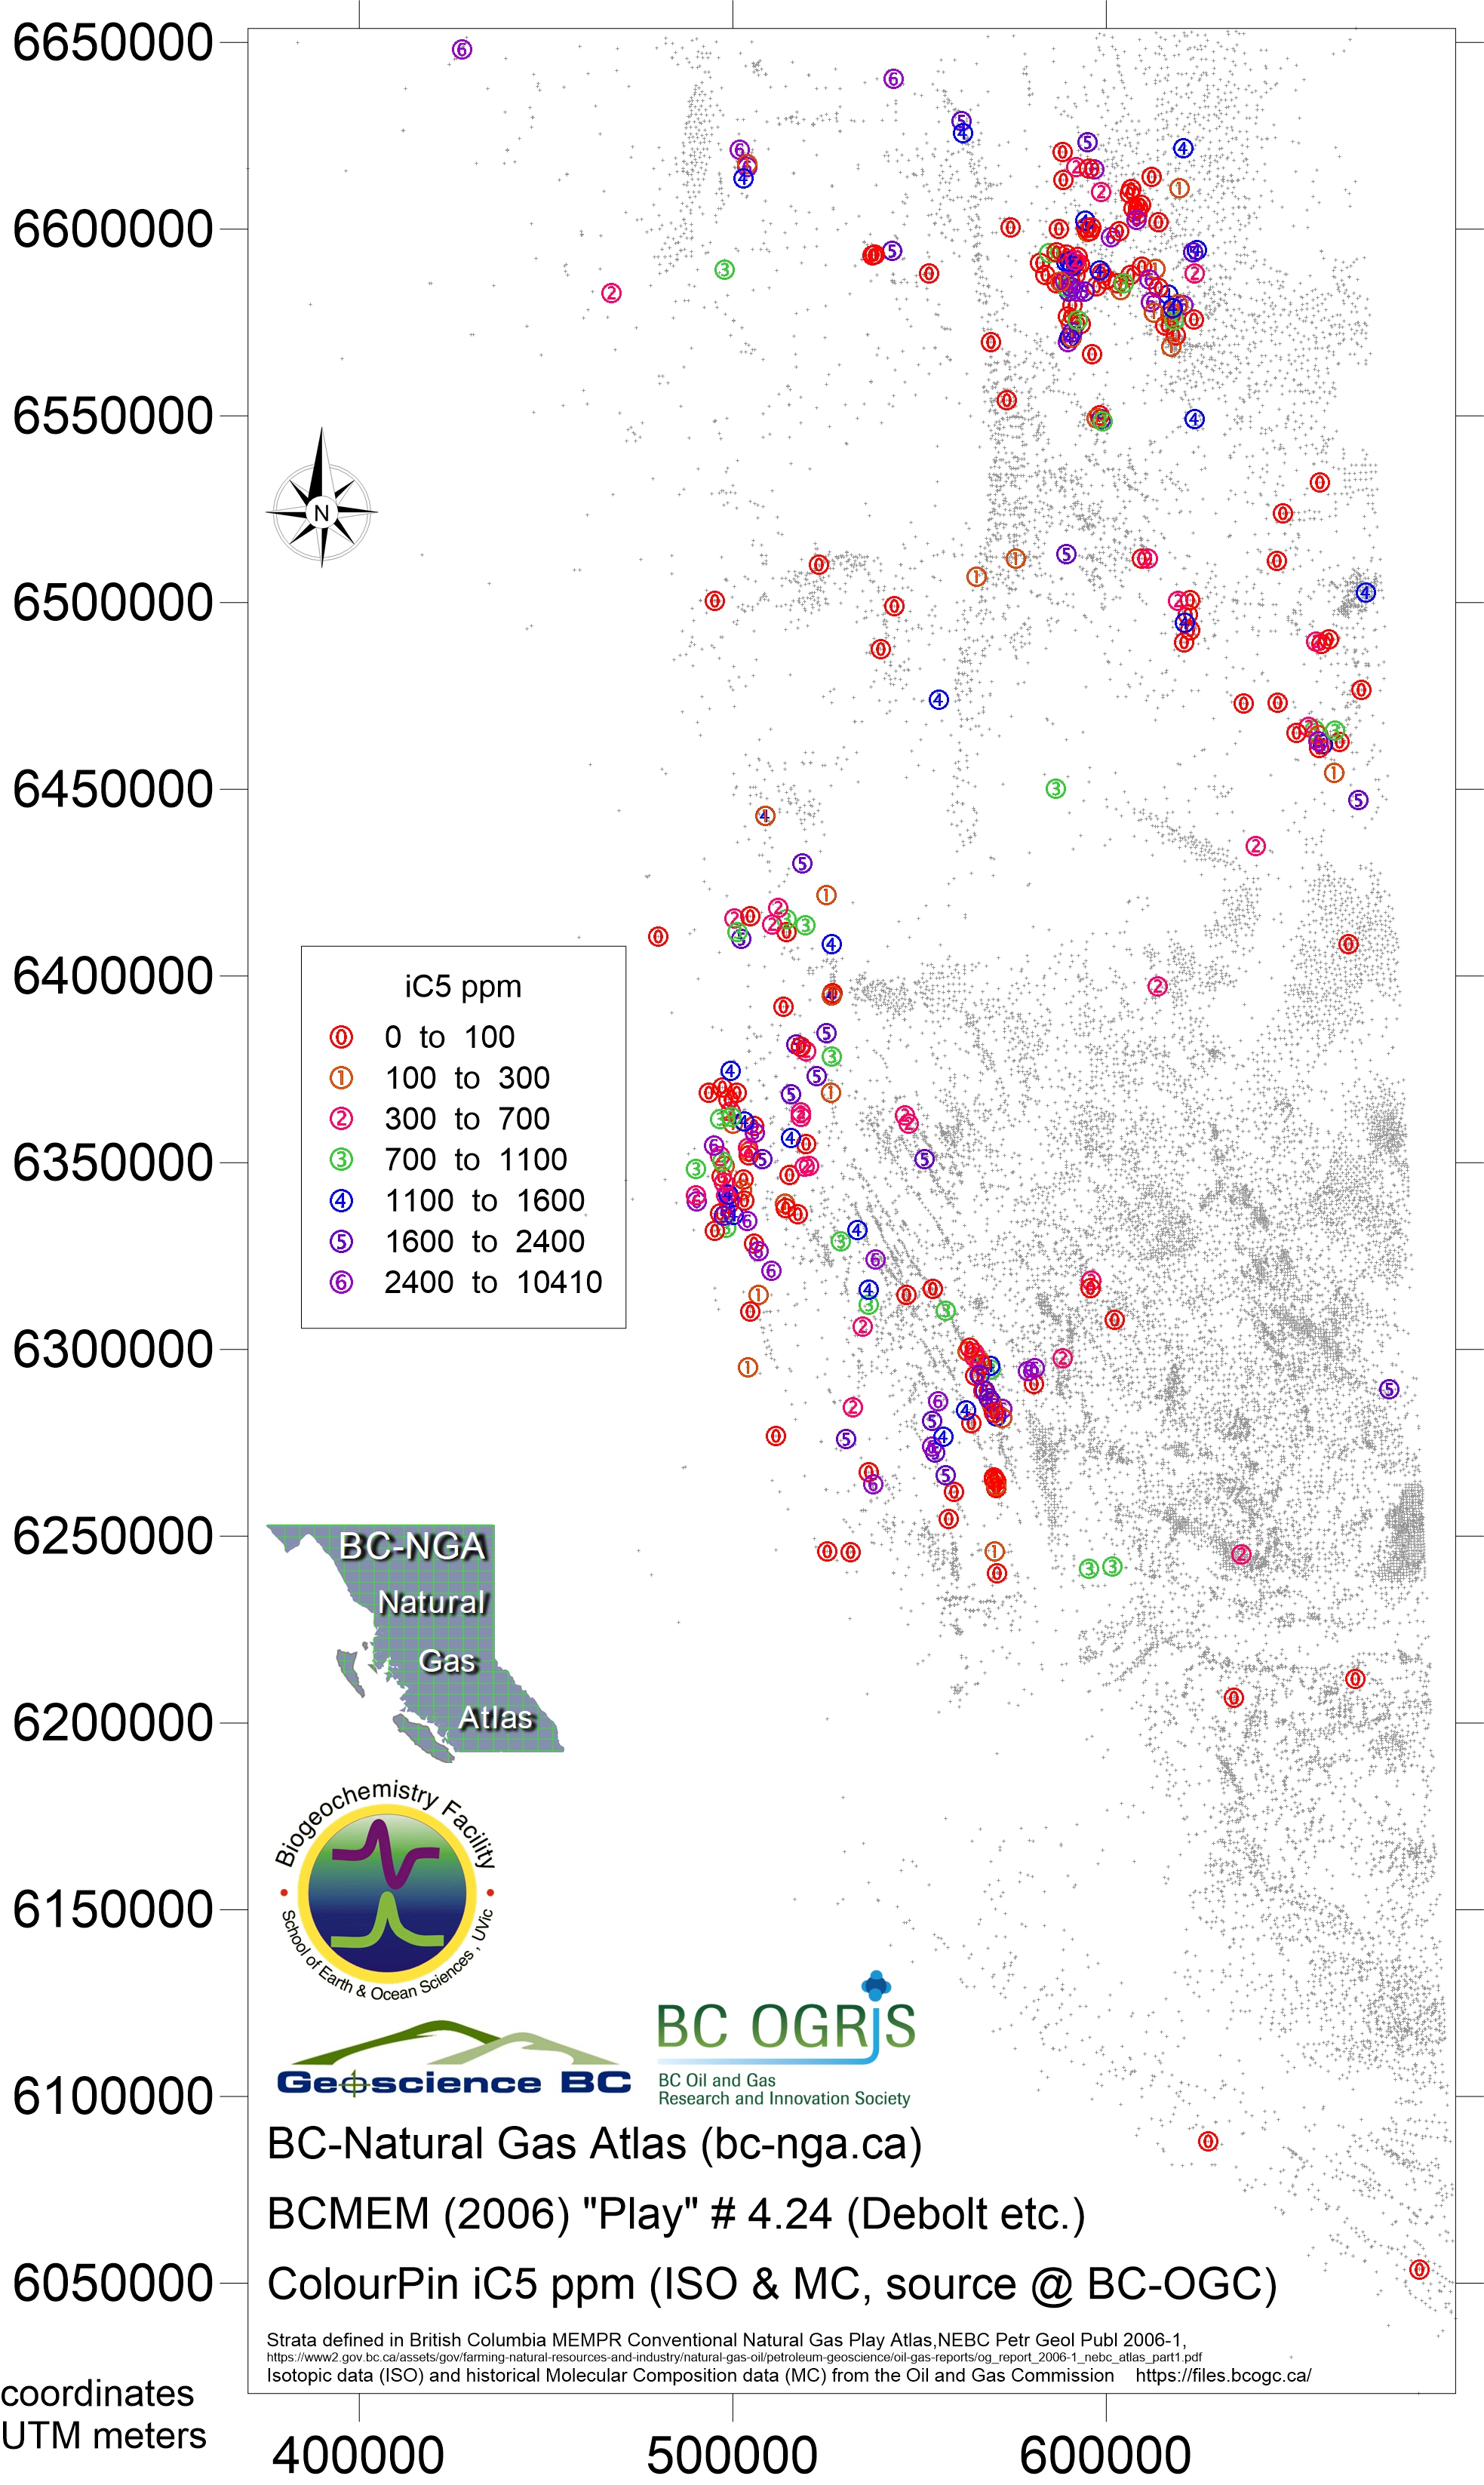
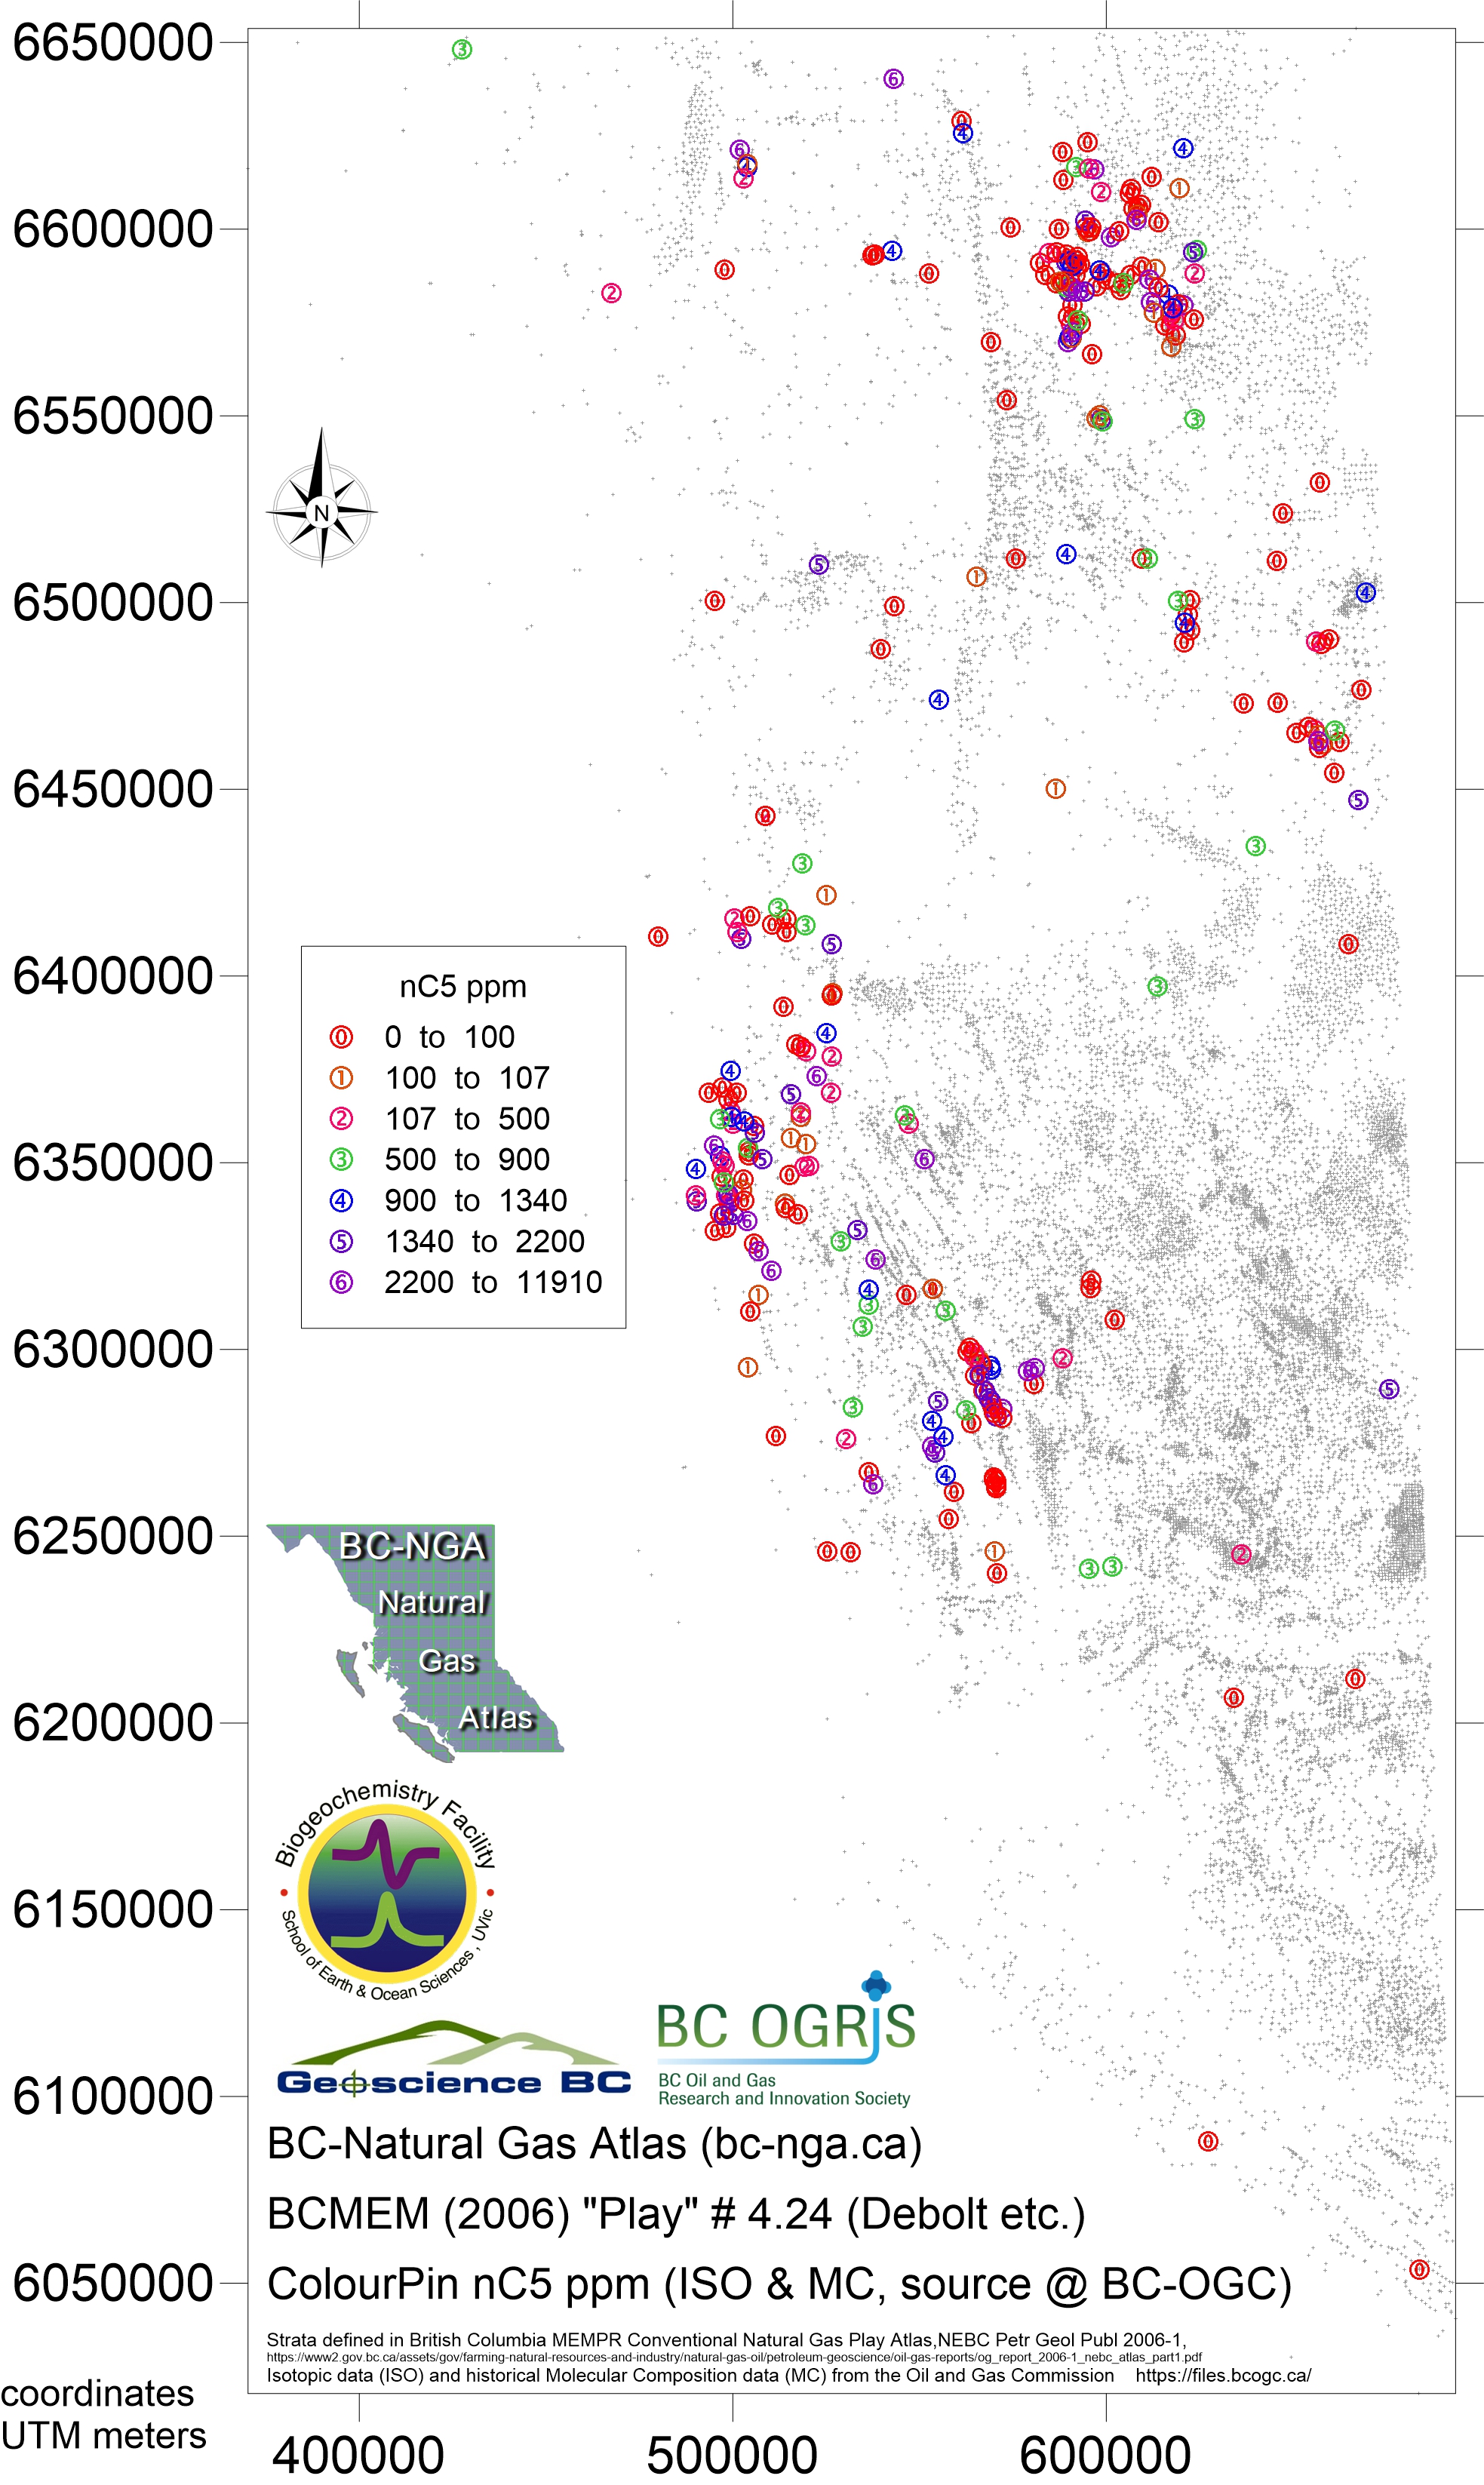
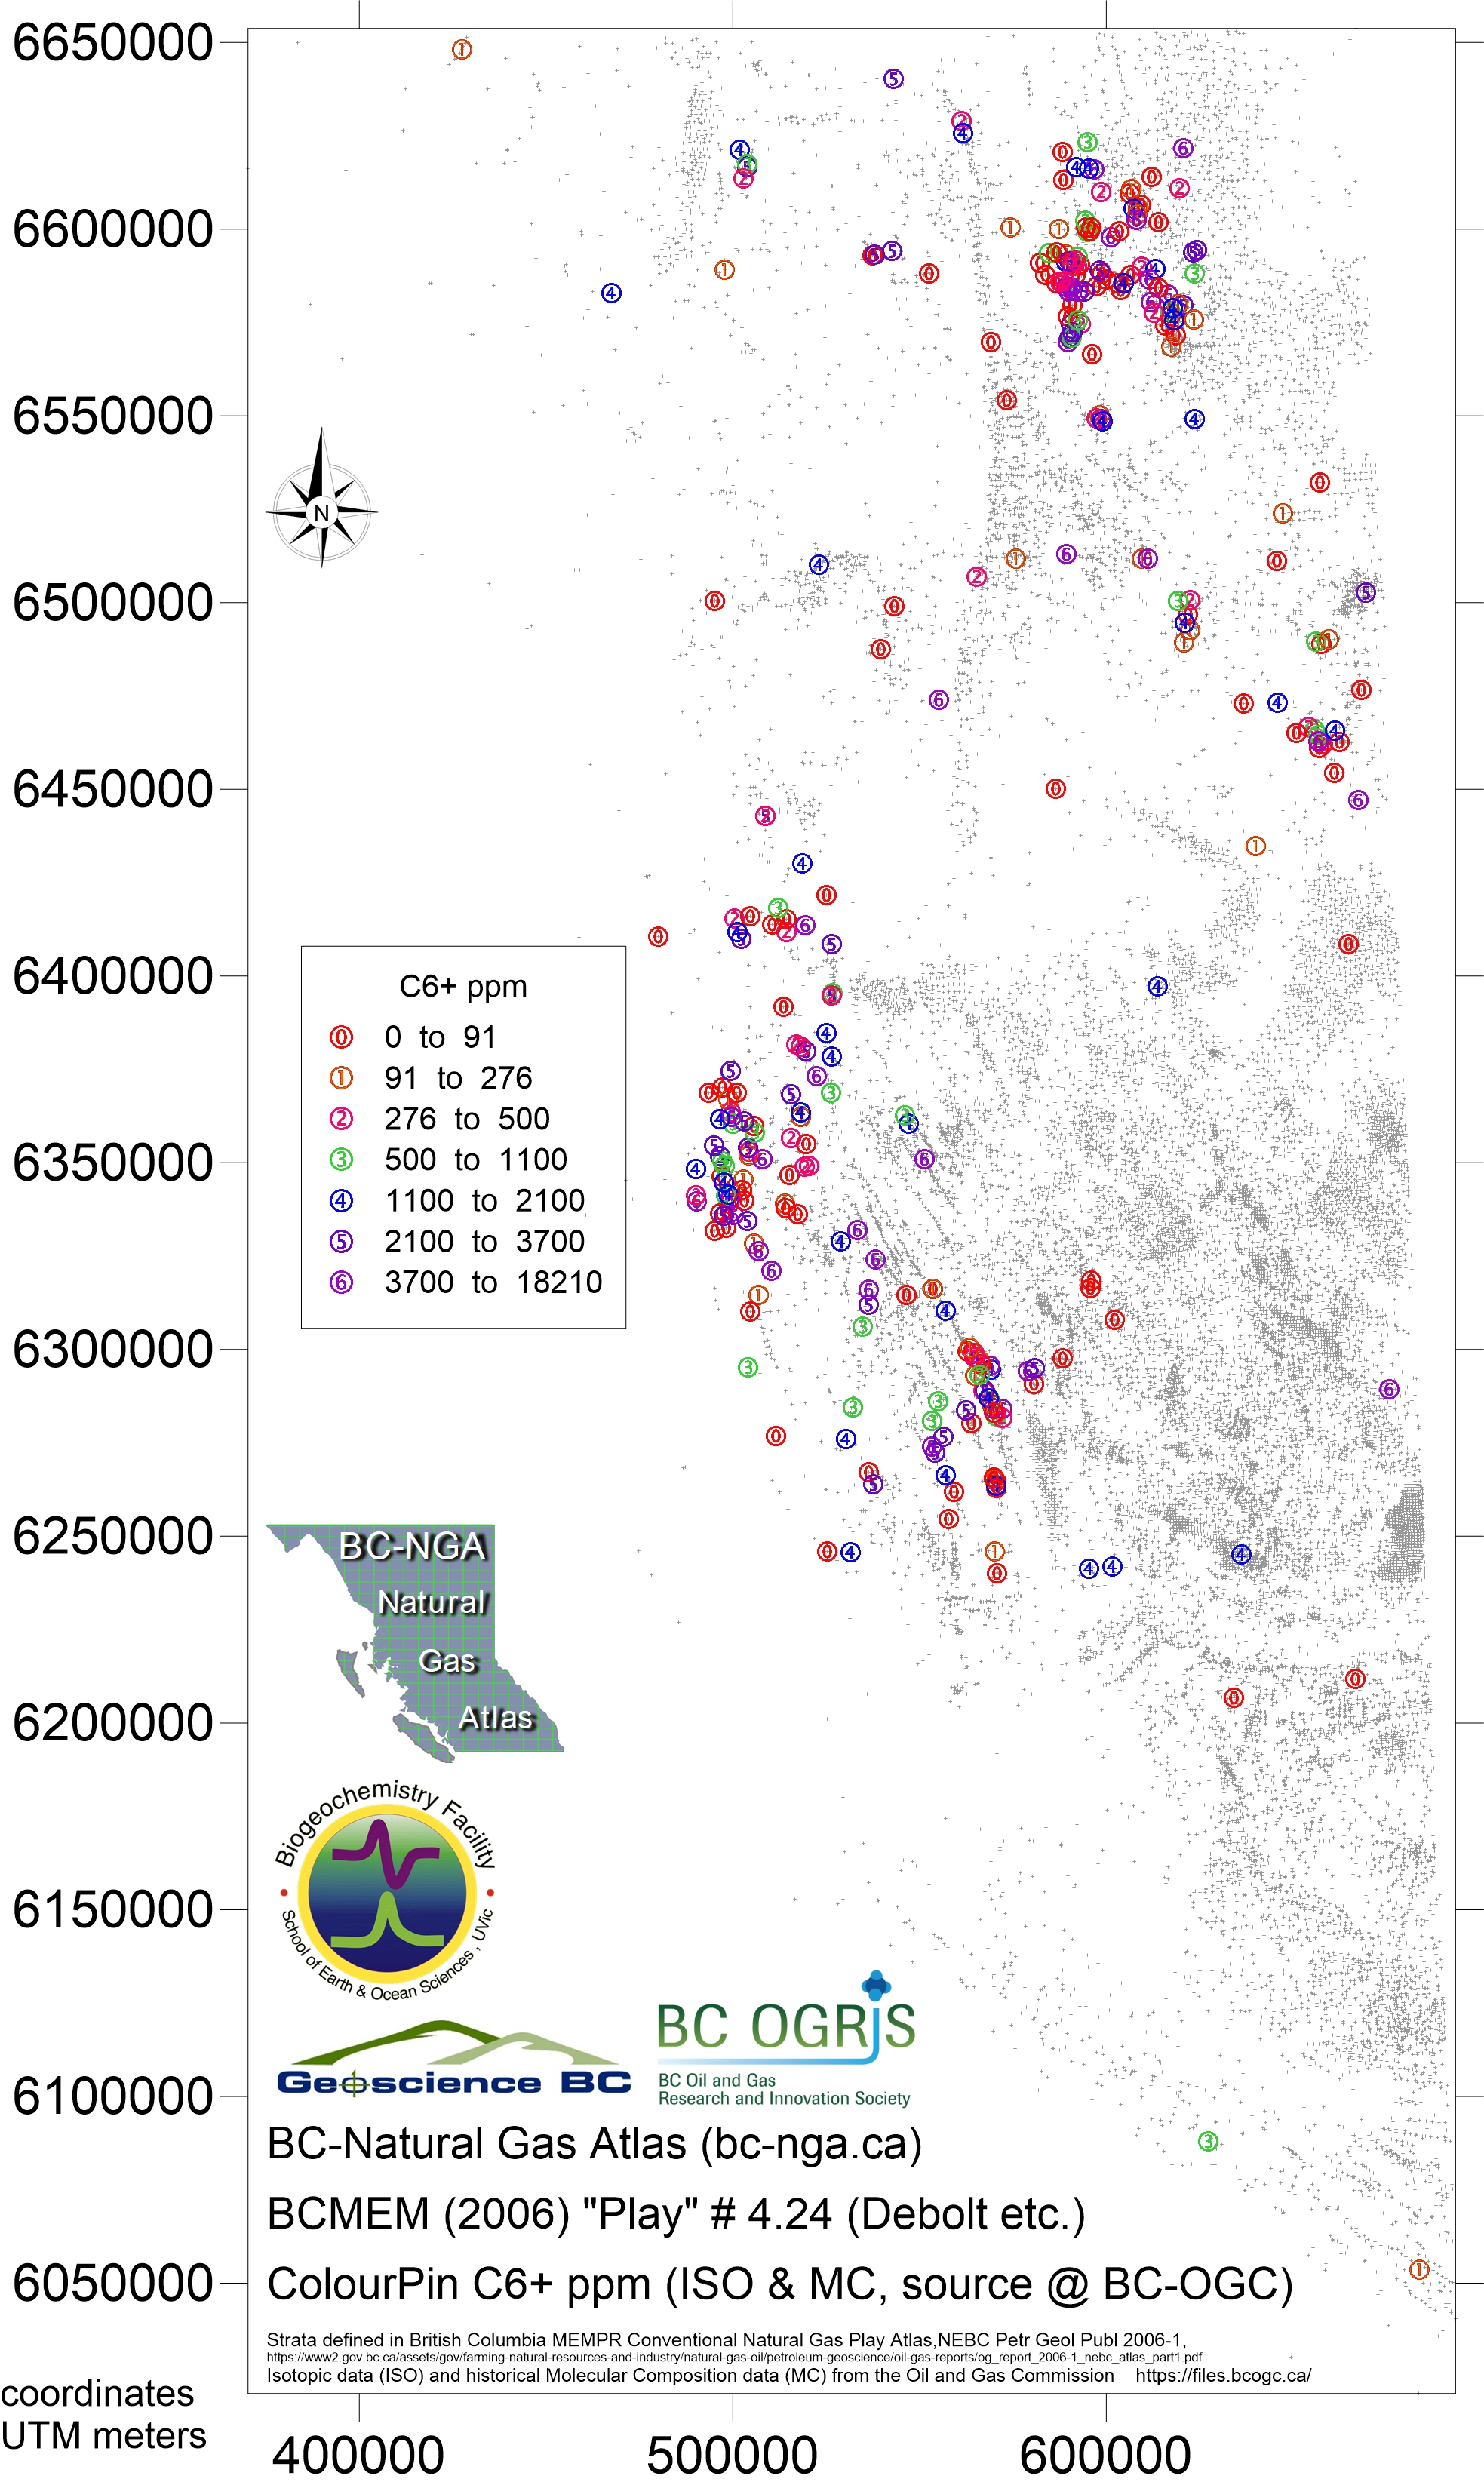
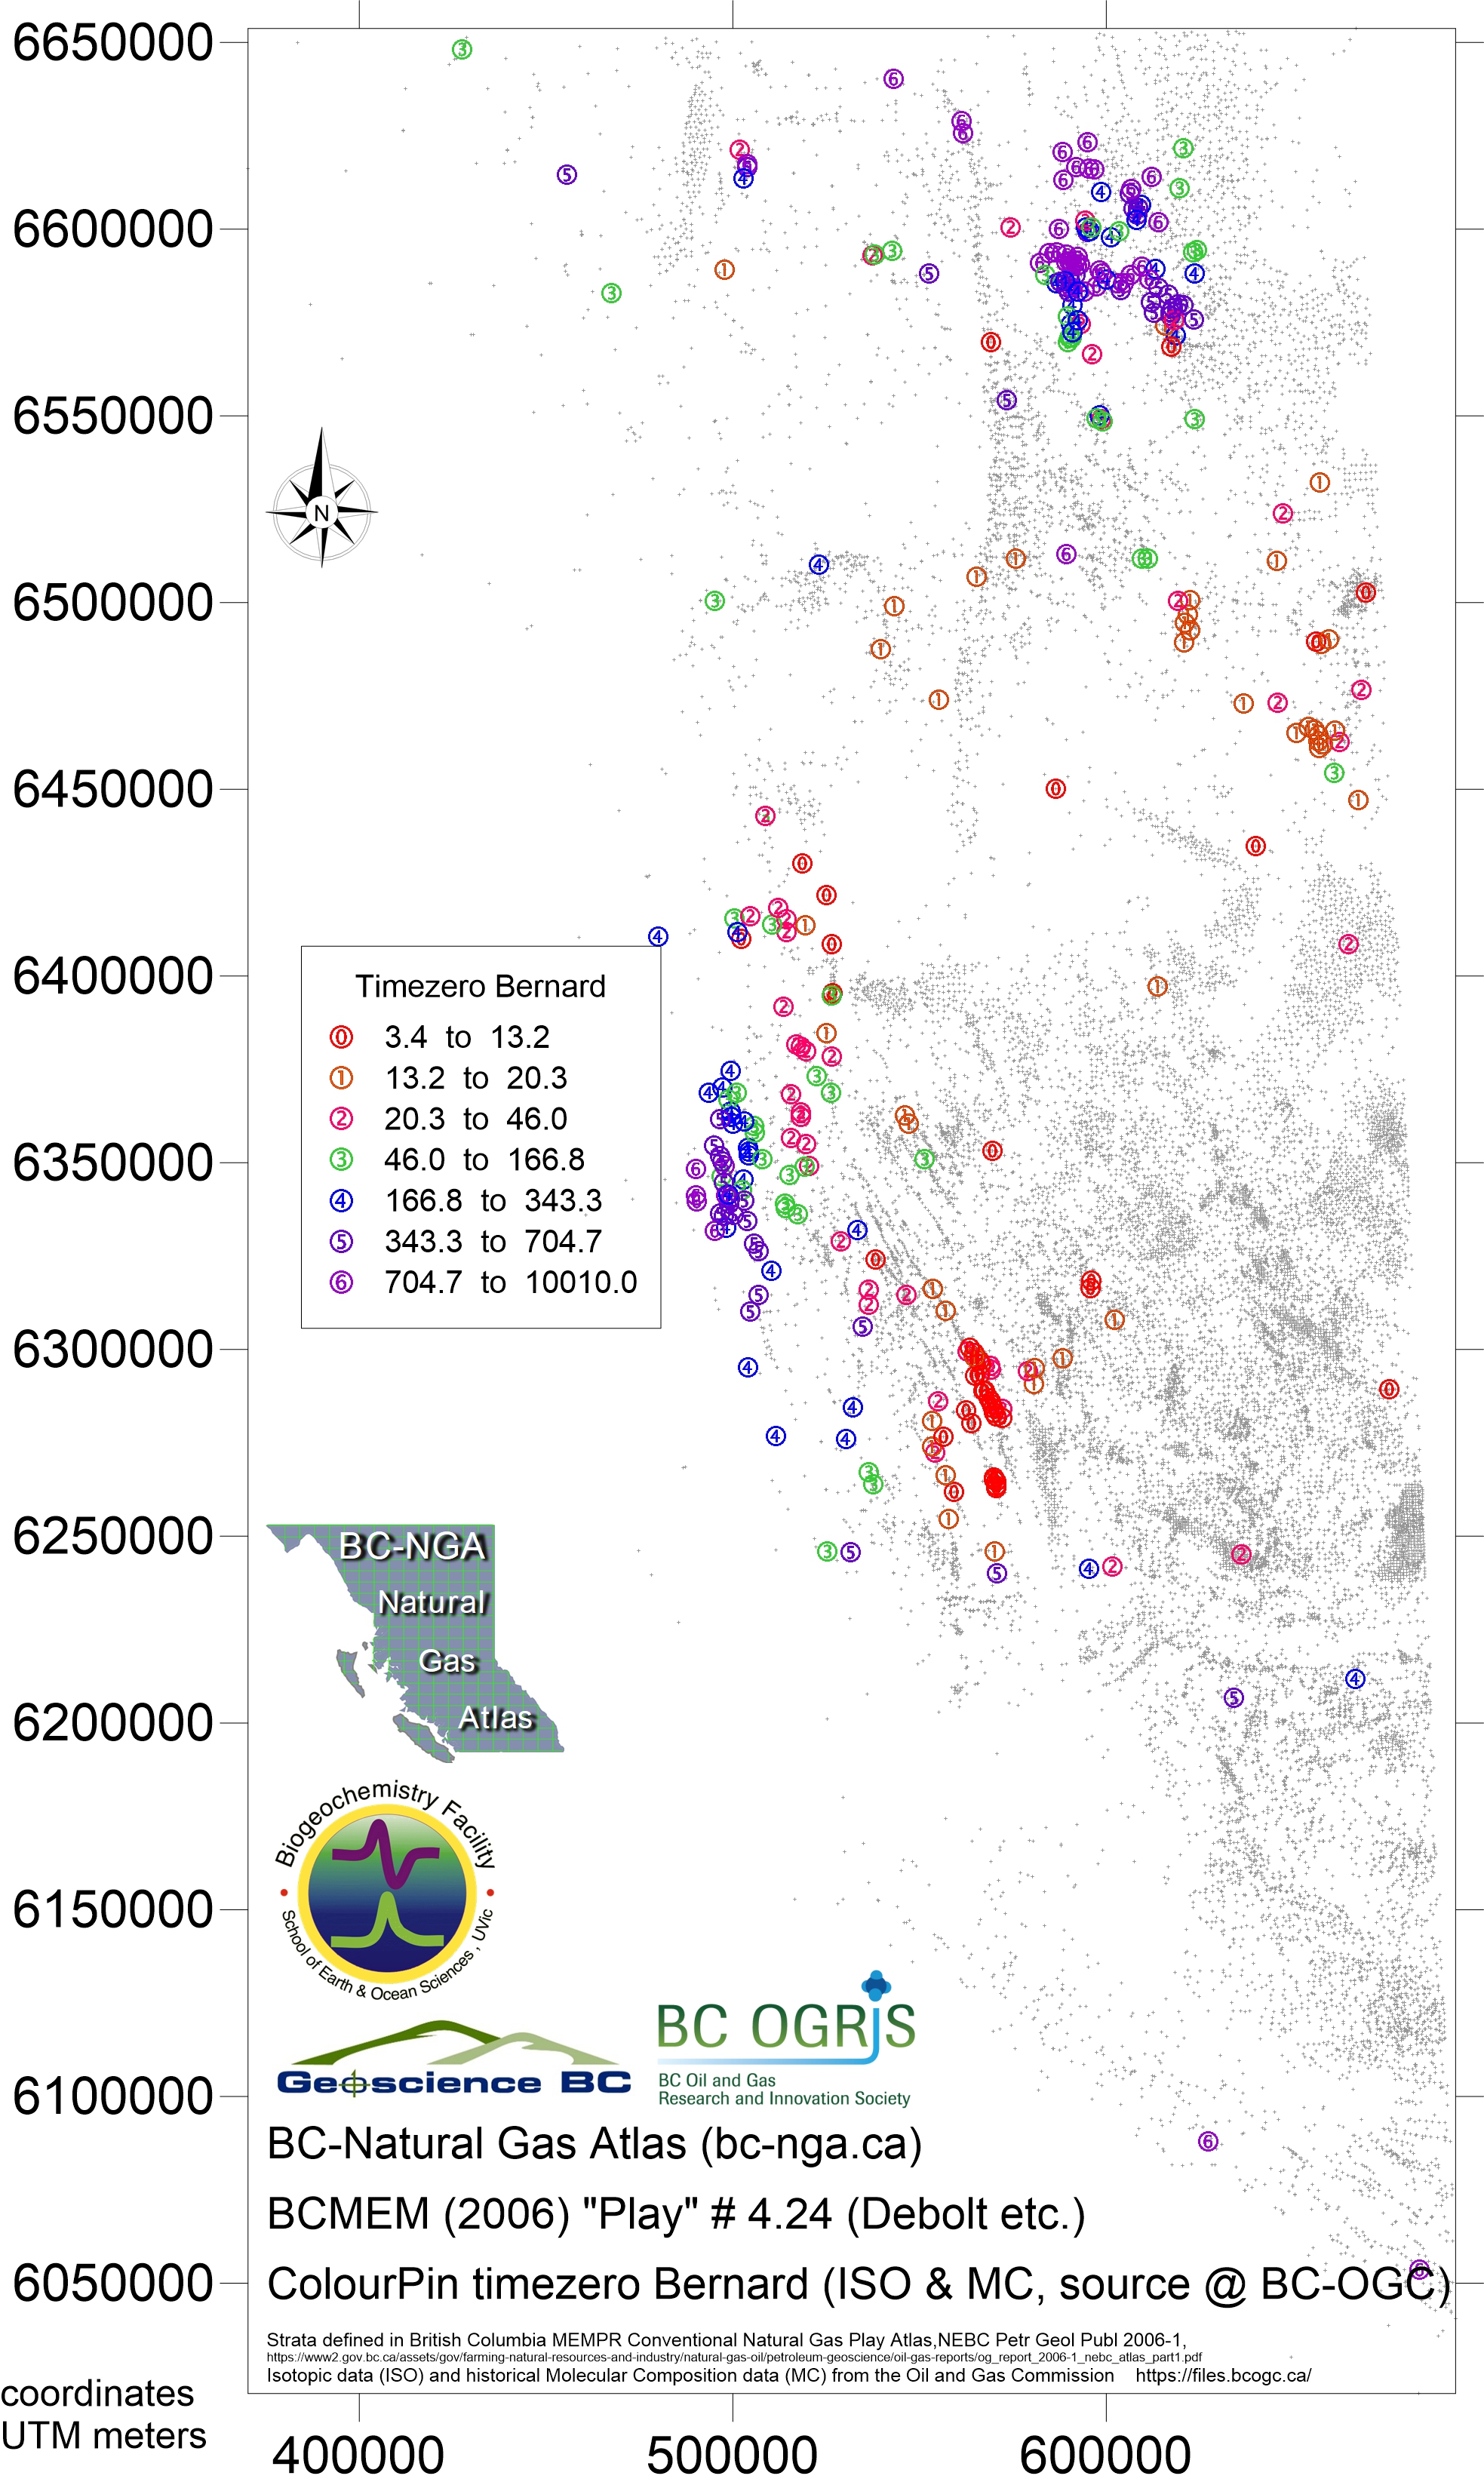
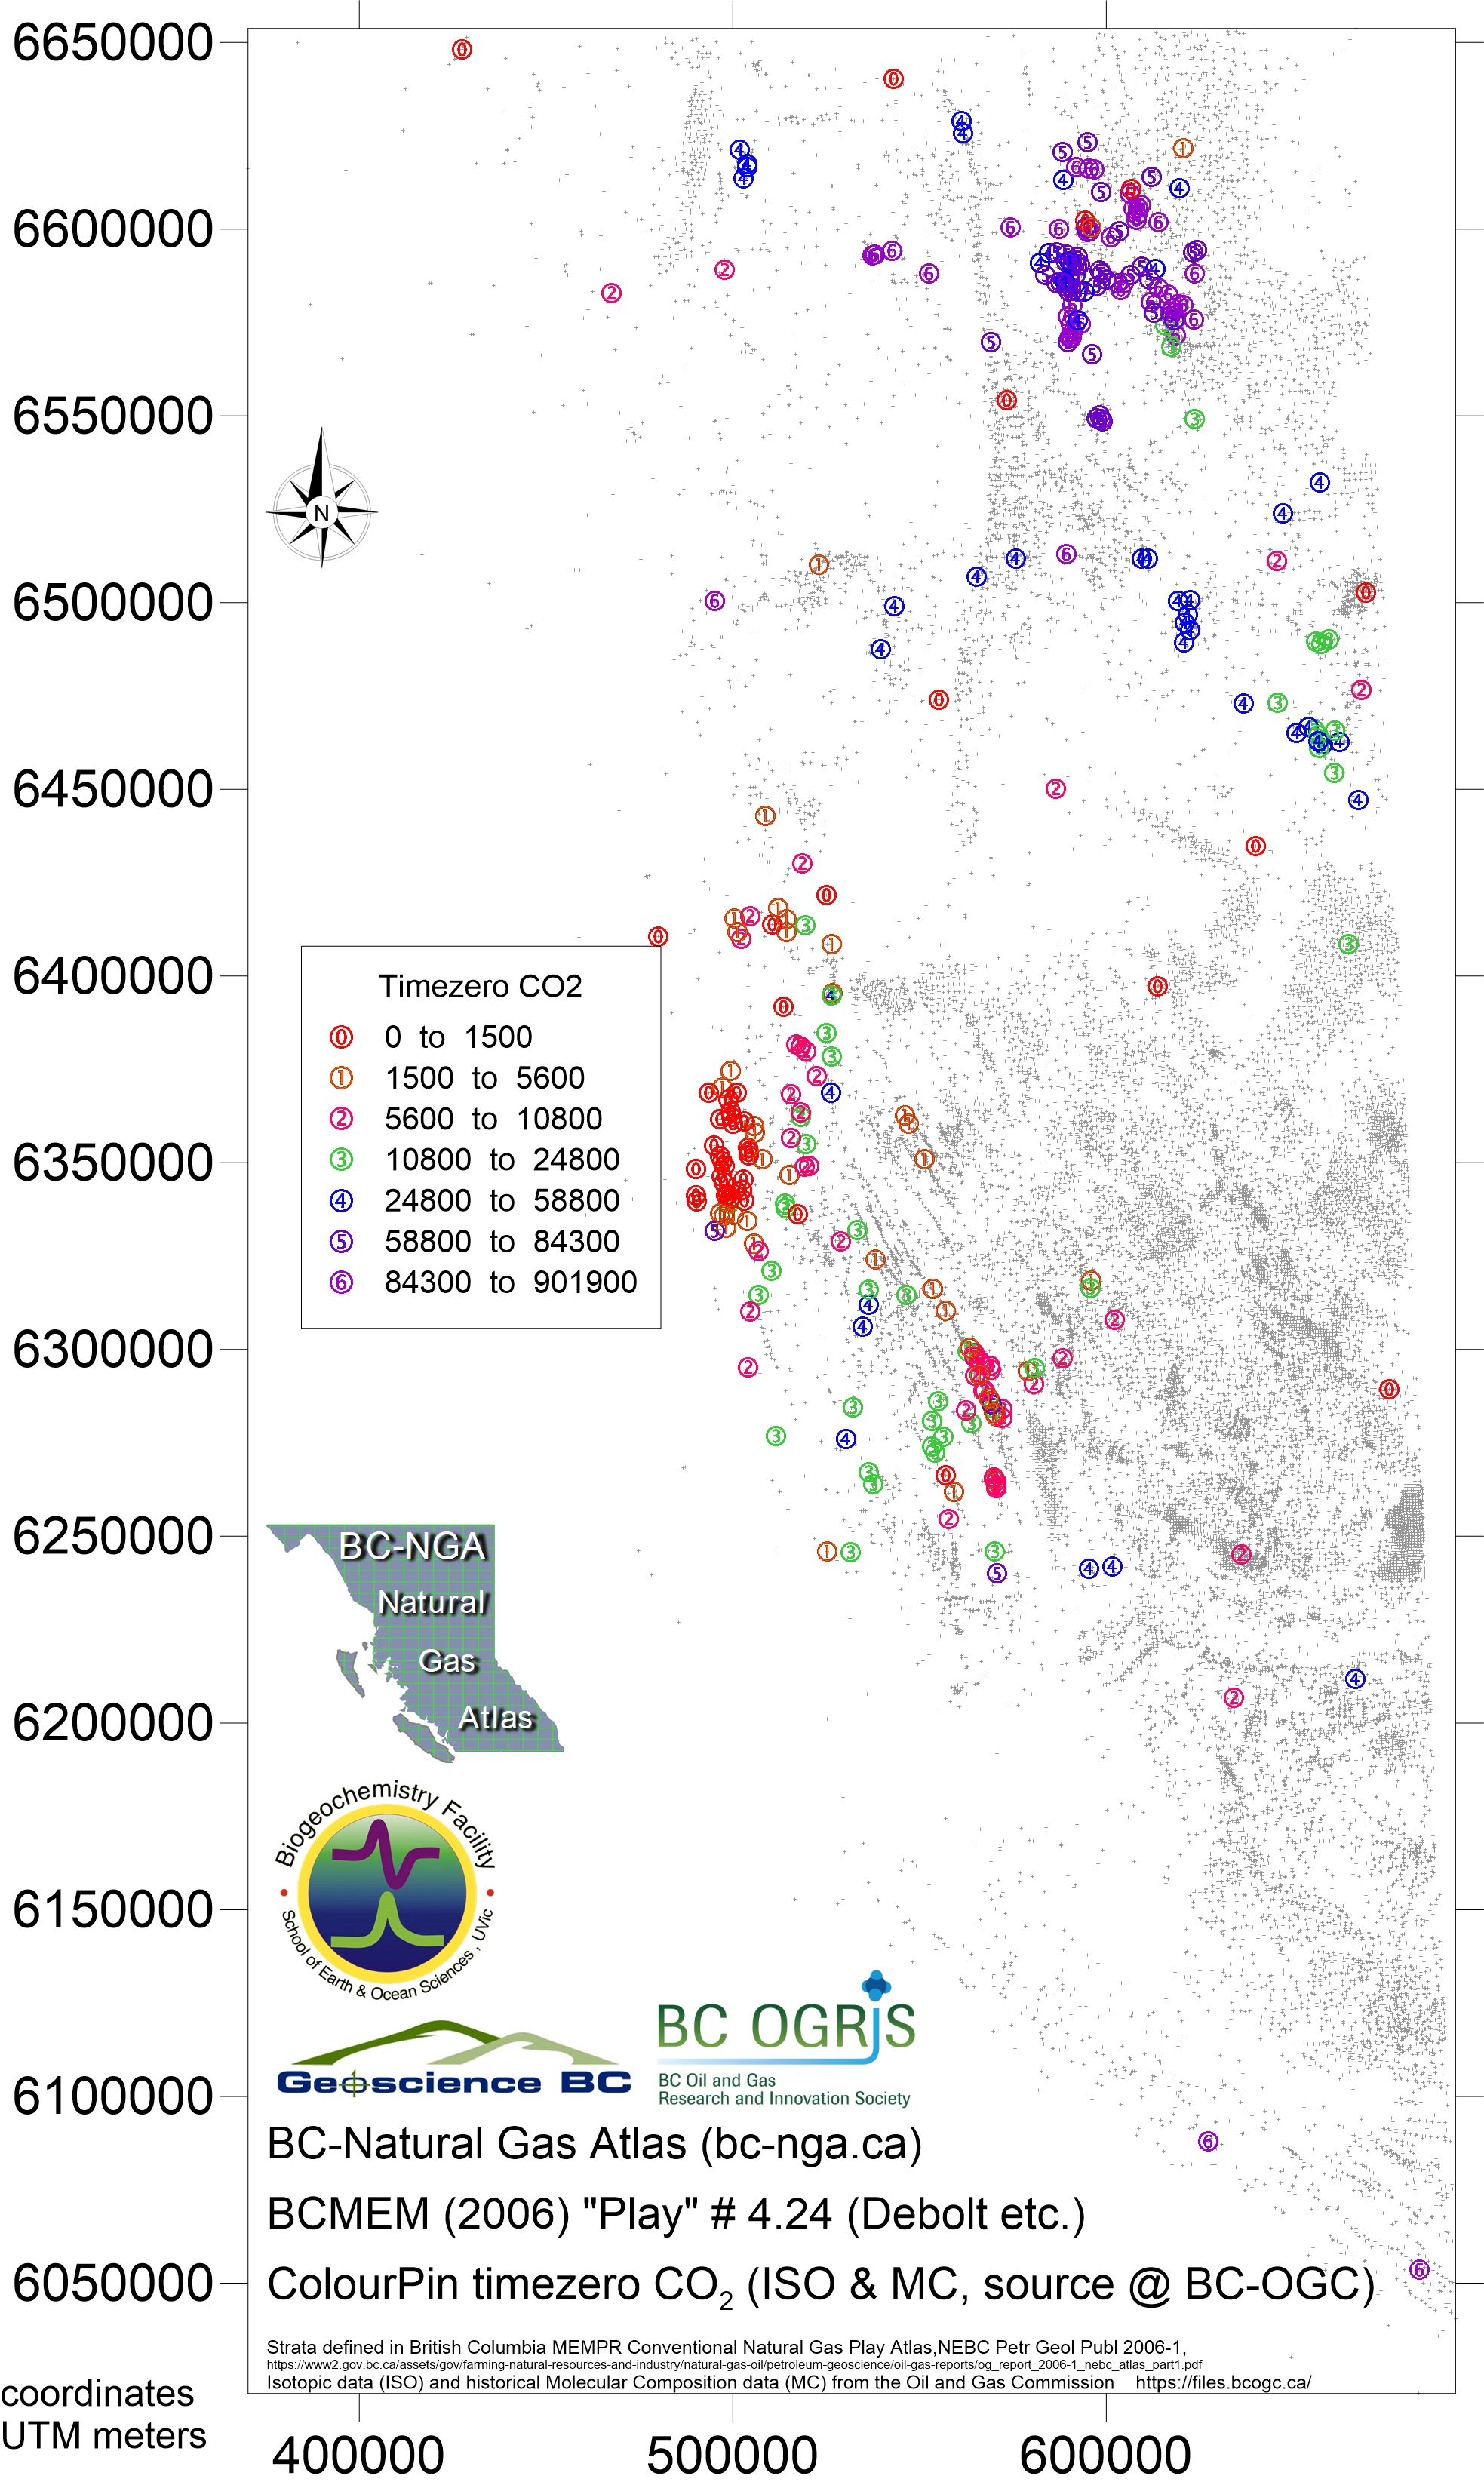
Play 4.24 Debolt / Shunda Formations and equivalents
- Map268 Nov 2018 play 4.24 Debolt eqv Bernard ratio
- Map269 Nov 2018 play 4.24 Debolt eqv dryness ratio
- Map270 Nov 2018 play 4.24 Debolt eqv iC4nC4 ratio
- Map271 Nov 2018 play 4.24 Debolt eqv ISO ratio
- Map272 Nov 2018 play 4.24 Debolt eqv H2S ppm
- Map273 Nov 2018 play 4.24 Debolt eqv CH4 ppm
- Map274 Nov 2018 play 4.24 Debolt eqv C2H6 ppm
- Map275 Nov 2018 play 4.24 Debolt eqv C3H8 ppm
- Map276 Nov 2018 play 4.24 Debolt eqv iC4H10 ppm
- Map277 Nov 2018 play 4.24 Debolt eqv nC4H10 ppm
- Map278 Nov 2018 play 4.24 Debolt eqv iC5H12 ppm
- Map279 Nov 2018 play 4.24 Debolt eqv nC5H12 ppm
- Map280 Nov 2018 play 4.24 Debolt eqv C6H14 plus ppm
- Map281 Nov 2018 play 4.24 Debolt eqv CO2 ppm
- Map282 Nov 2018 play 4.24 Debolt eqv δ13CH4
- Map283 Nov 2018 play 4.24 Debolt eqv δ13C2H6
- Map284 Nov 2018 play 4.24 Debolt eqv time series gradient Bernard ratio
- Map285 Nov 2018 play 4.24 Debolt eqv time series gradient CO2
- Map286 Nov 2018 play 4.24 Debolt eqv time series gradient H2S
- Map287 Nov 2018 play 4.24 Debolt eqv time series start point Bernard ratio
- Map288 Nov 2018 play 4.24 Debolt eqv time series start point CO2
- Map289 Nov 2018 play 4.24 Debolt eqv time series start point H2S
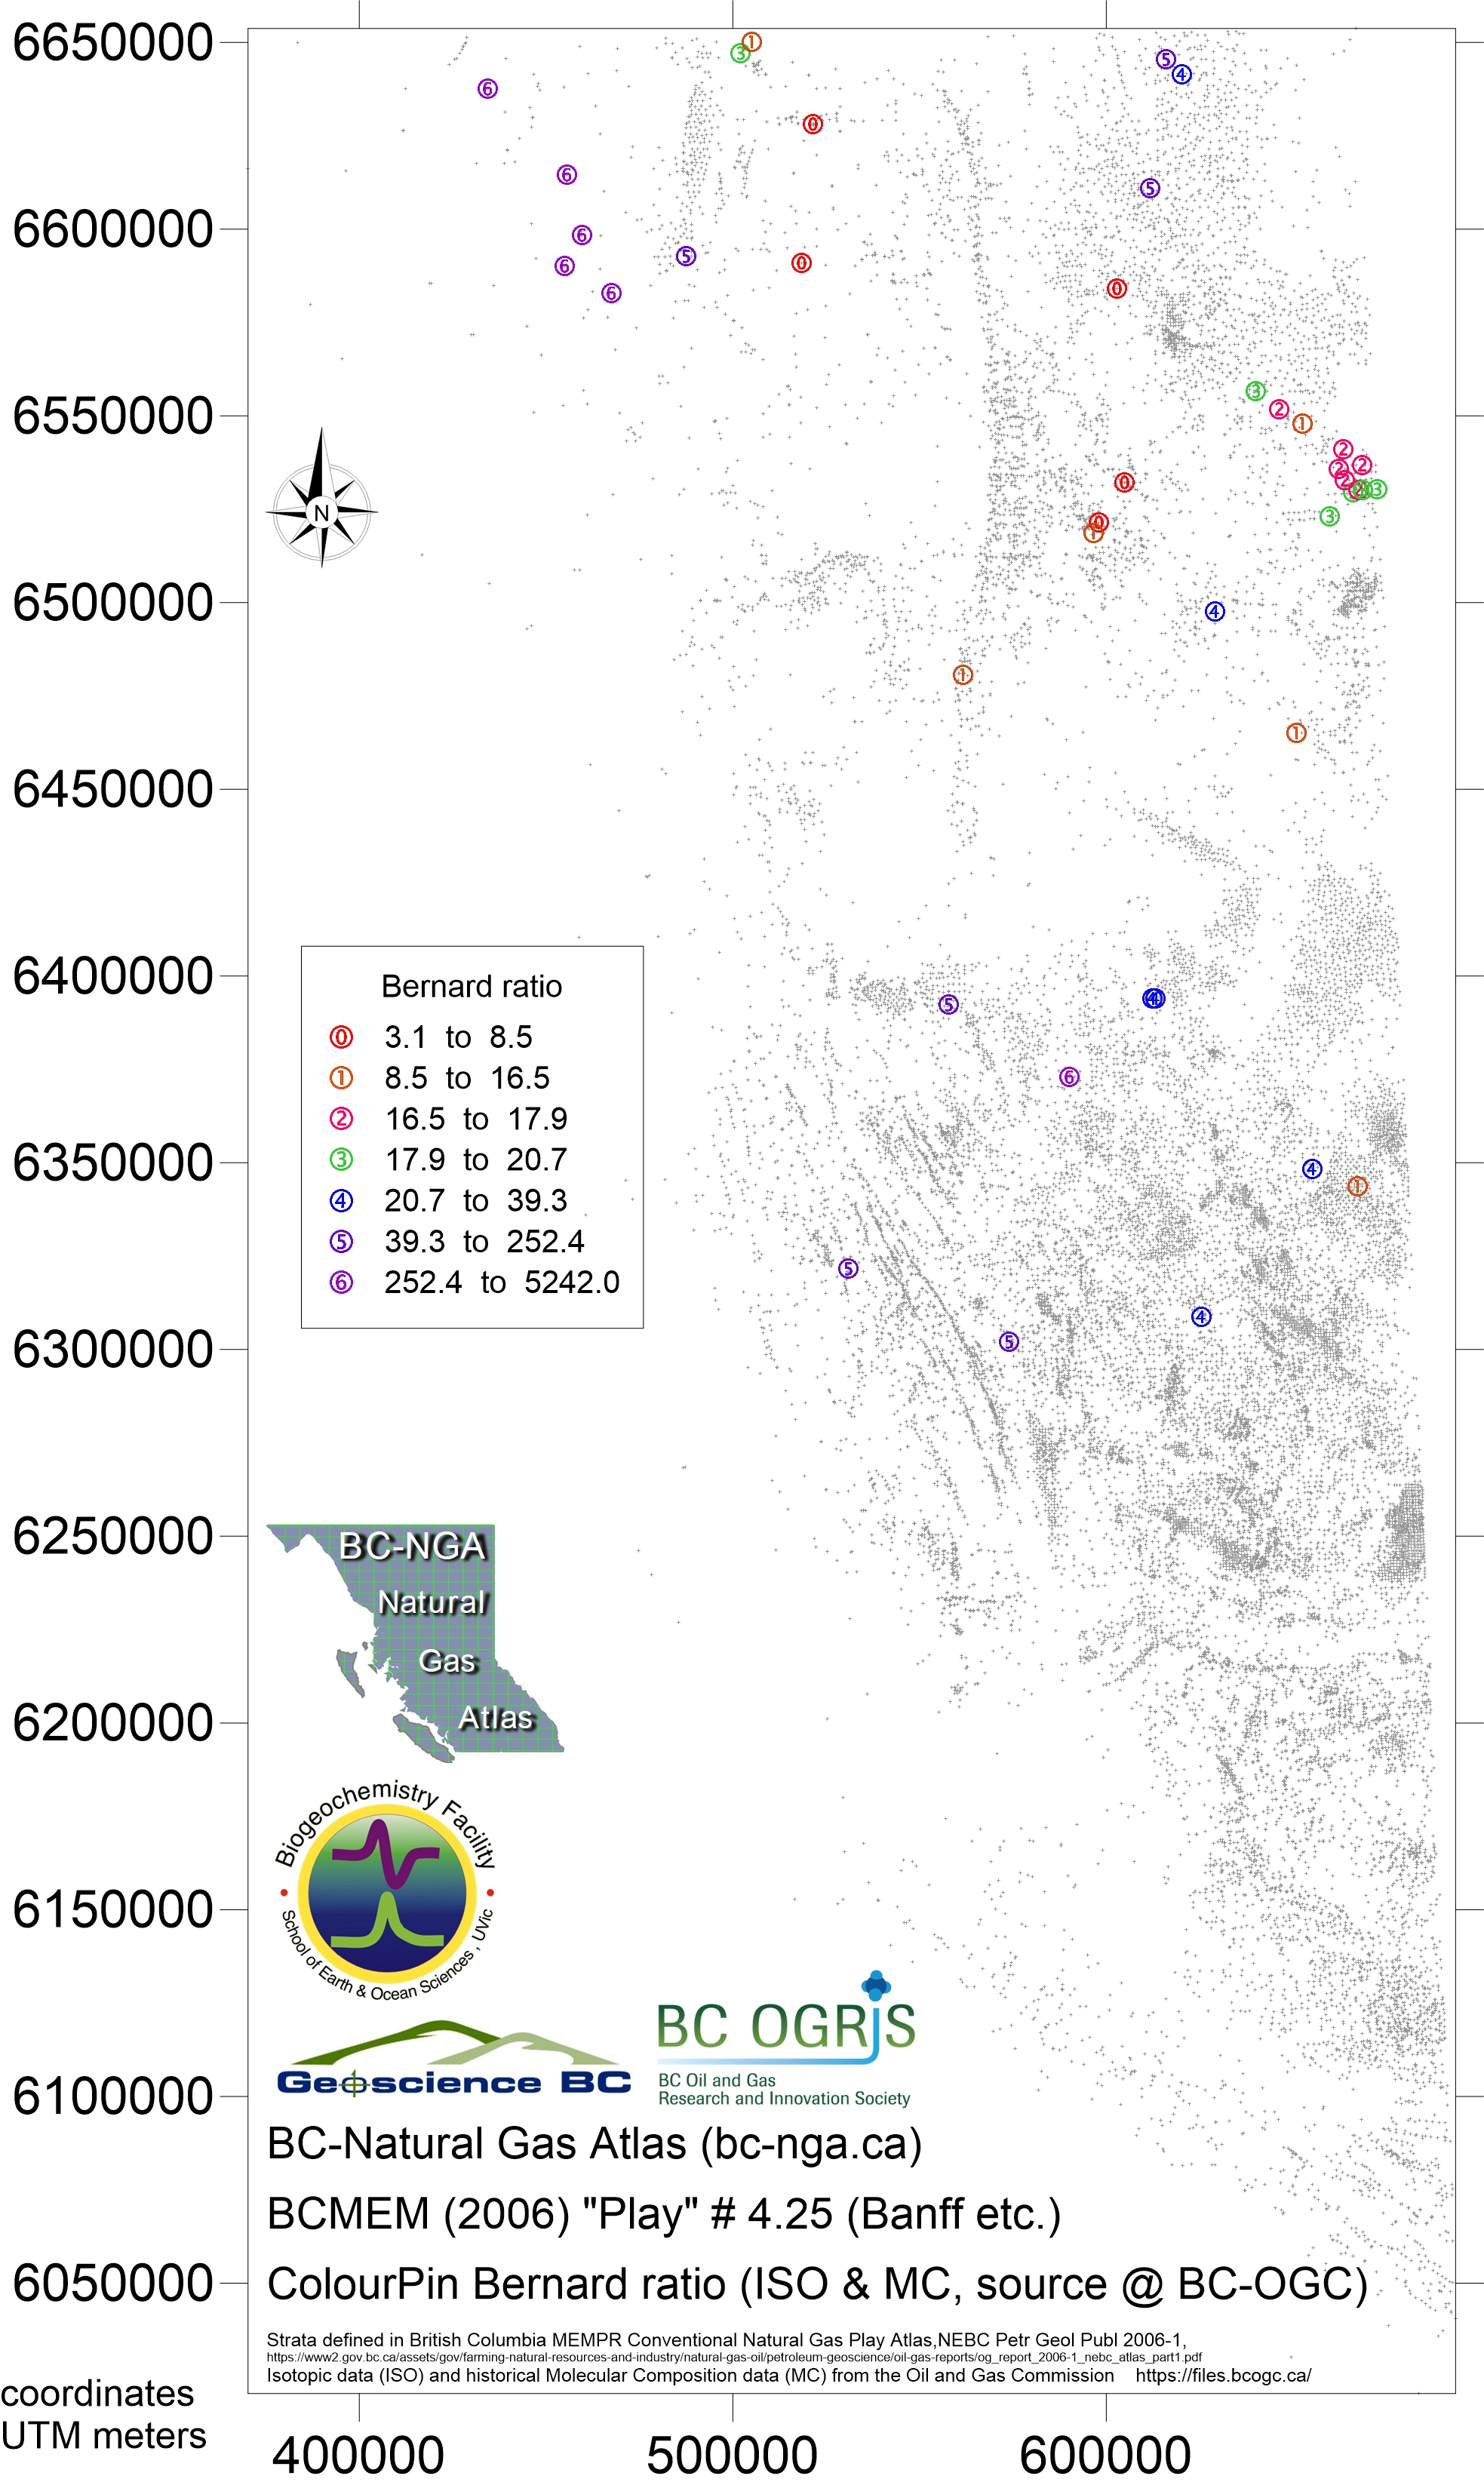
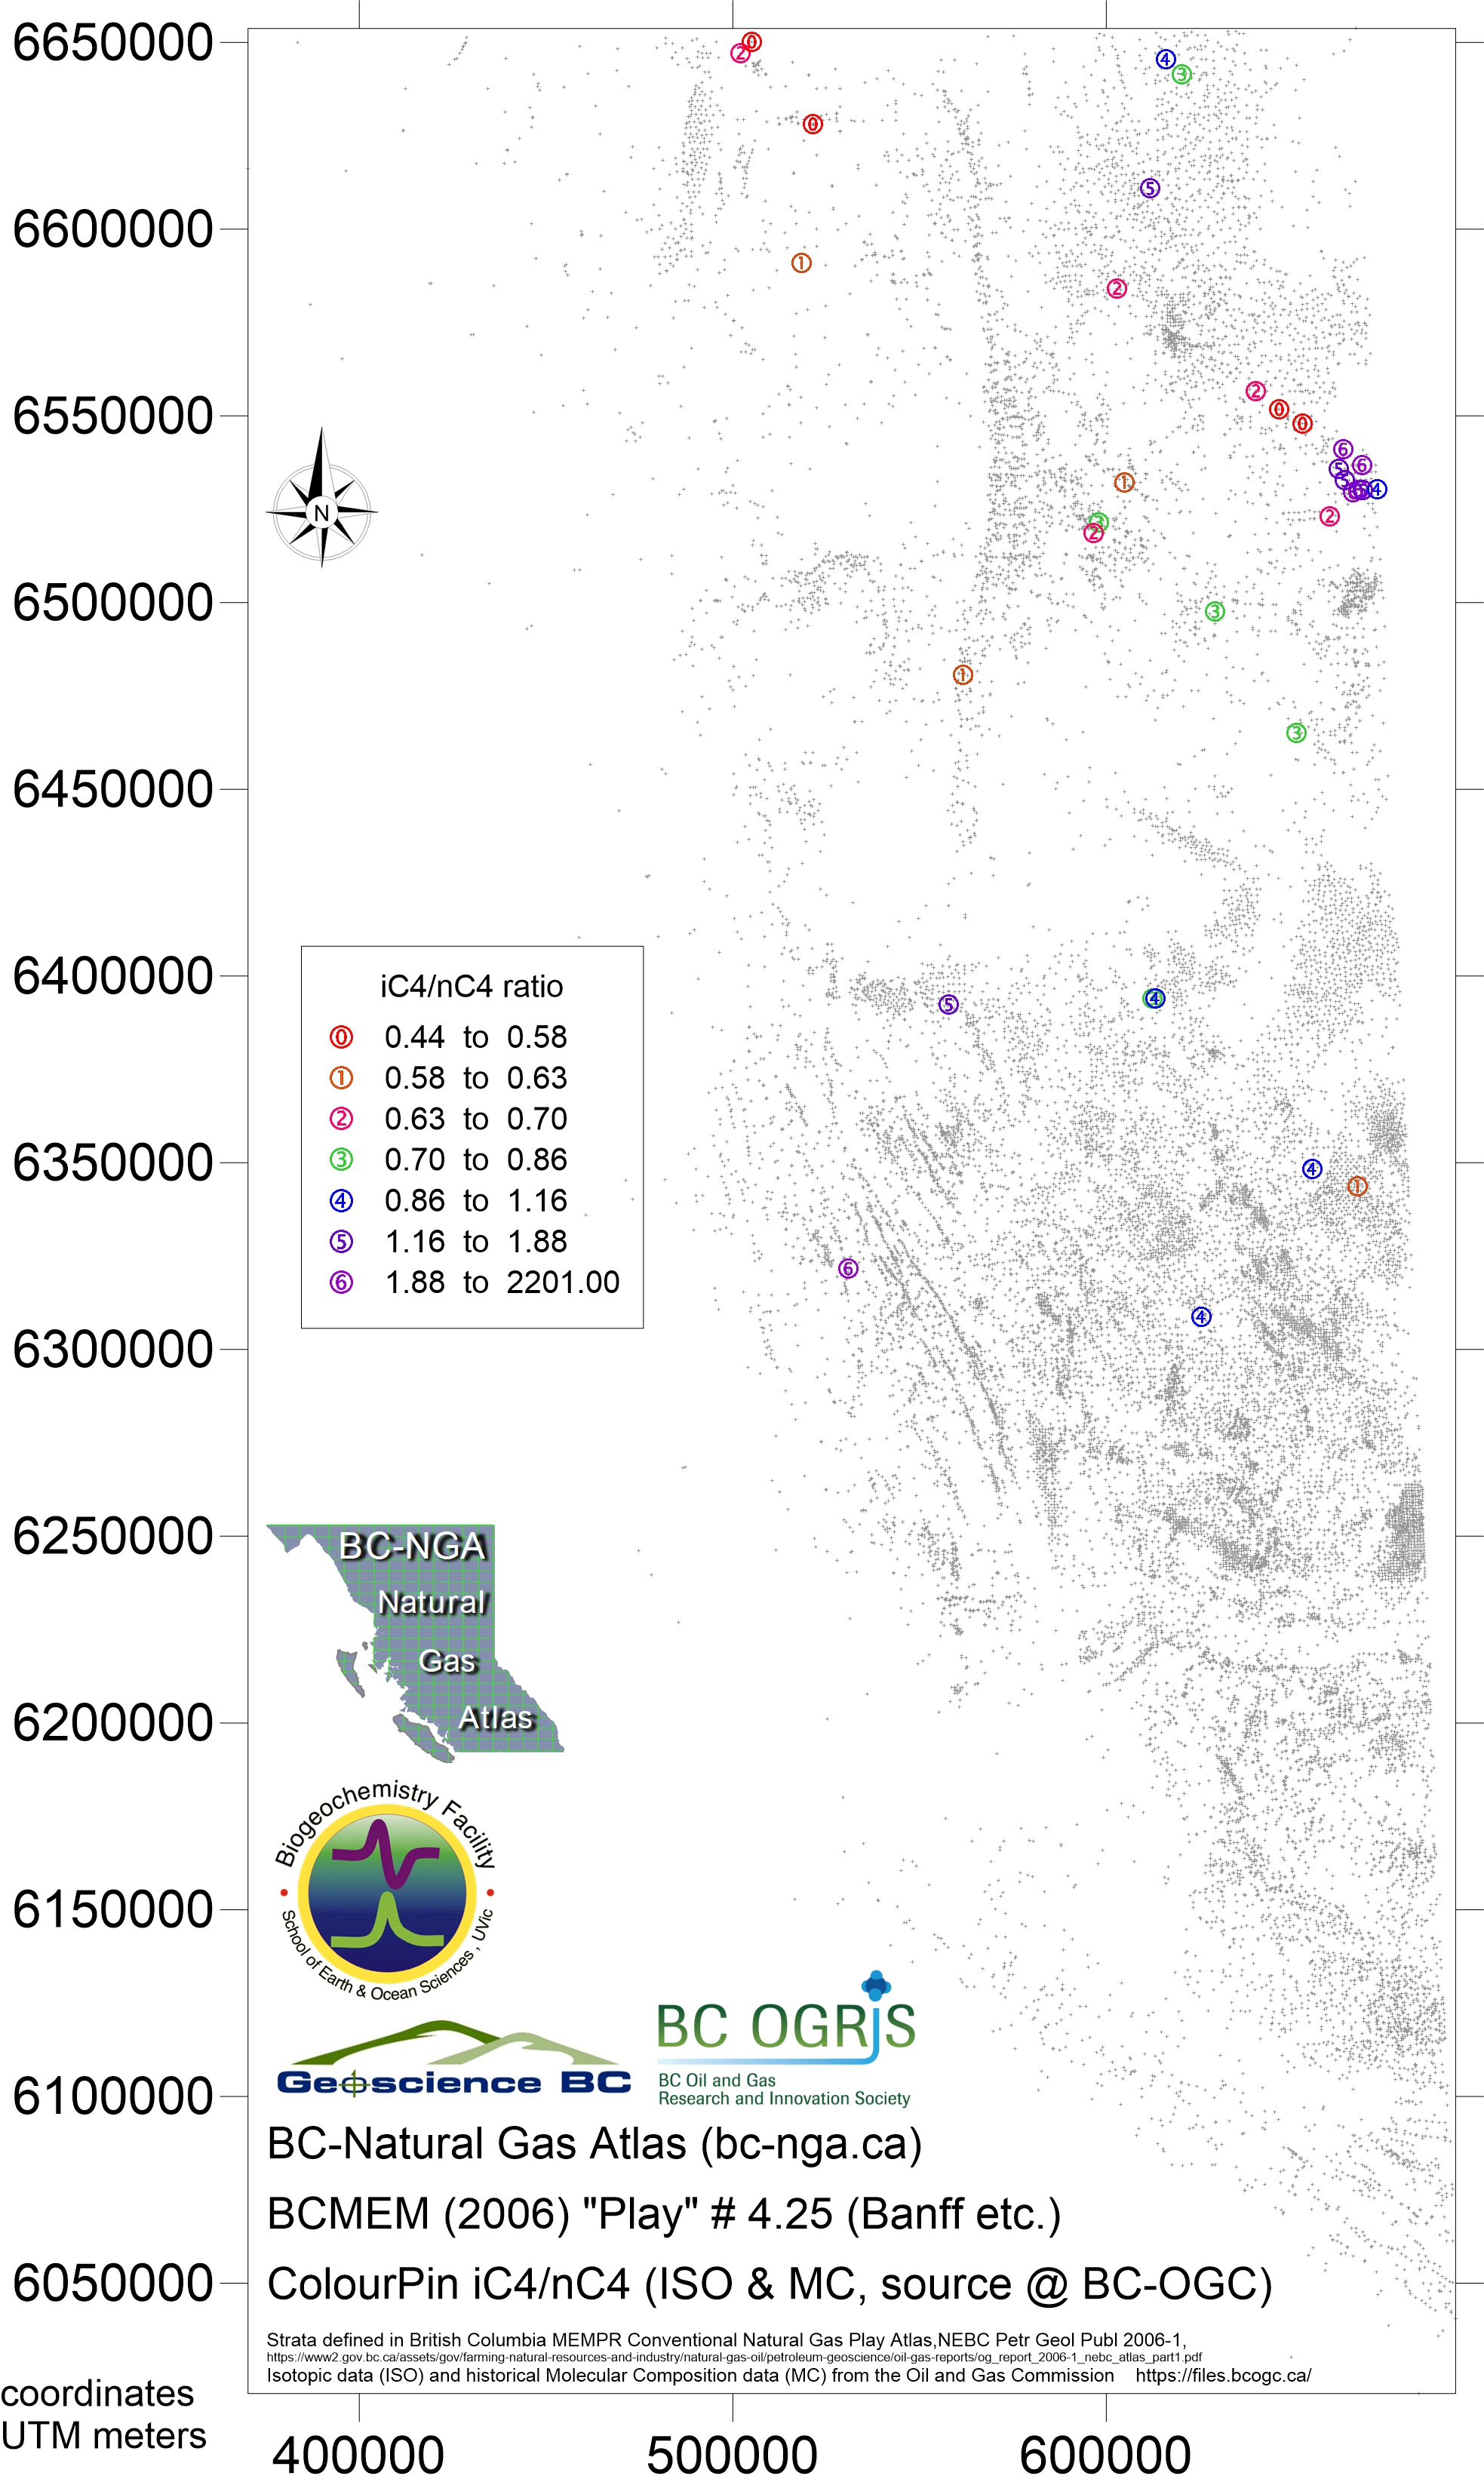
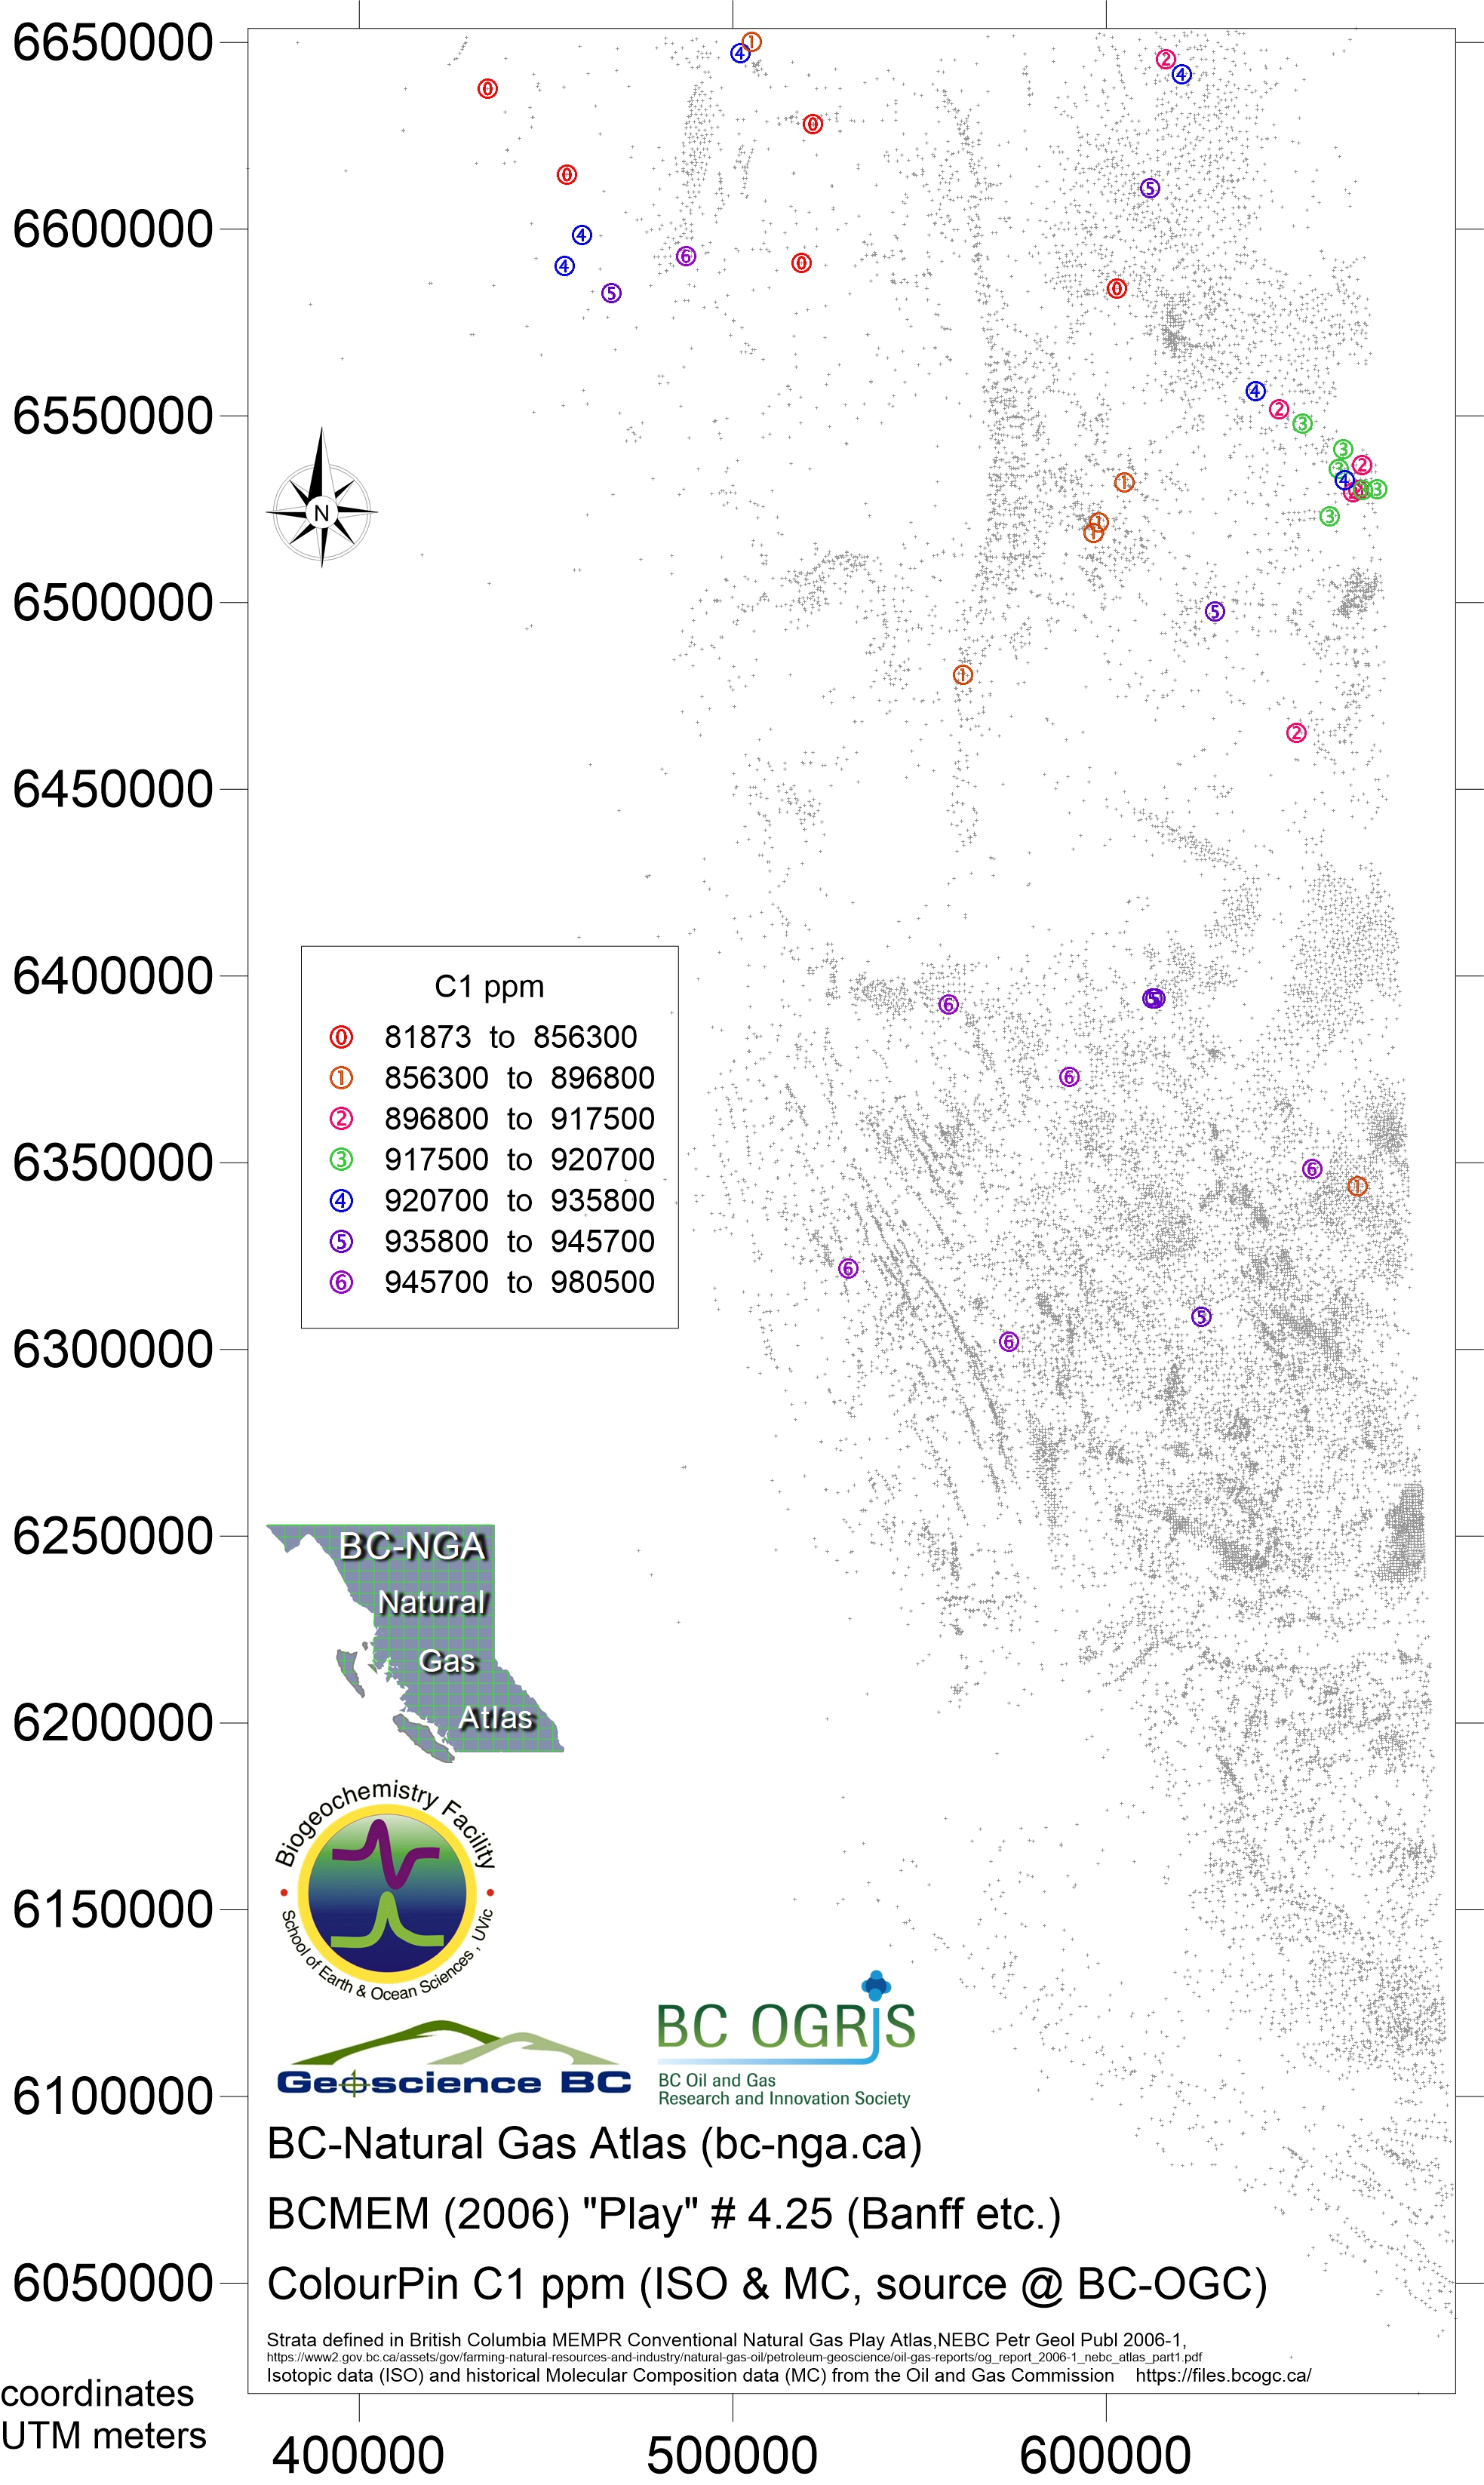
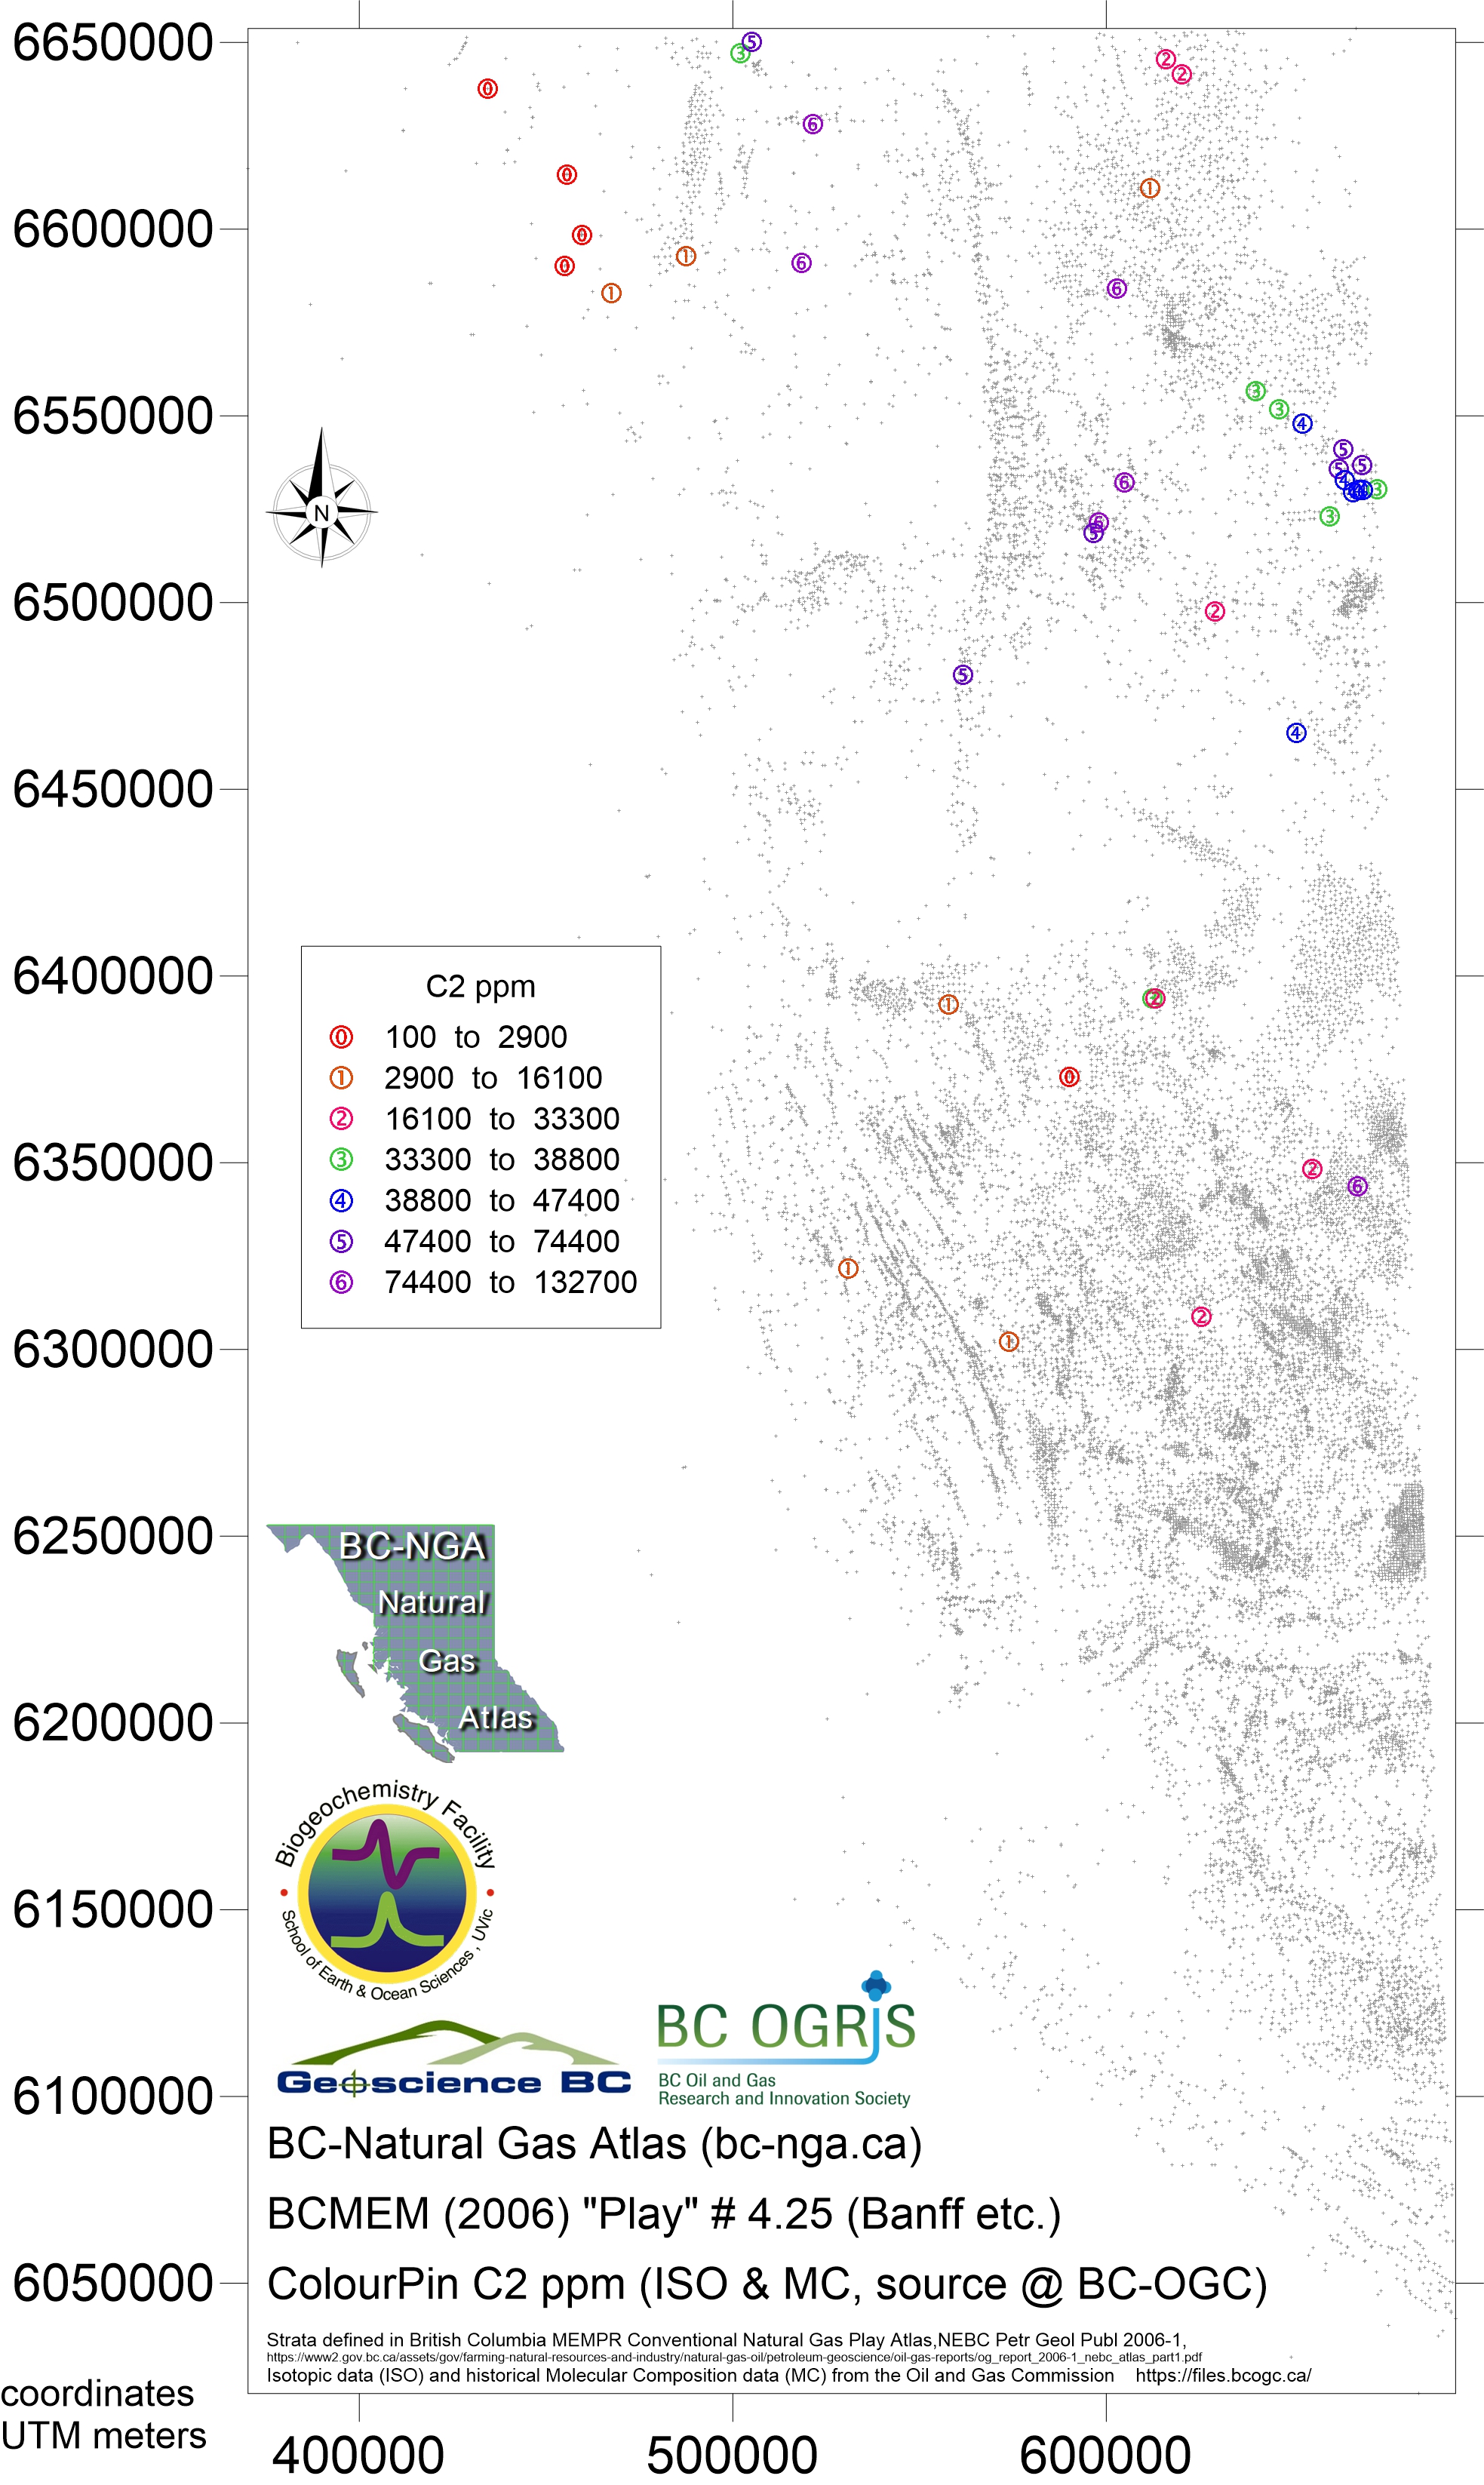
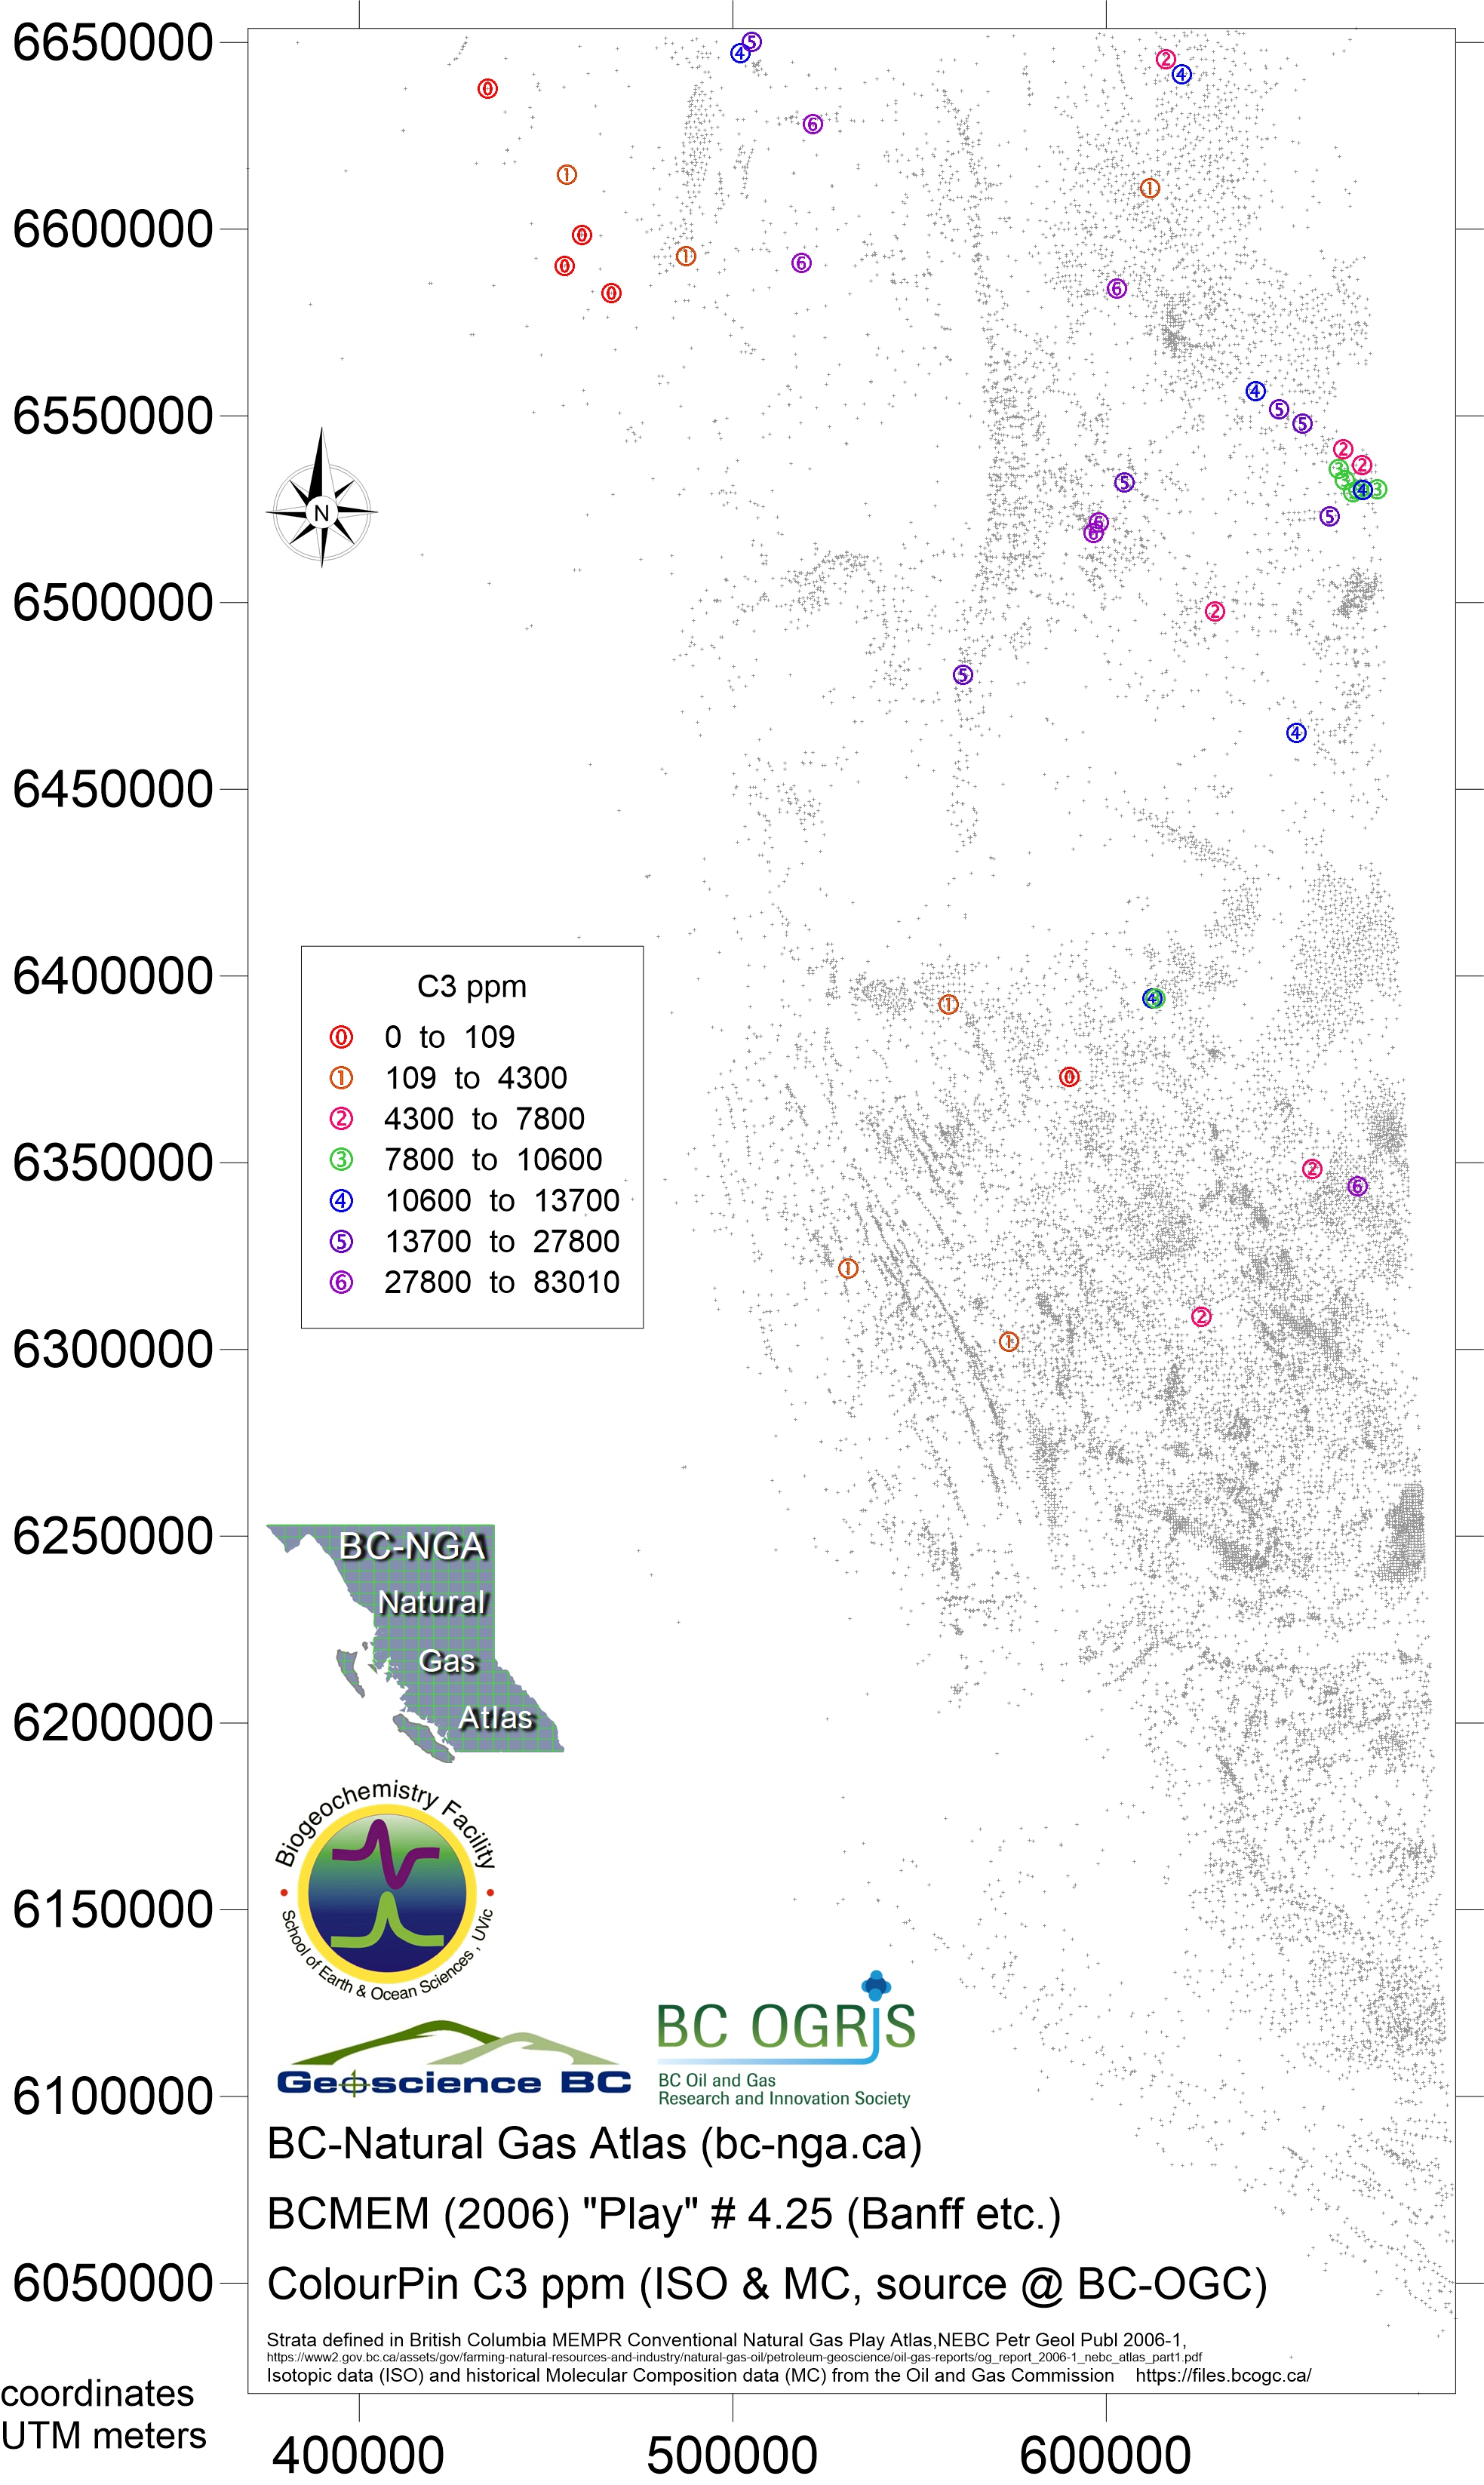
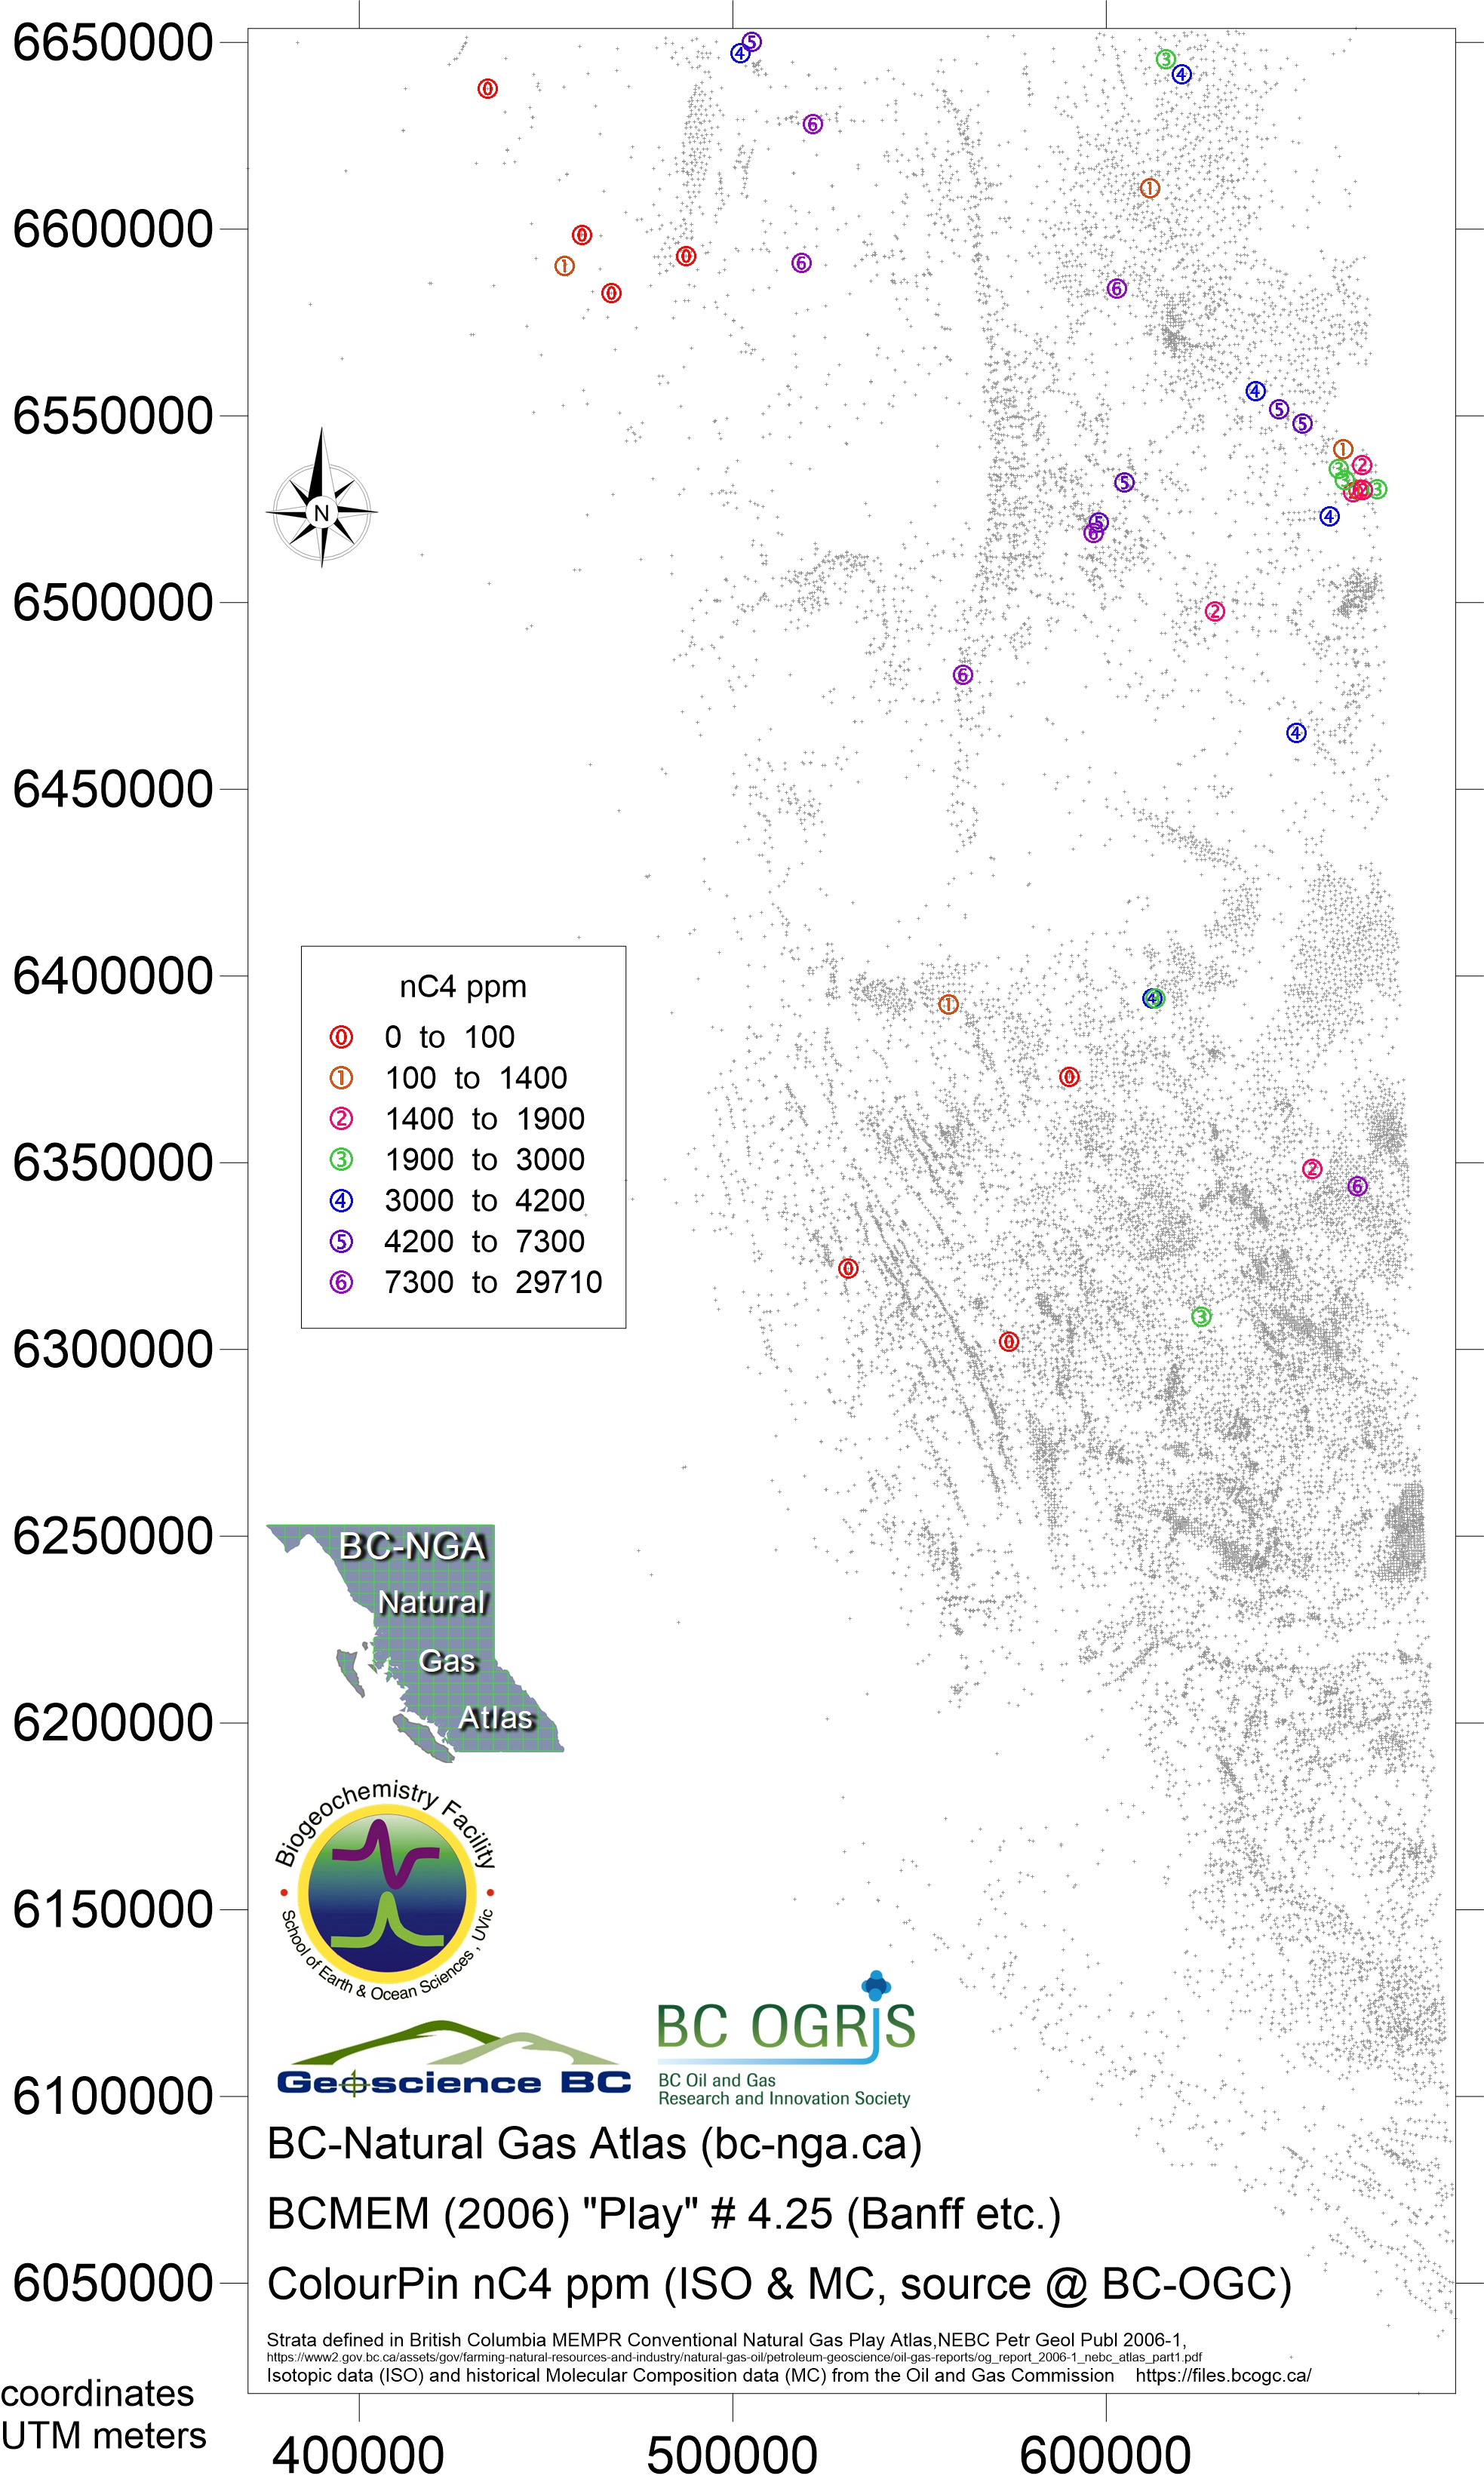
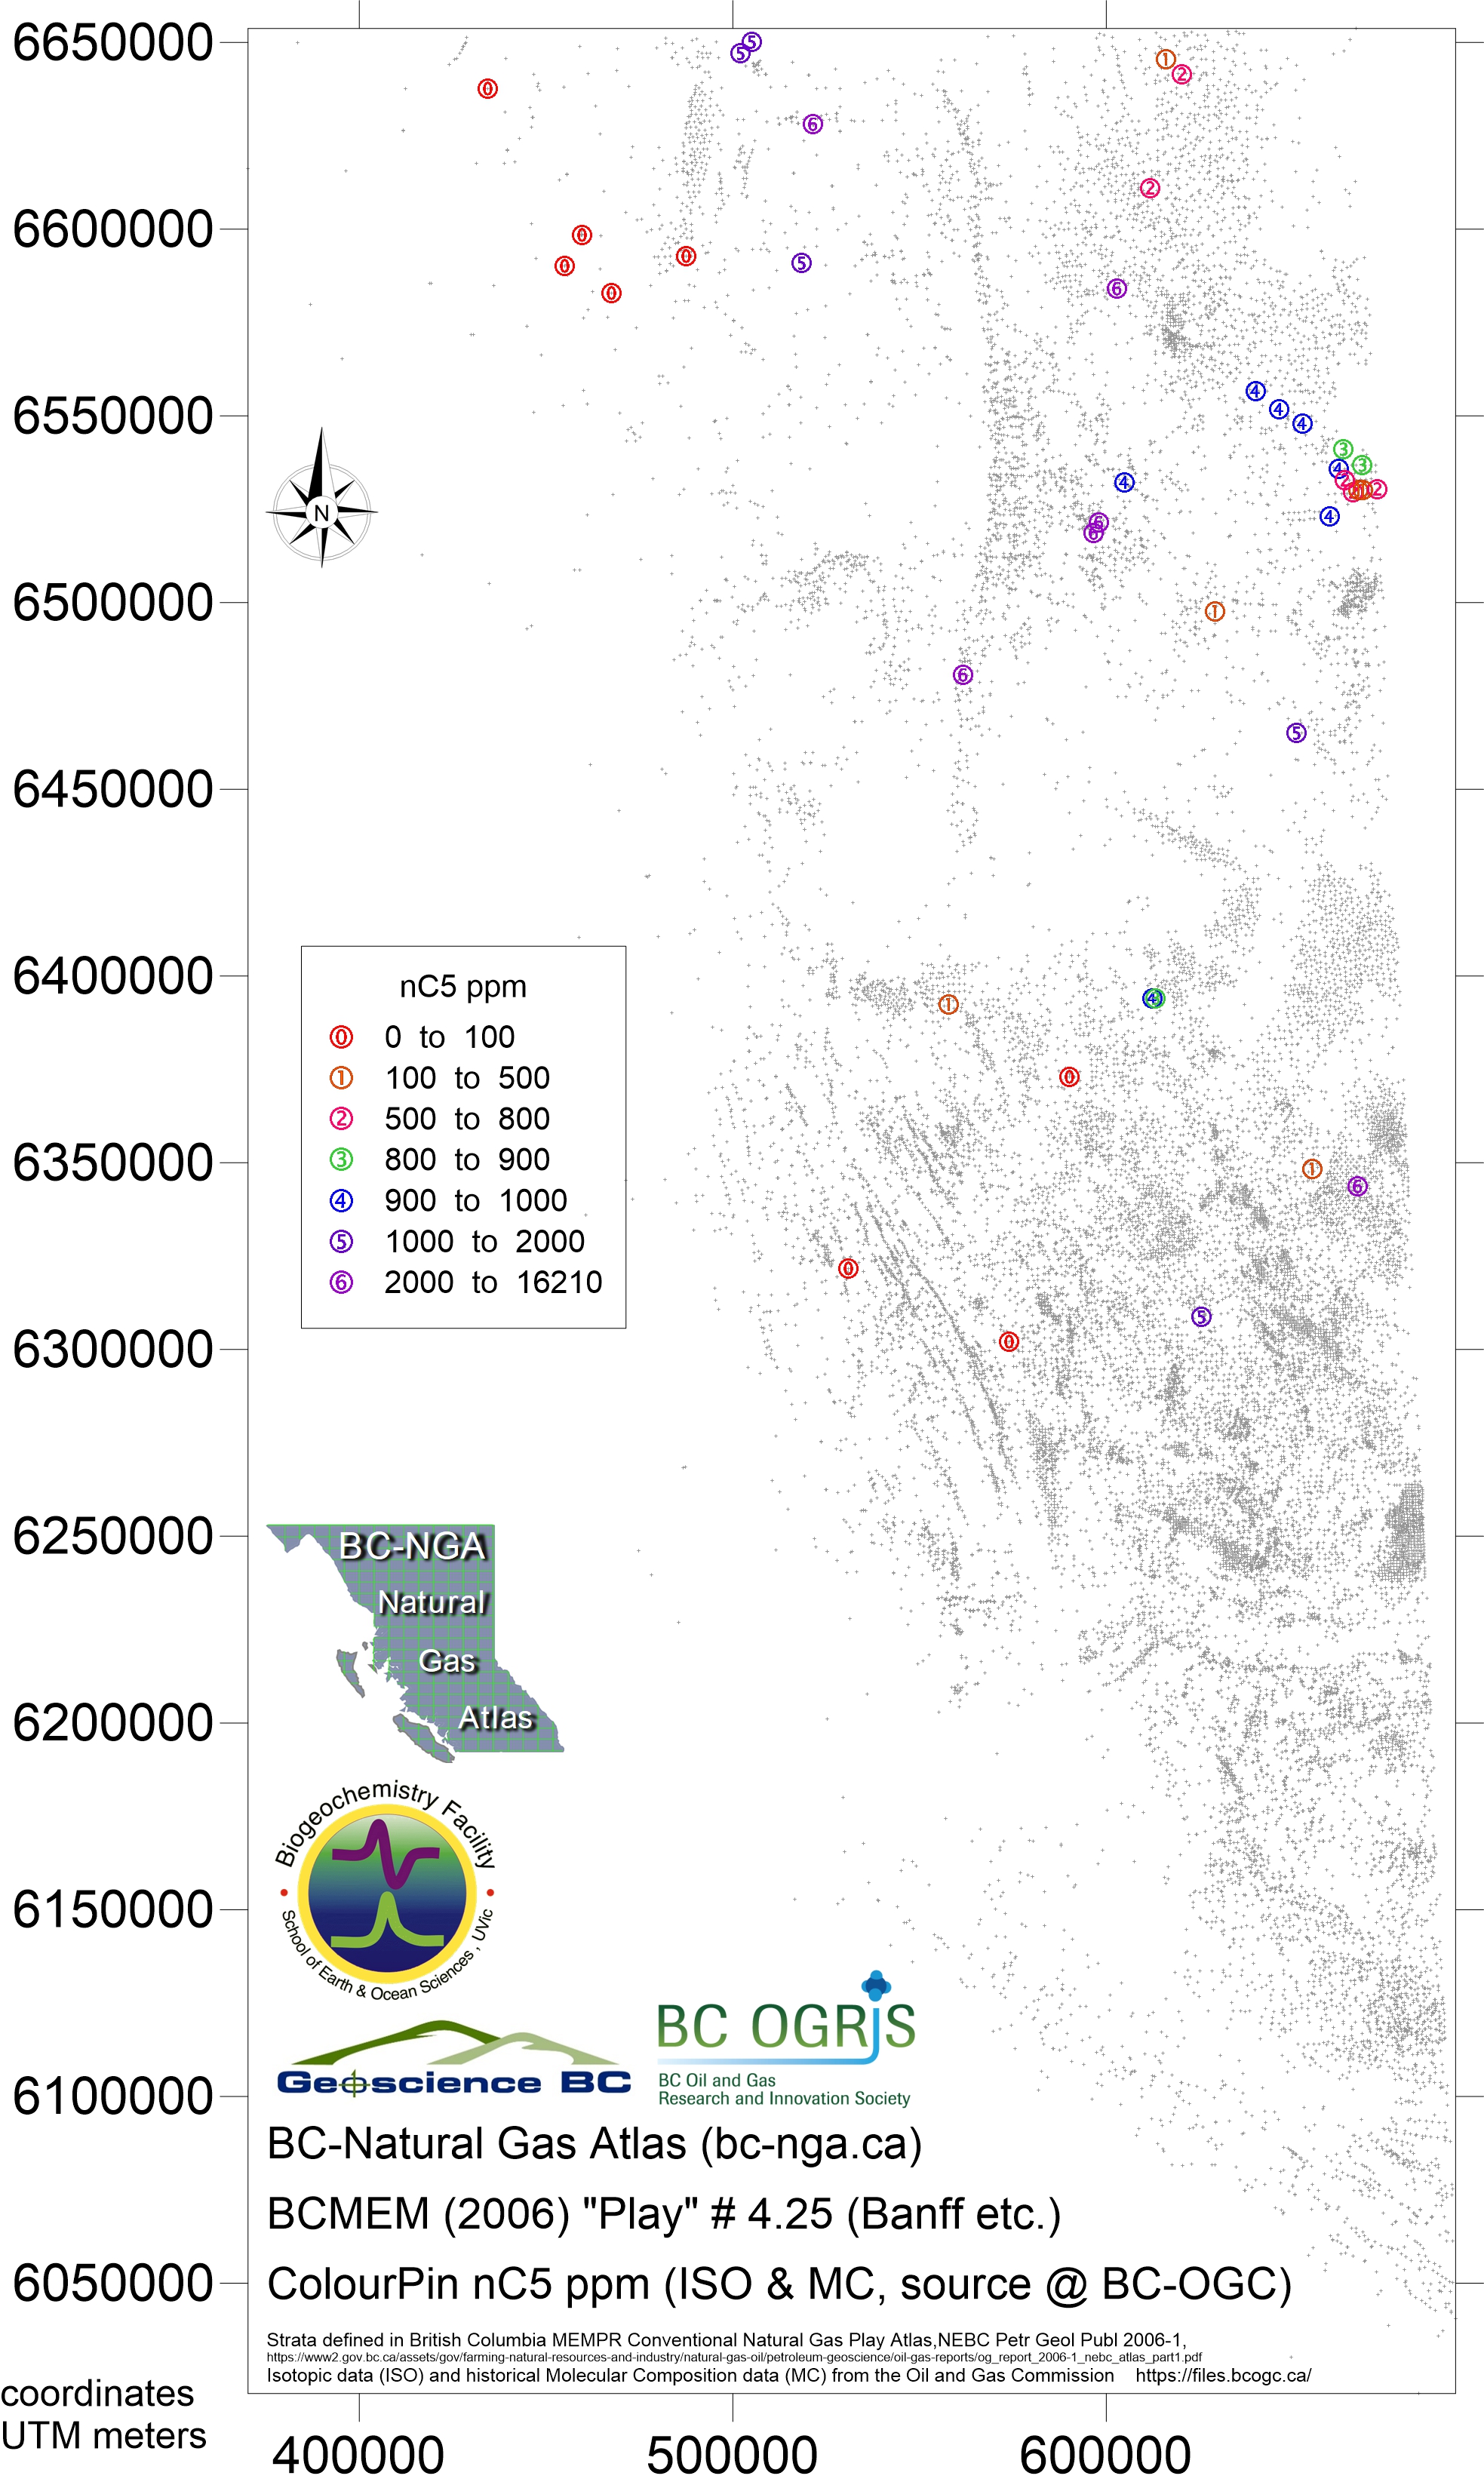
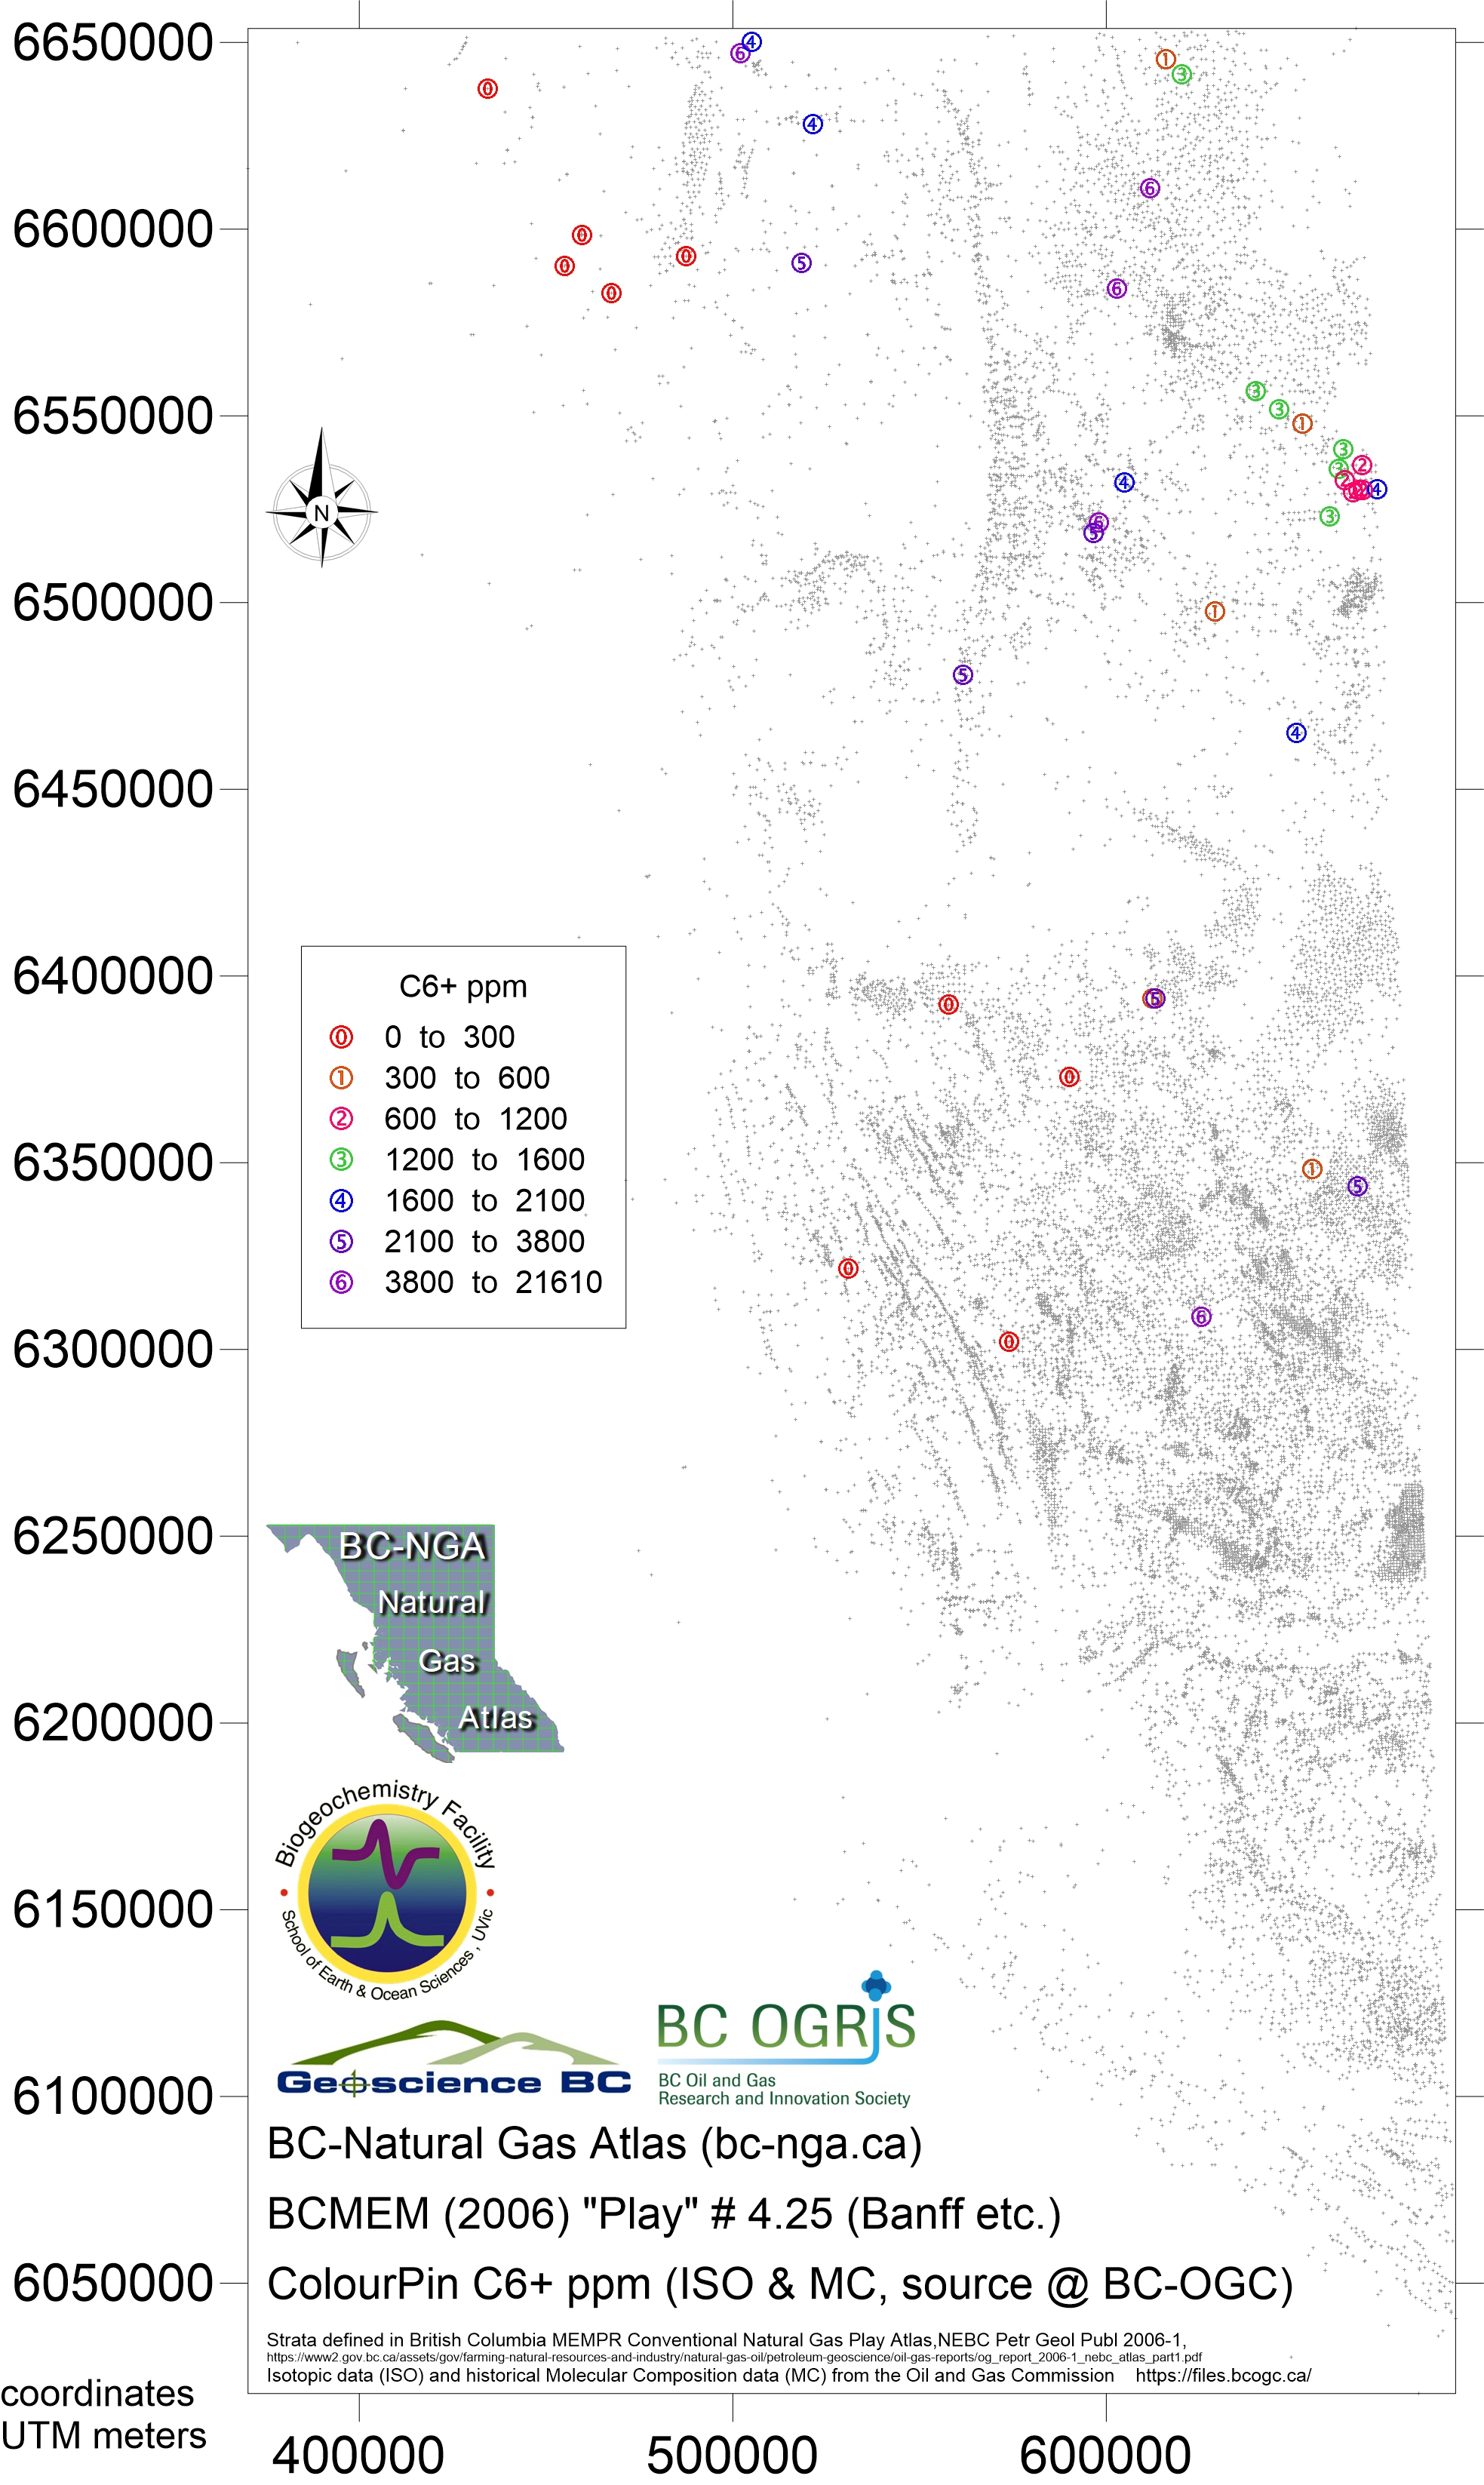
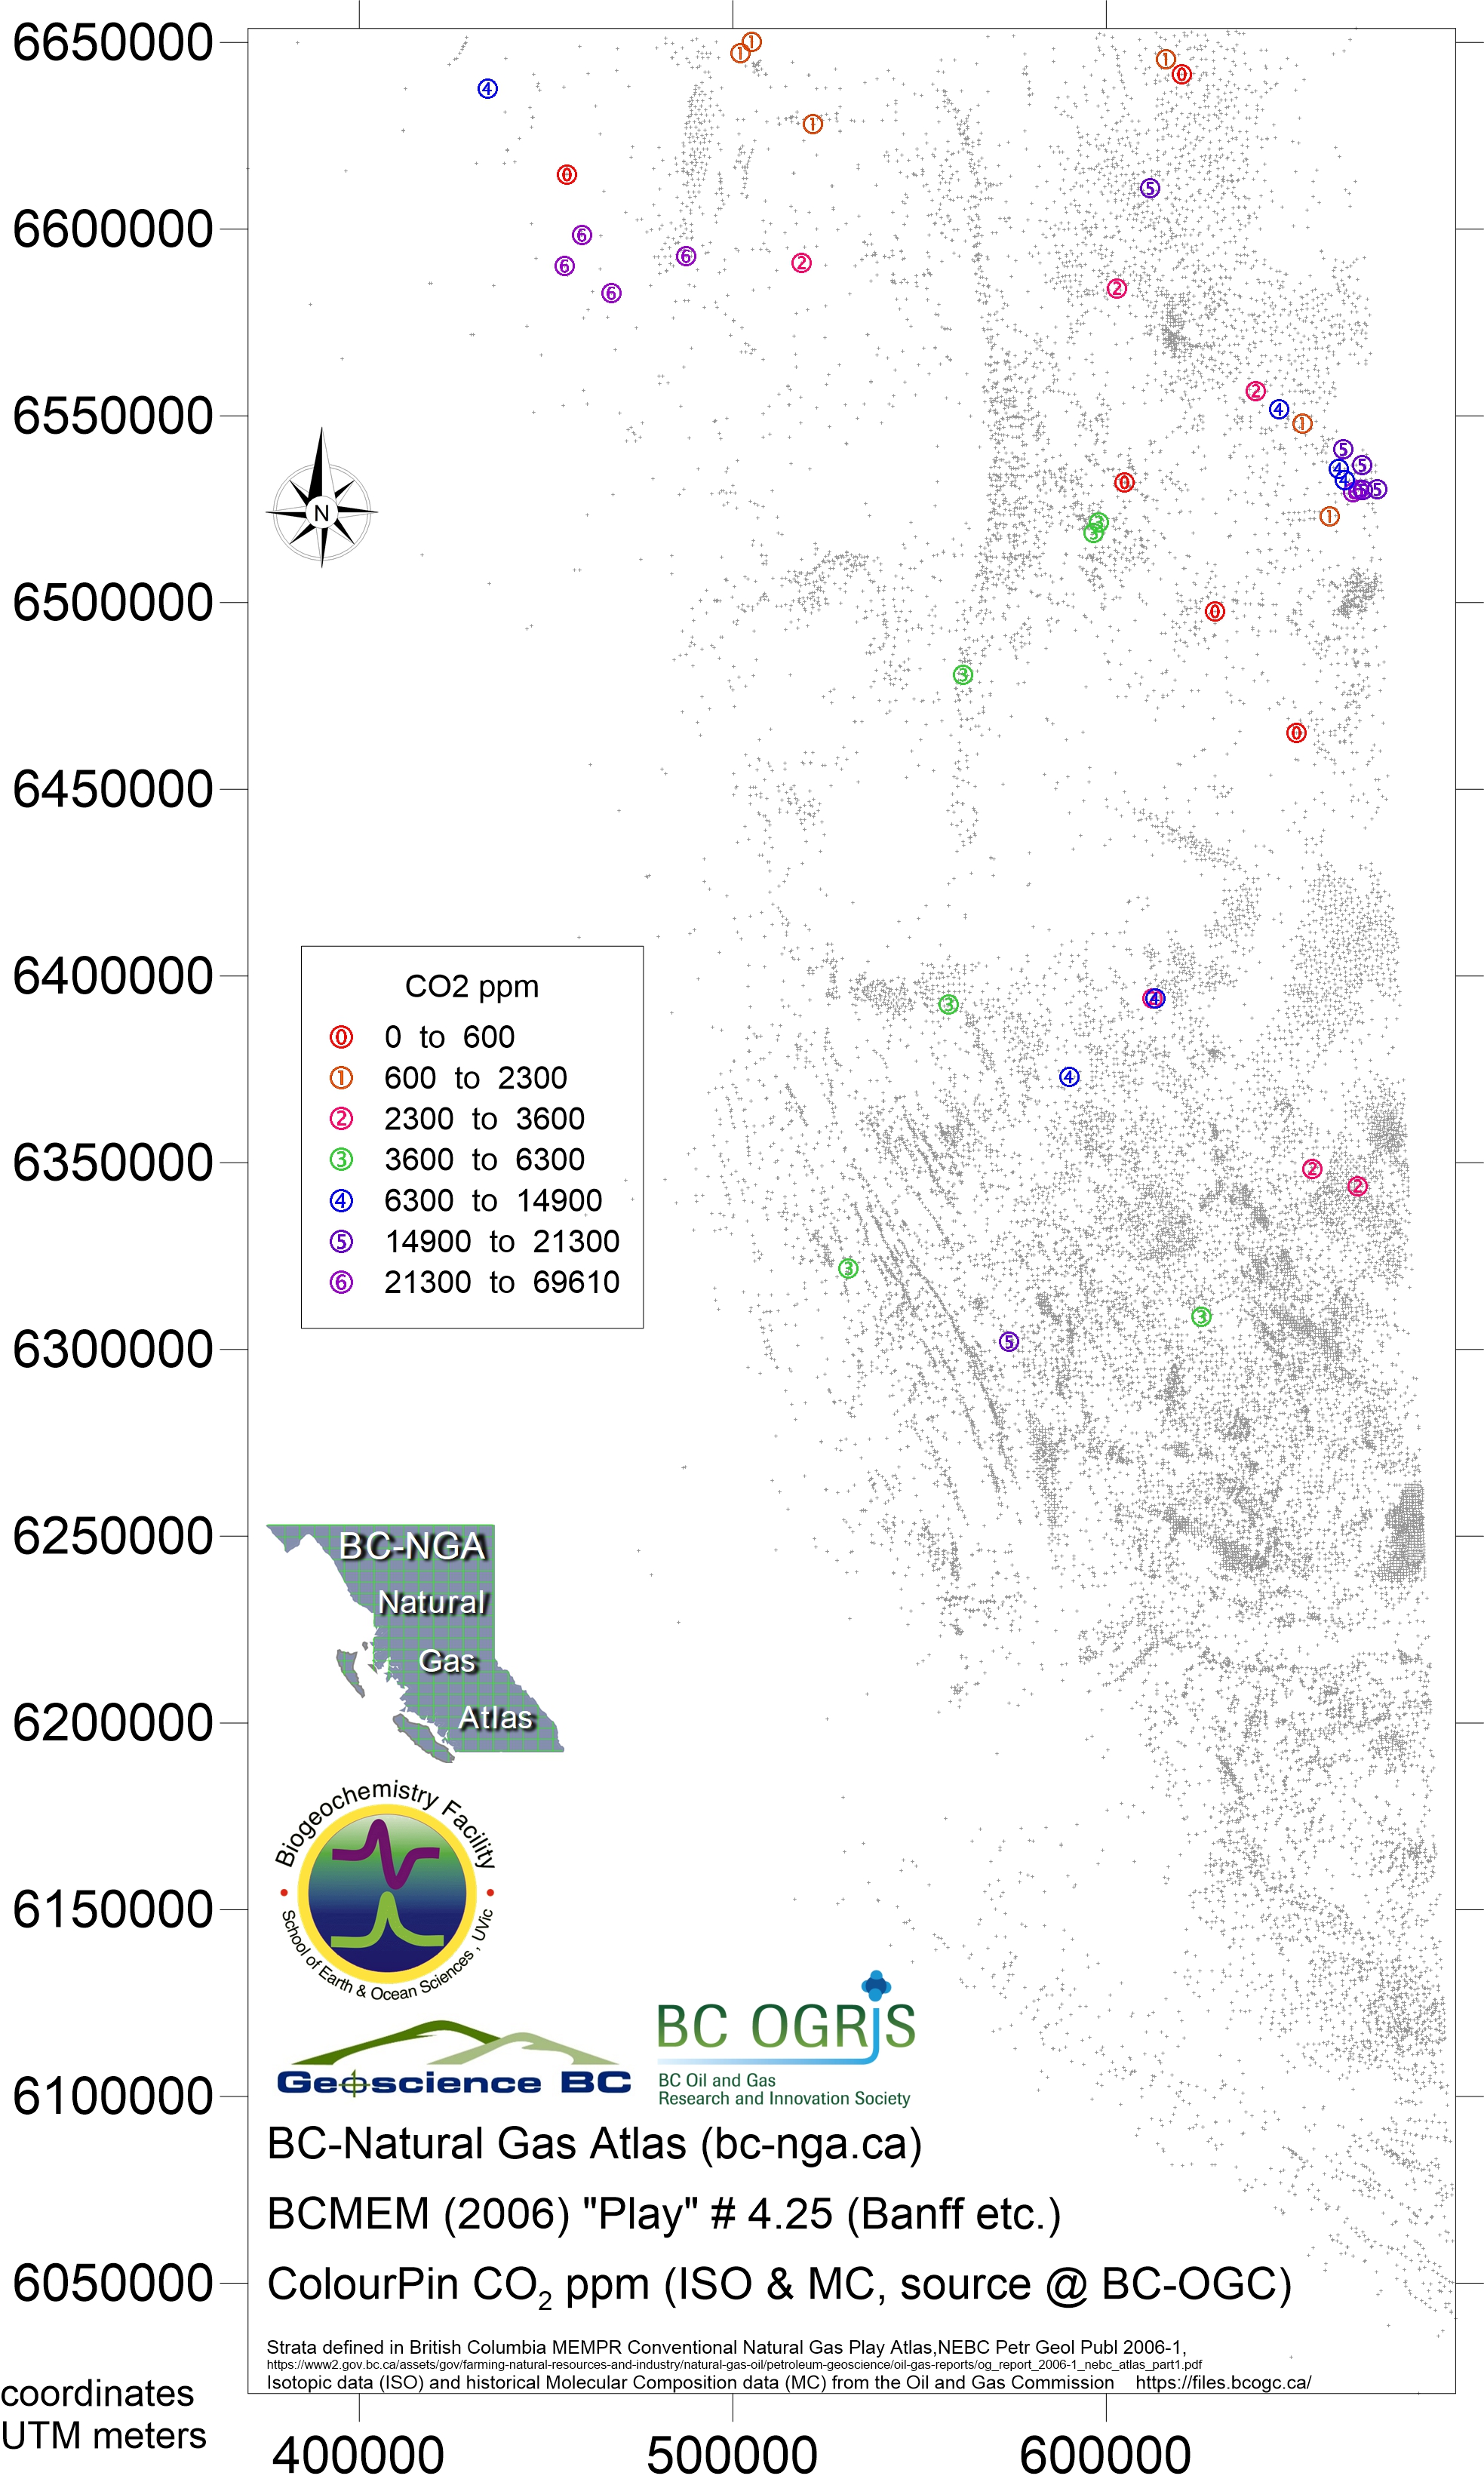
Play 4.25 Pekisko / Banff Formations and equivalents
- Map290 Nov 2018 play 4.25 Banff eqv Bernard ratio
- Map291 Nov 2018 play 4.25 Banff eqv dryness ratio
- Map292 Nov 2018 play 4.25 Banff eqv iC4nC4 ratio
- Map294 Nov 2018 play 4.25 Banff eqv CH4 ppm
- Map295 Nov 2018 play 4.25 Banff eqv C2H6 ppm
- Map296 Nov 2018 play 4.25 Banff eqv C3H8 ppm
- Map297 Nov 2018 play 4.25 Banff eqv iC4H10 ppm
- Map298 Nov 2018 play 4.25 Banff eqv nC4H10 ppm
- Map299 Nov 2018 play 4.25 Banff eqv iC5H12 ppm
- Map300 Nov 2018 play 4.25 Banff eqv nC5H12 ppm
- Map301 Nov 2018 play 4.25 Banff eqv C6H14 plus ppm
- Map302 Nov 2018 play 4.25 Banff eqv CO2 ppm
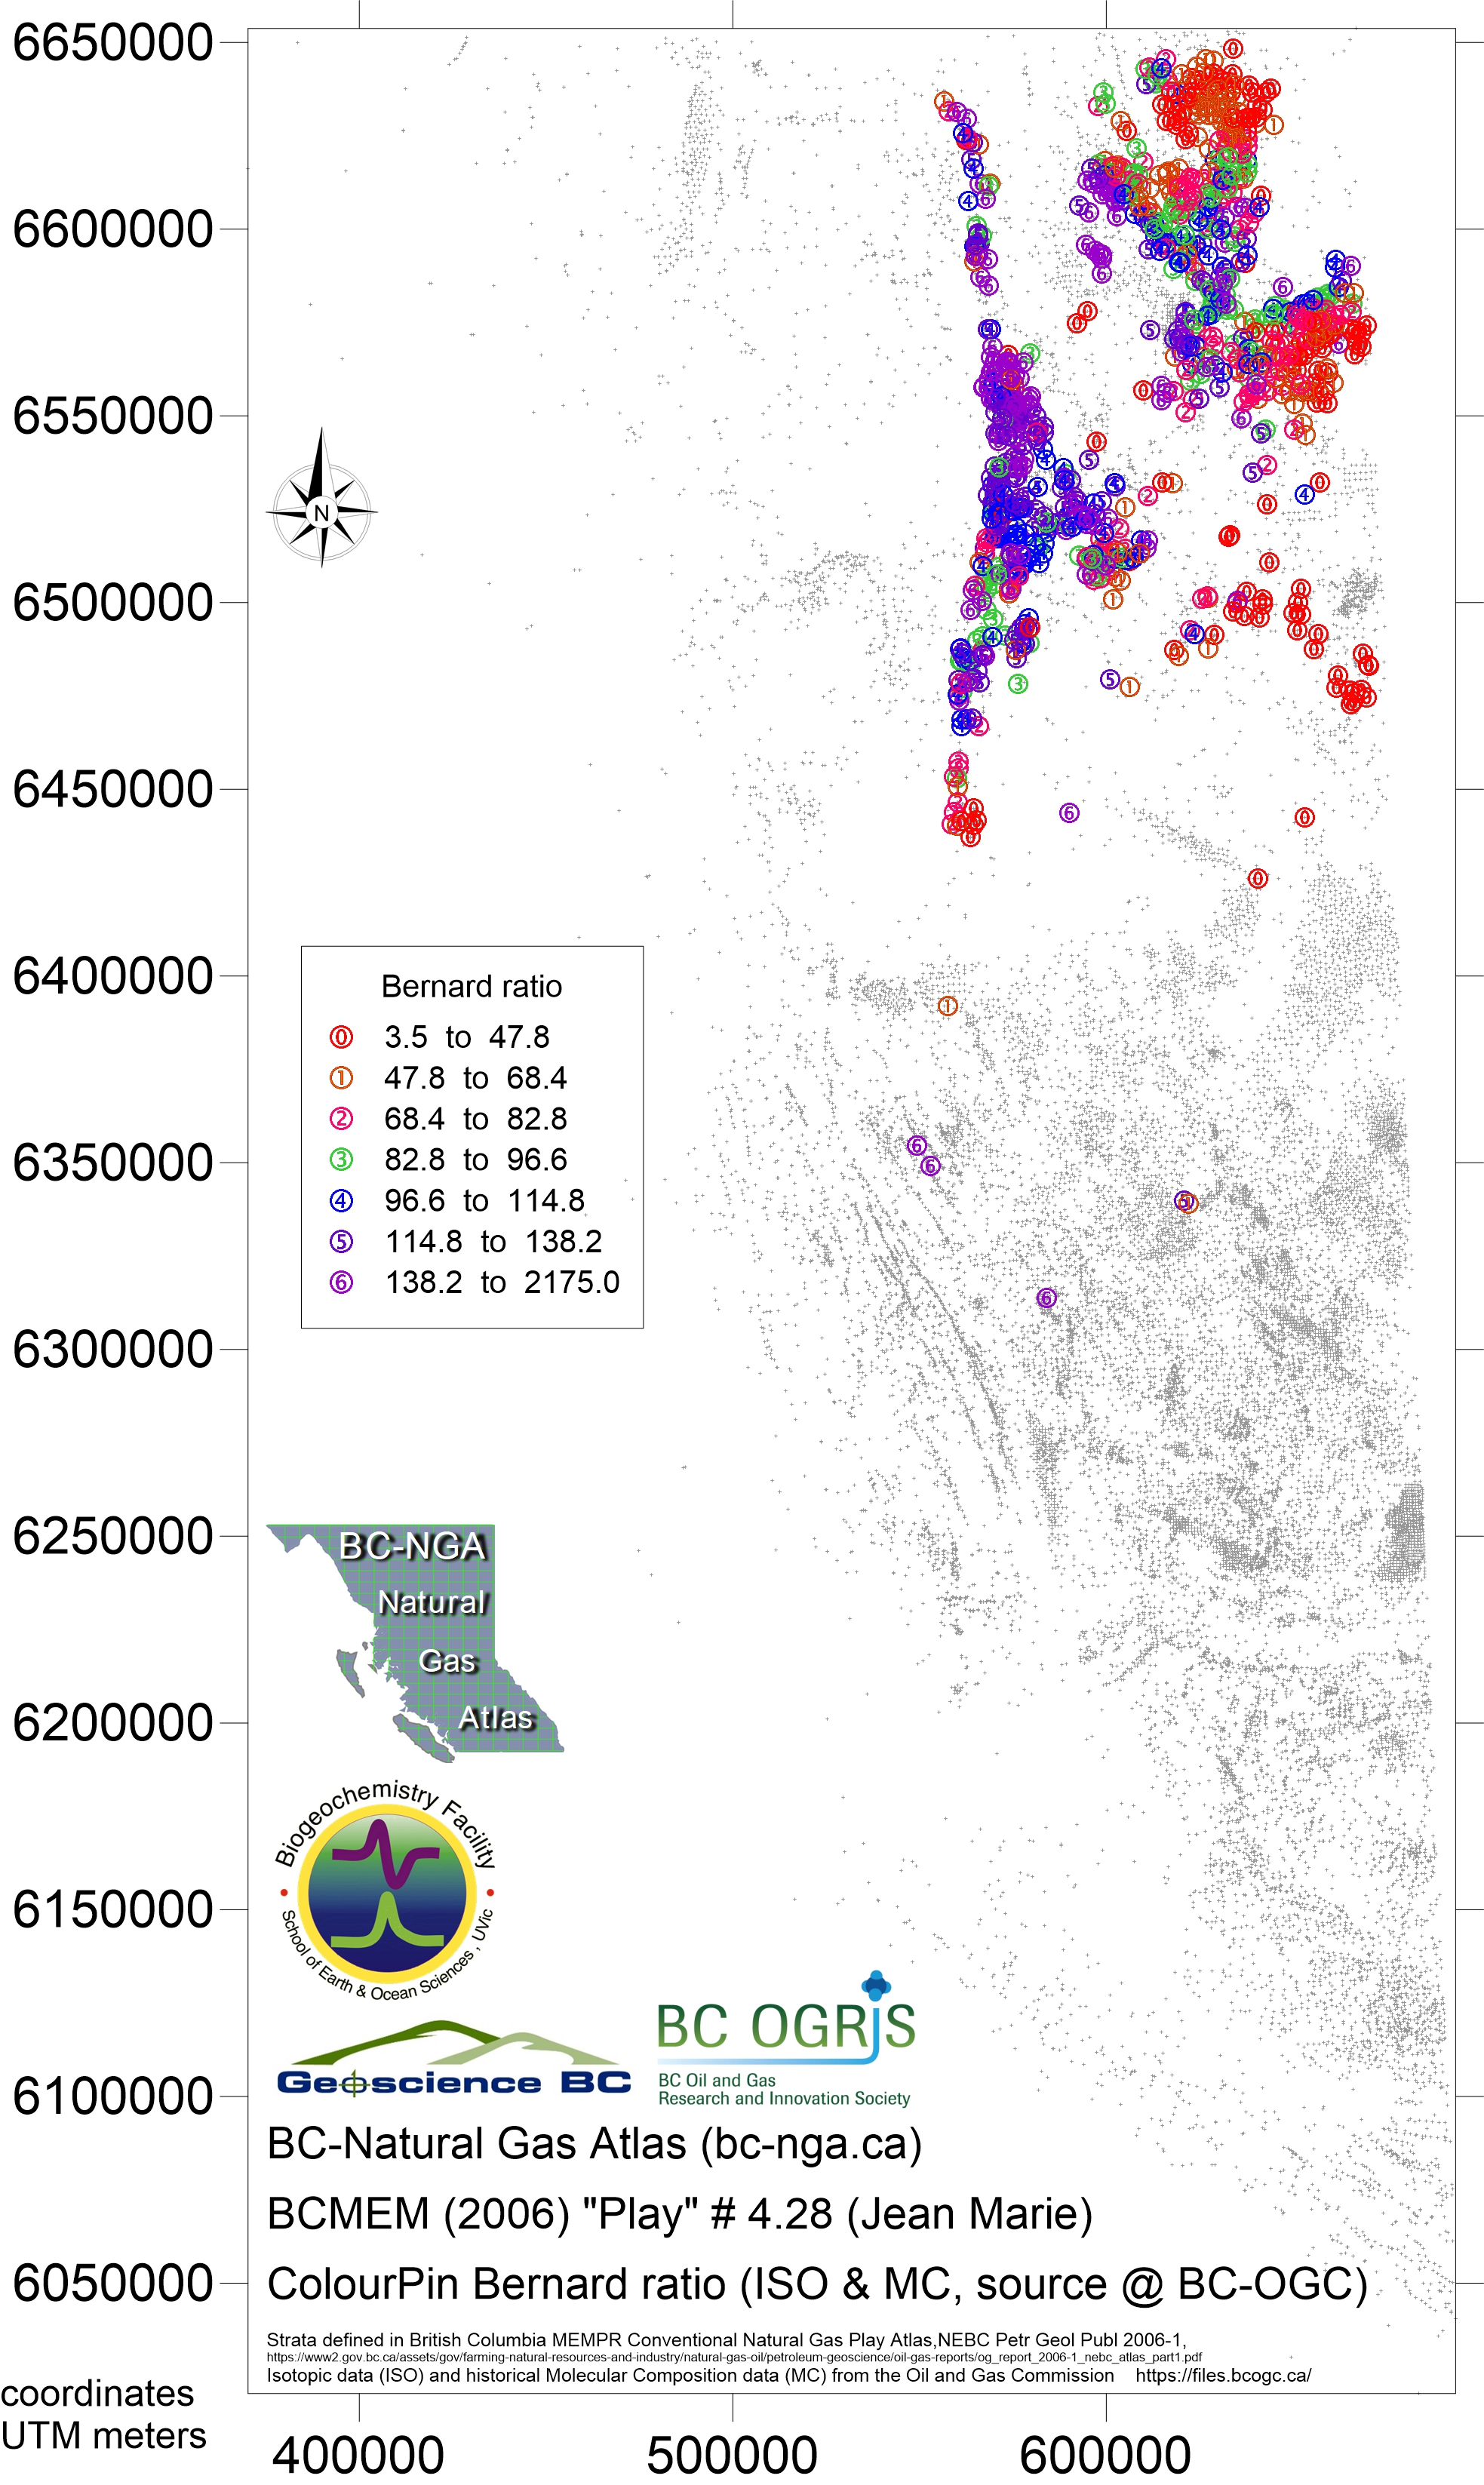
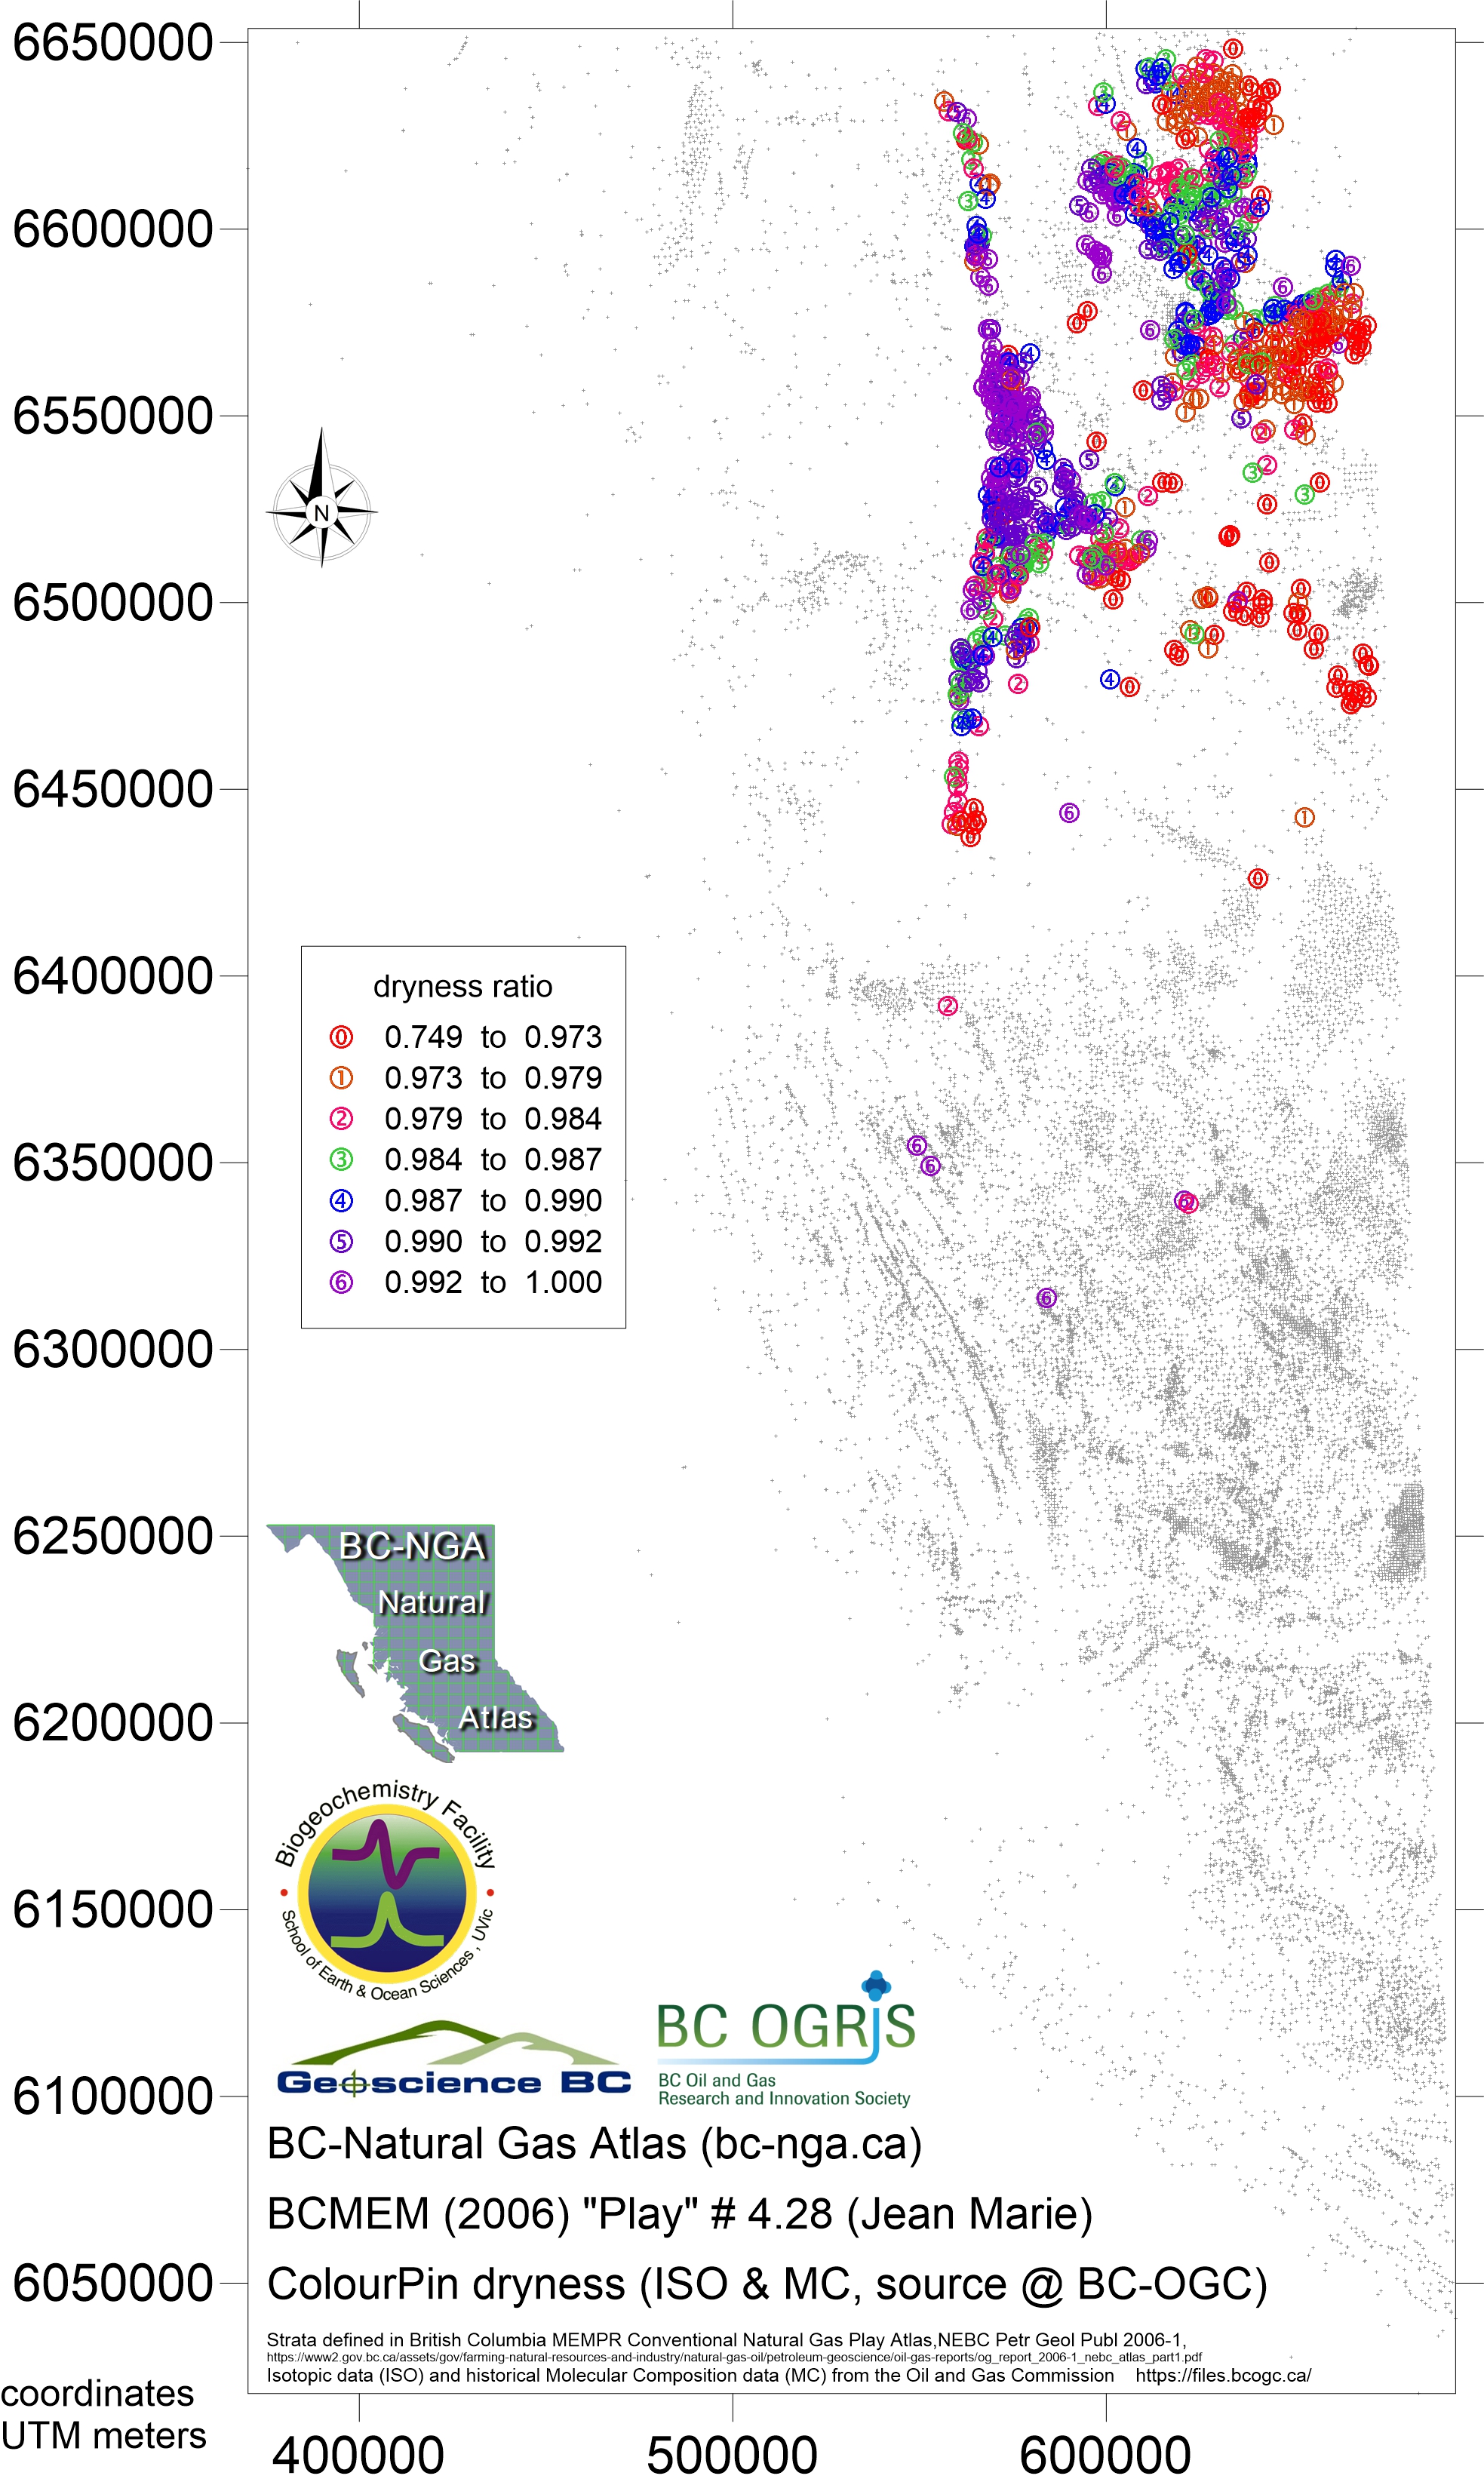
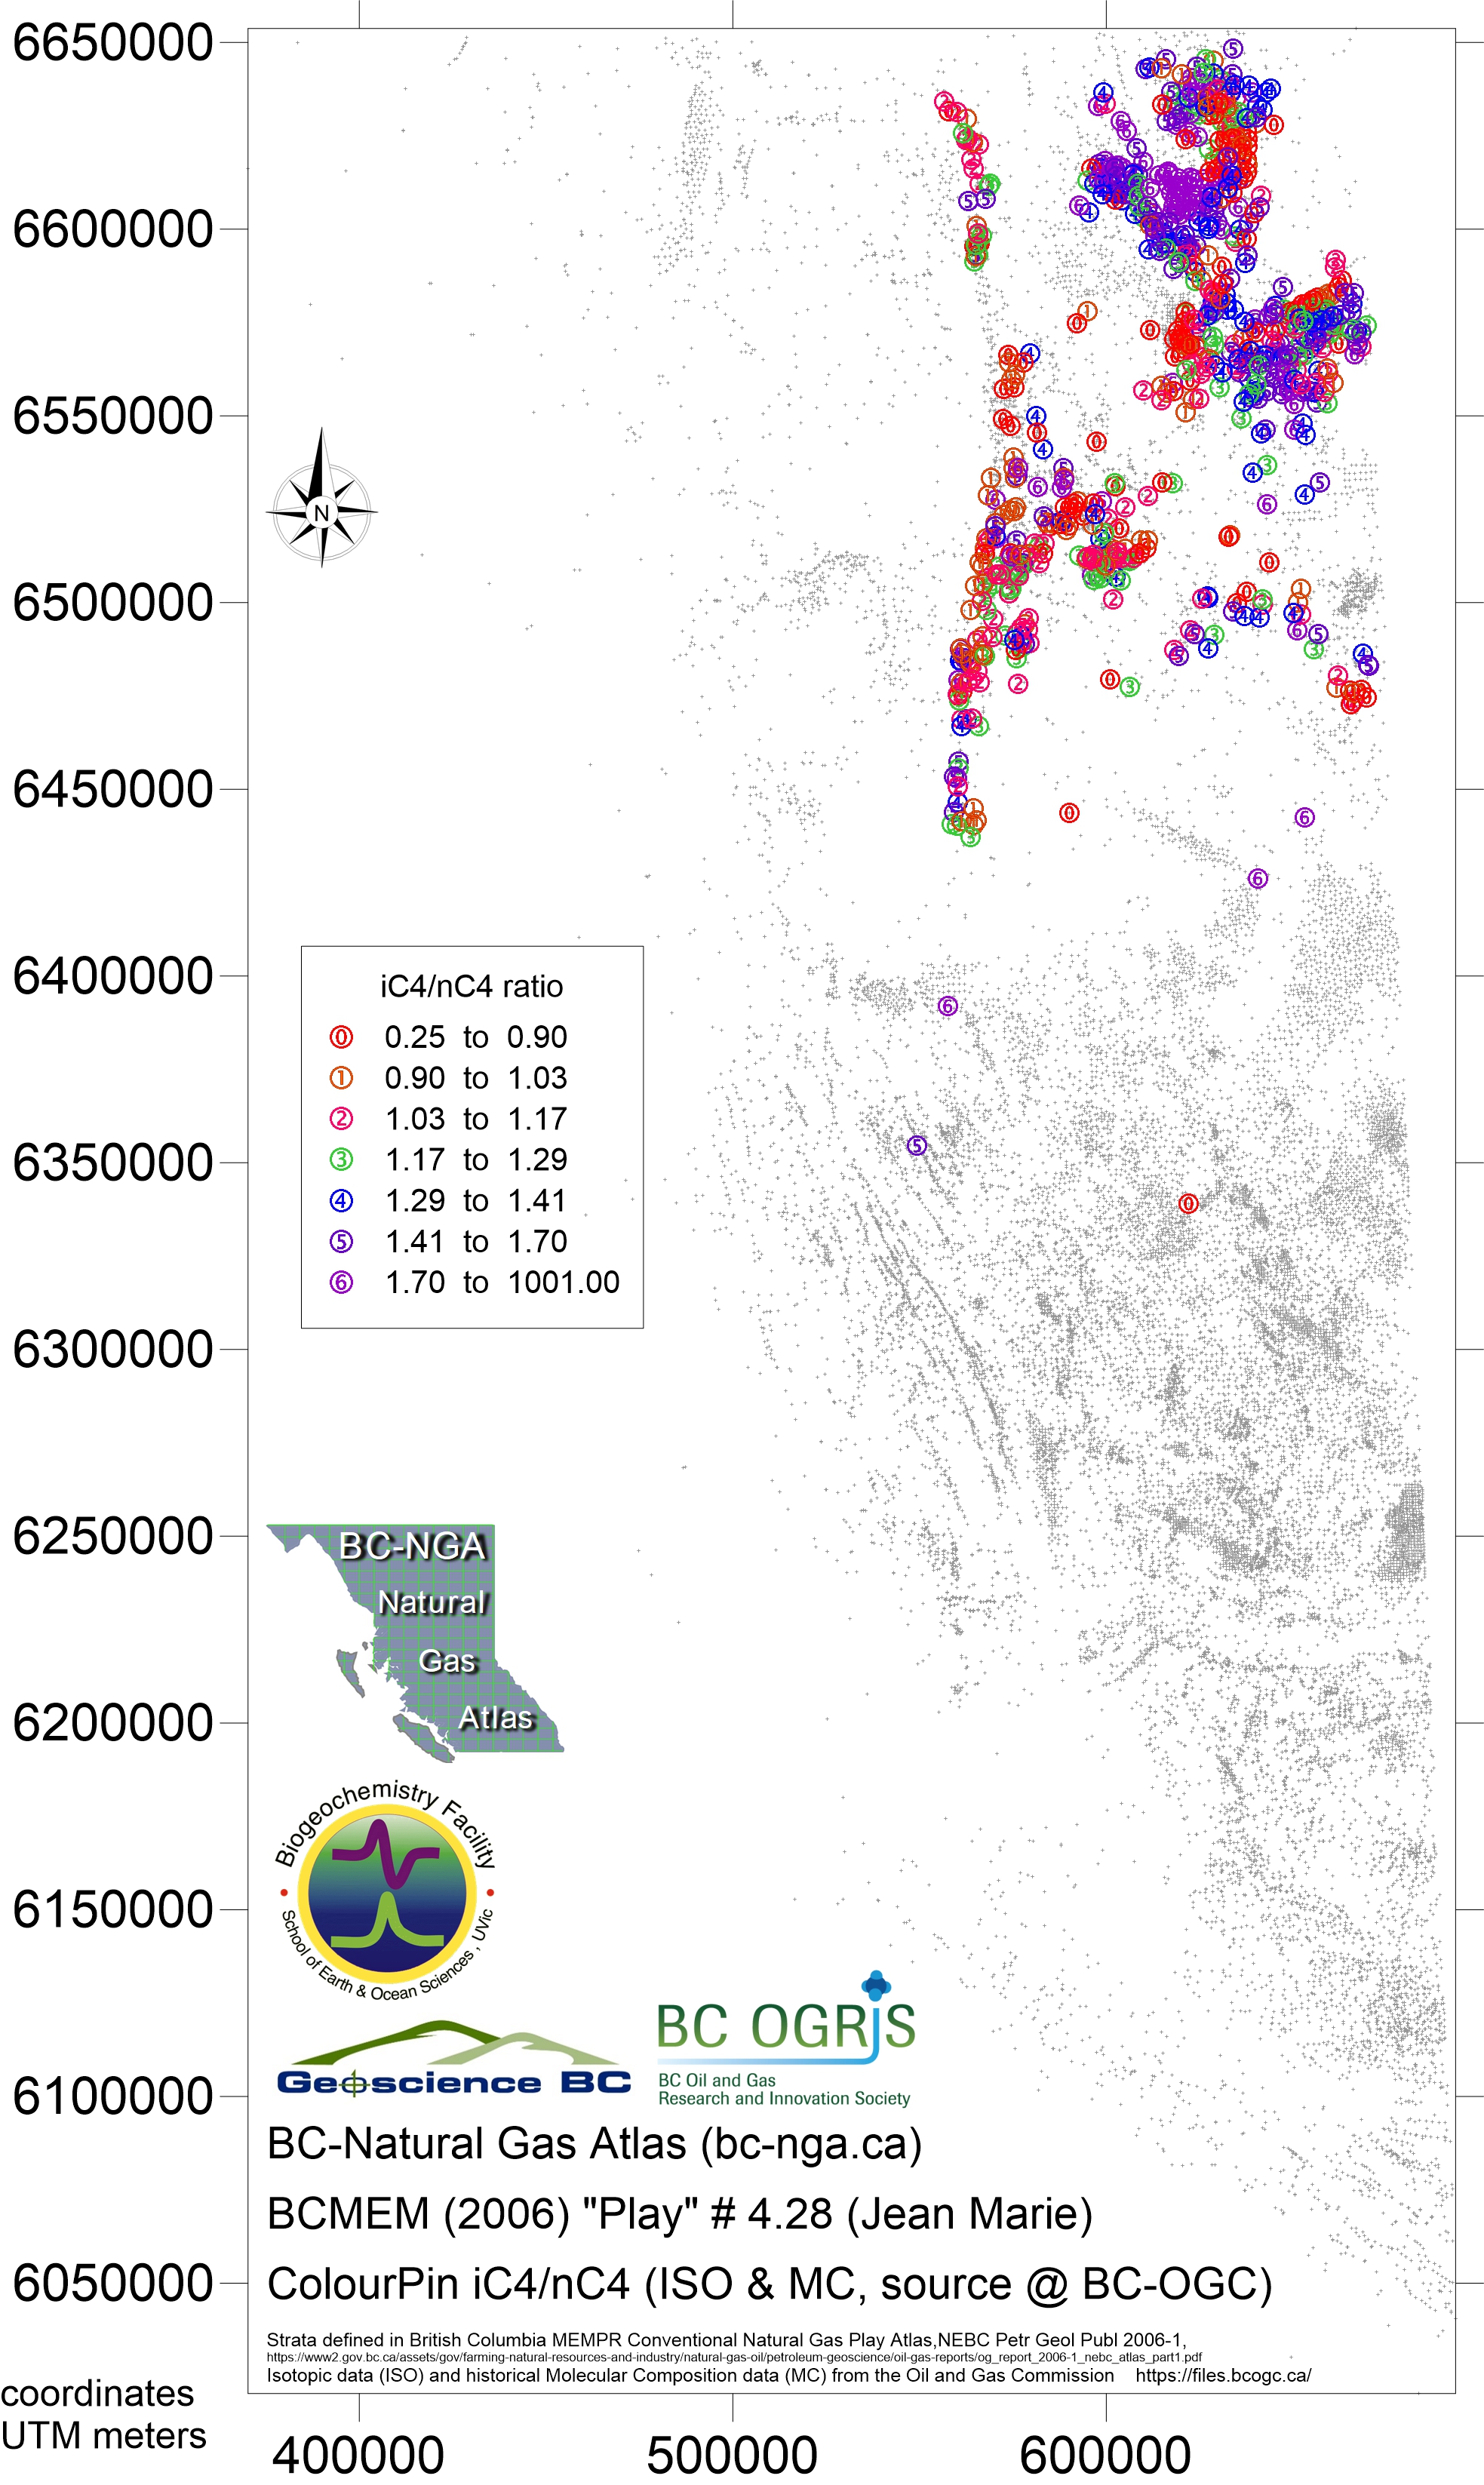
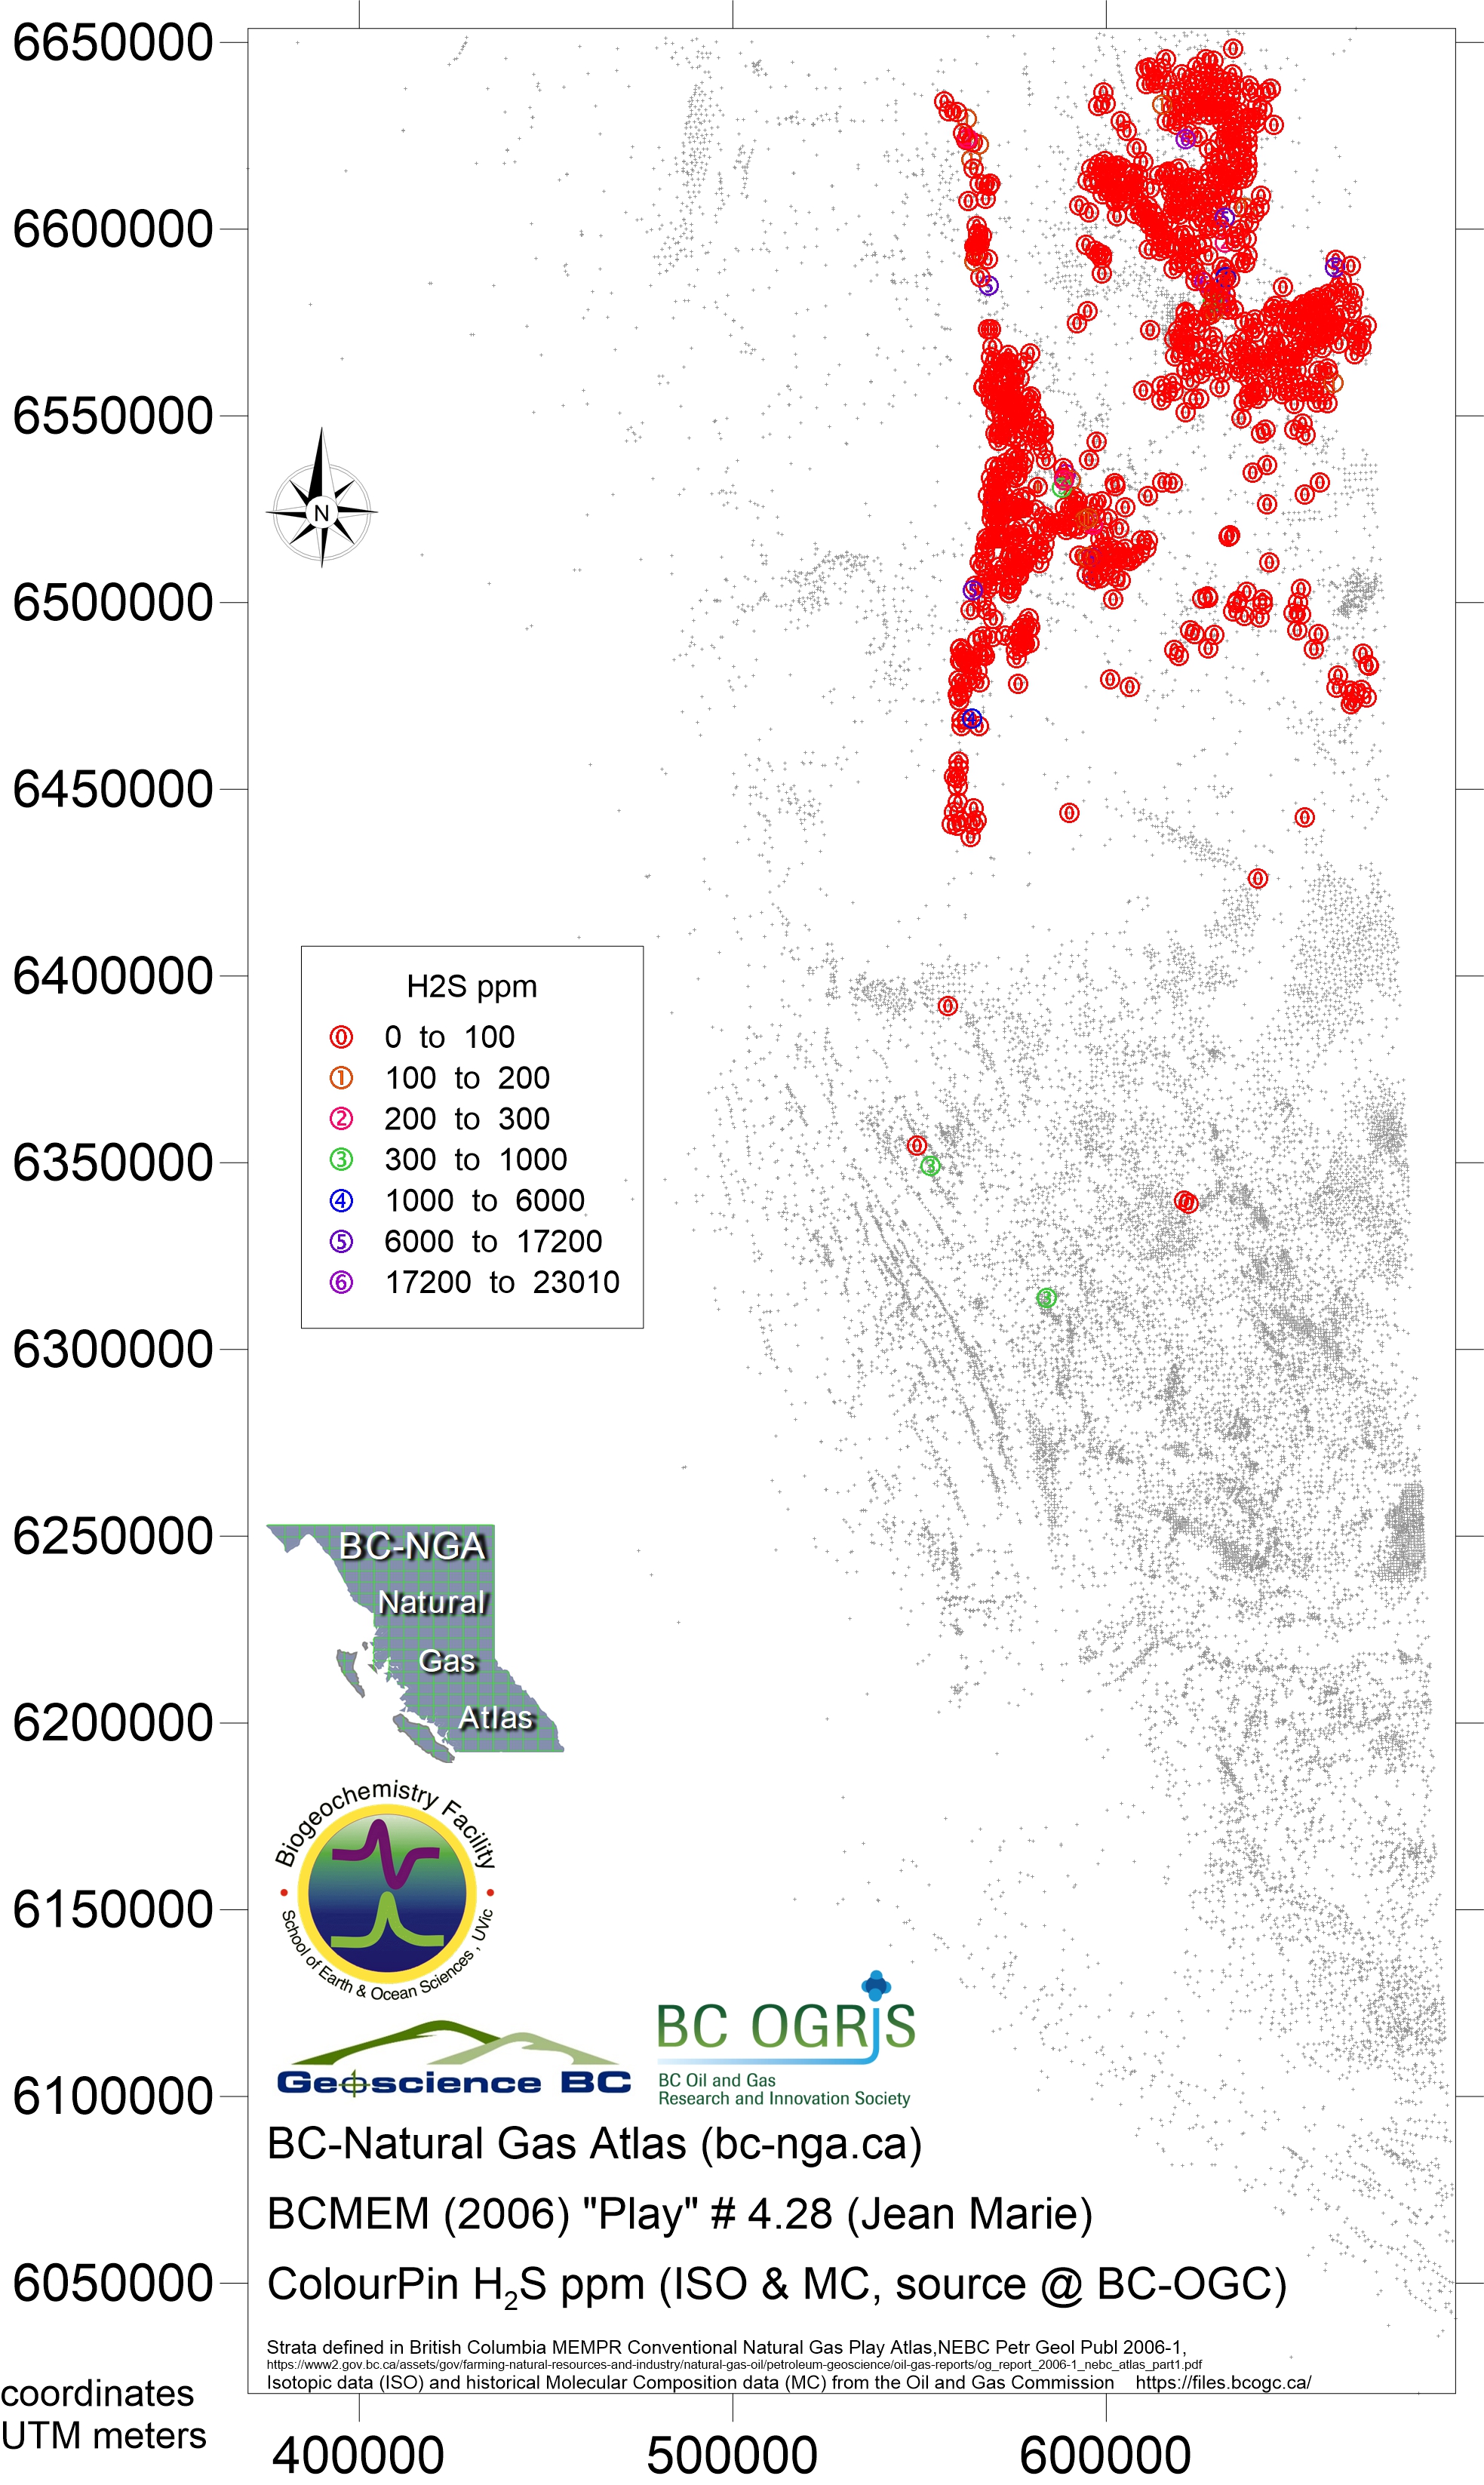
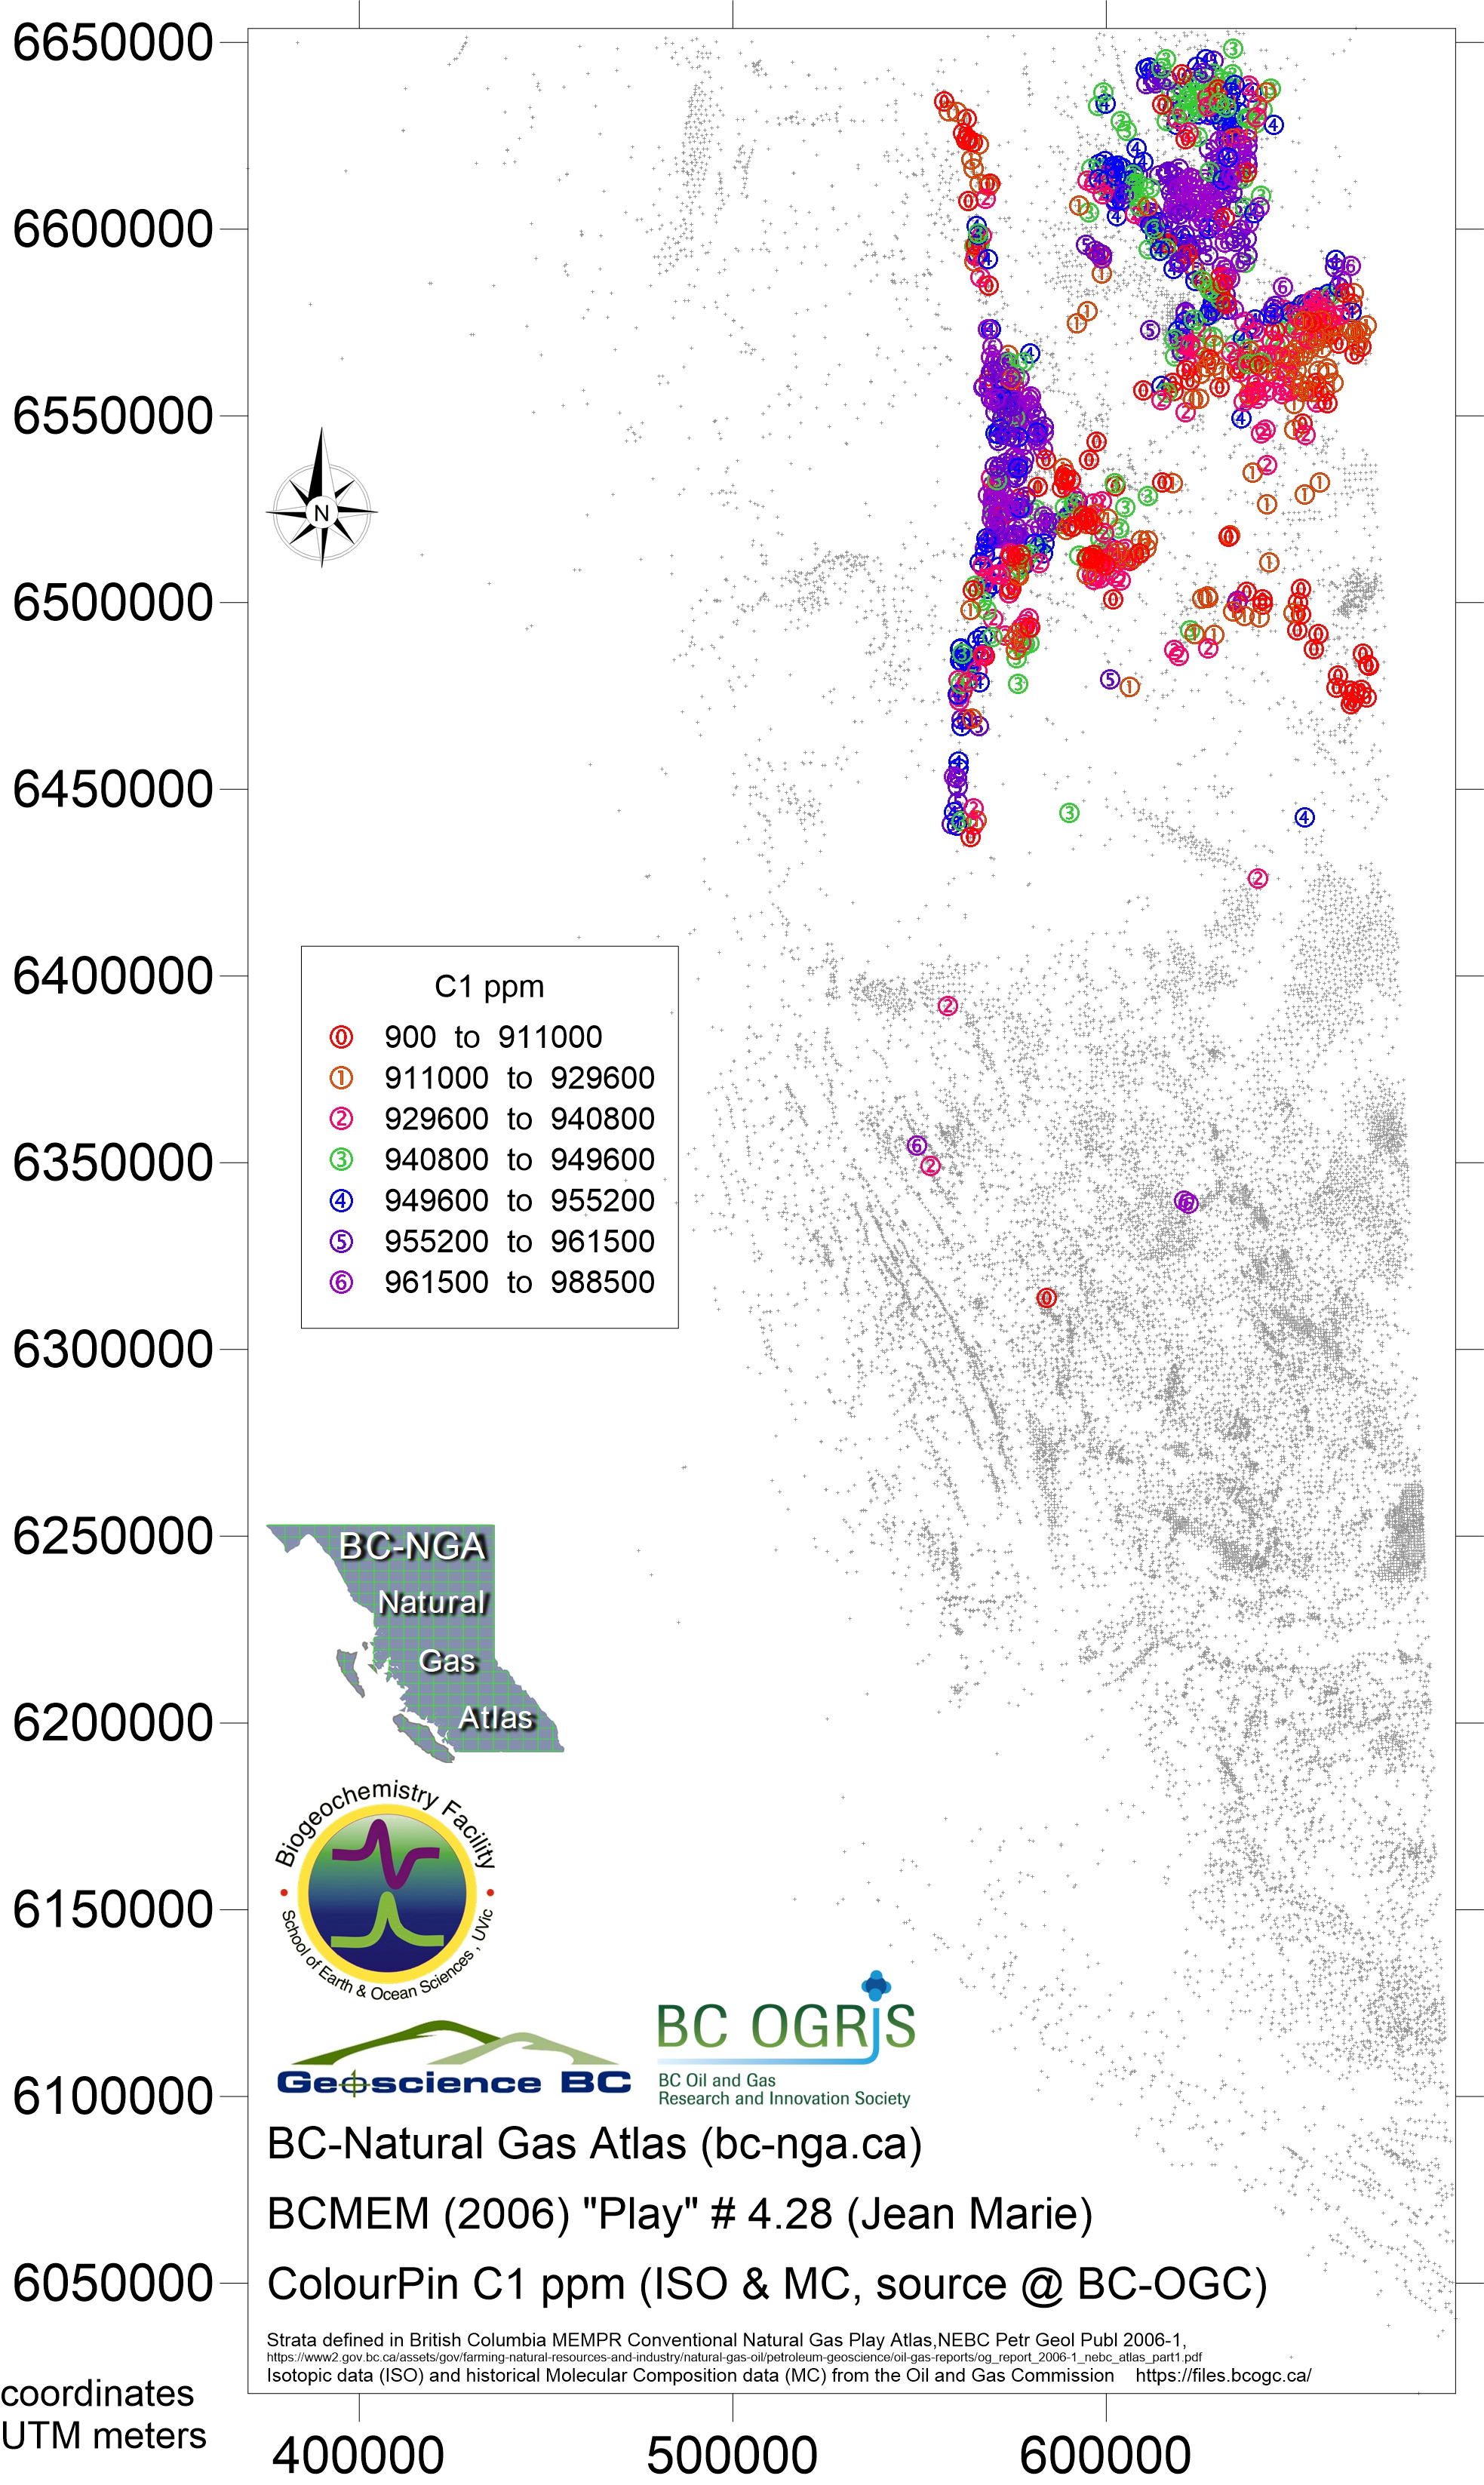
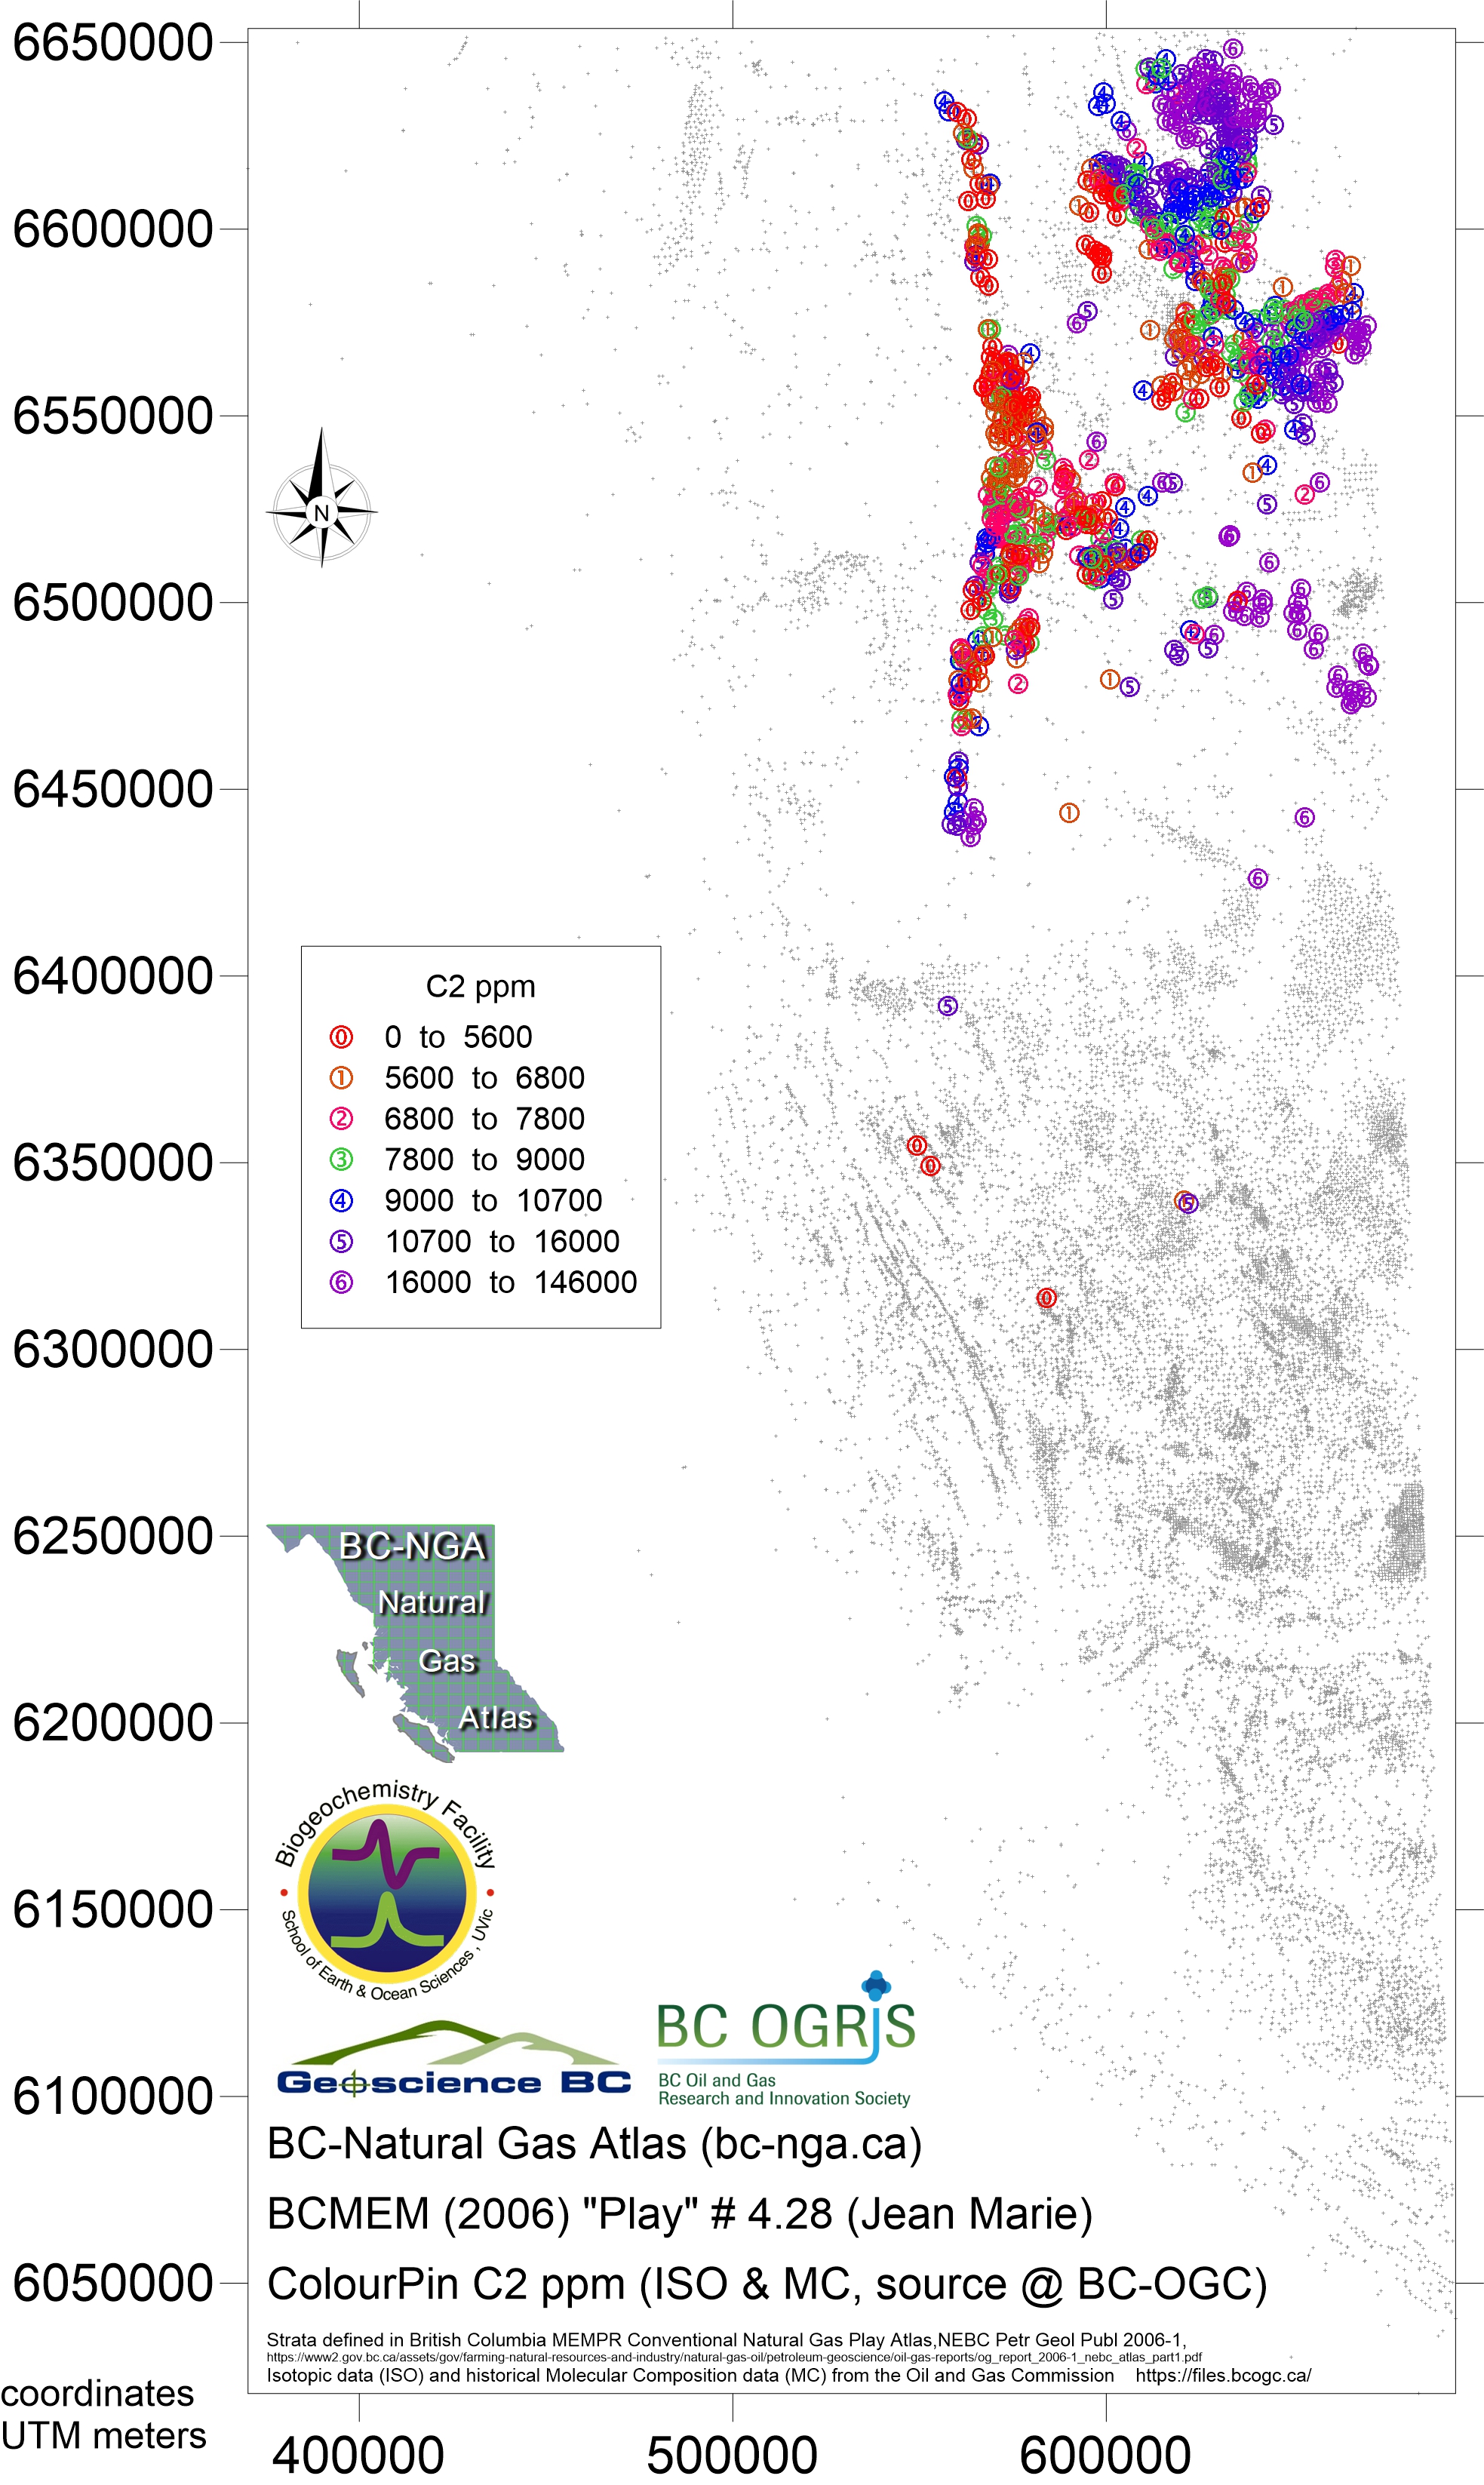
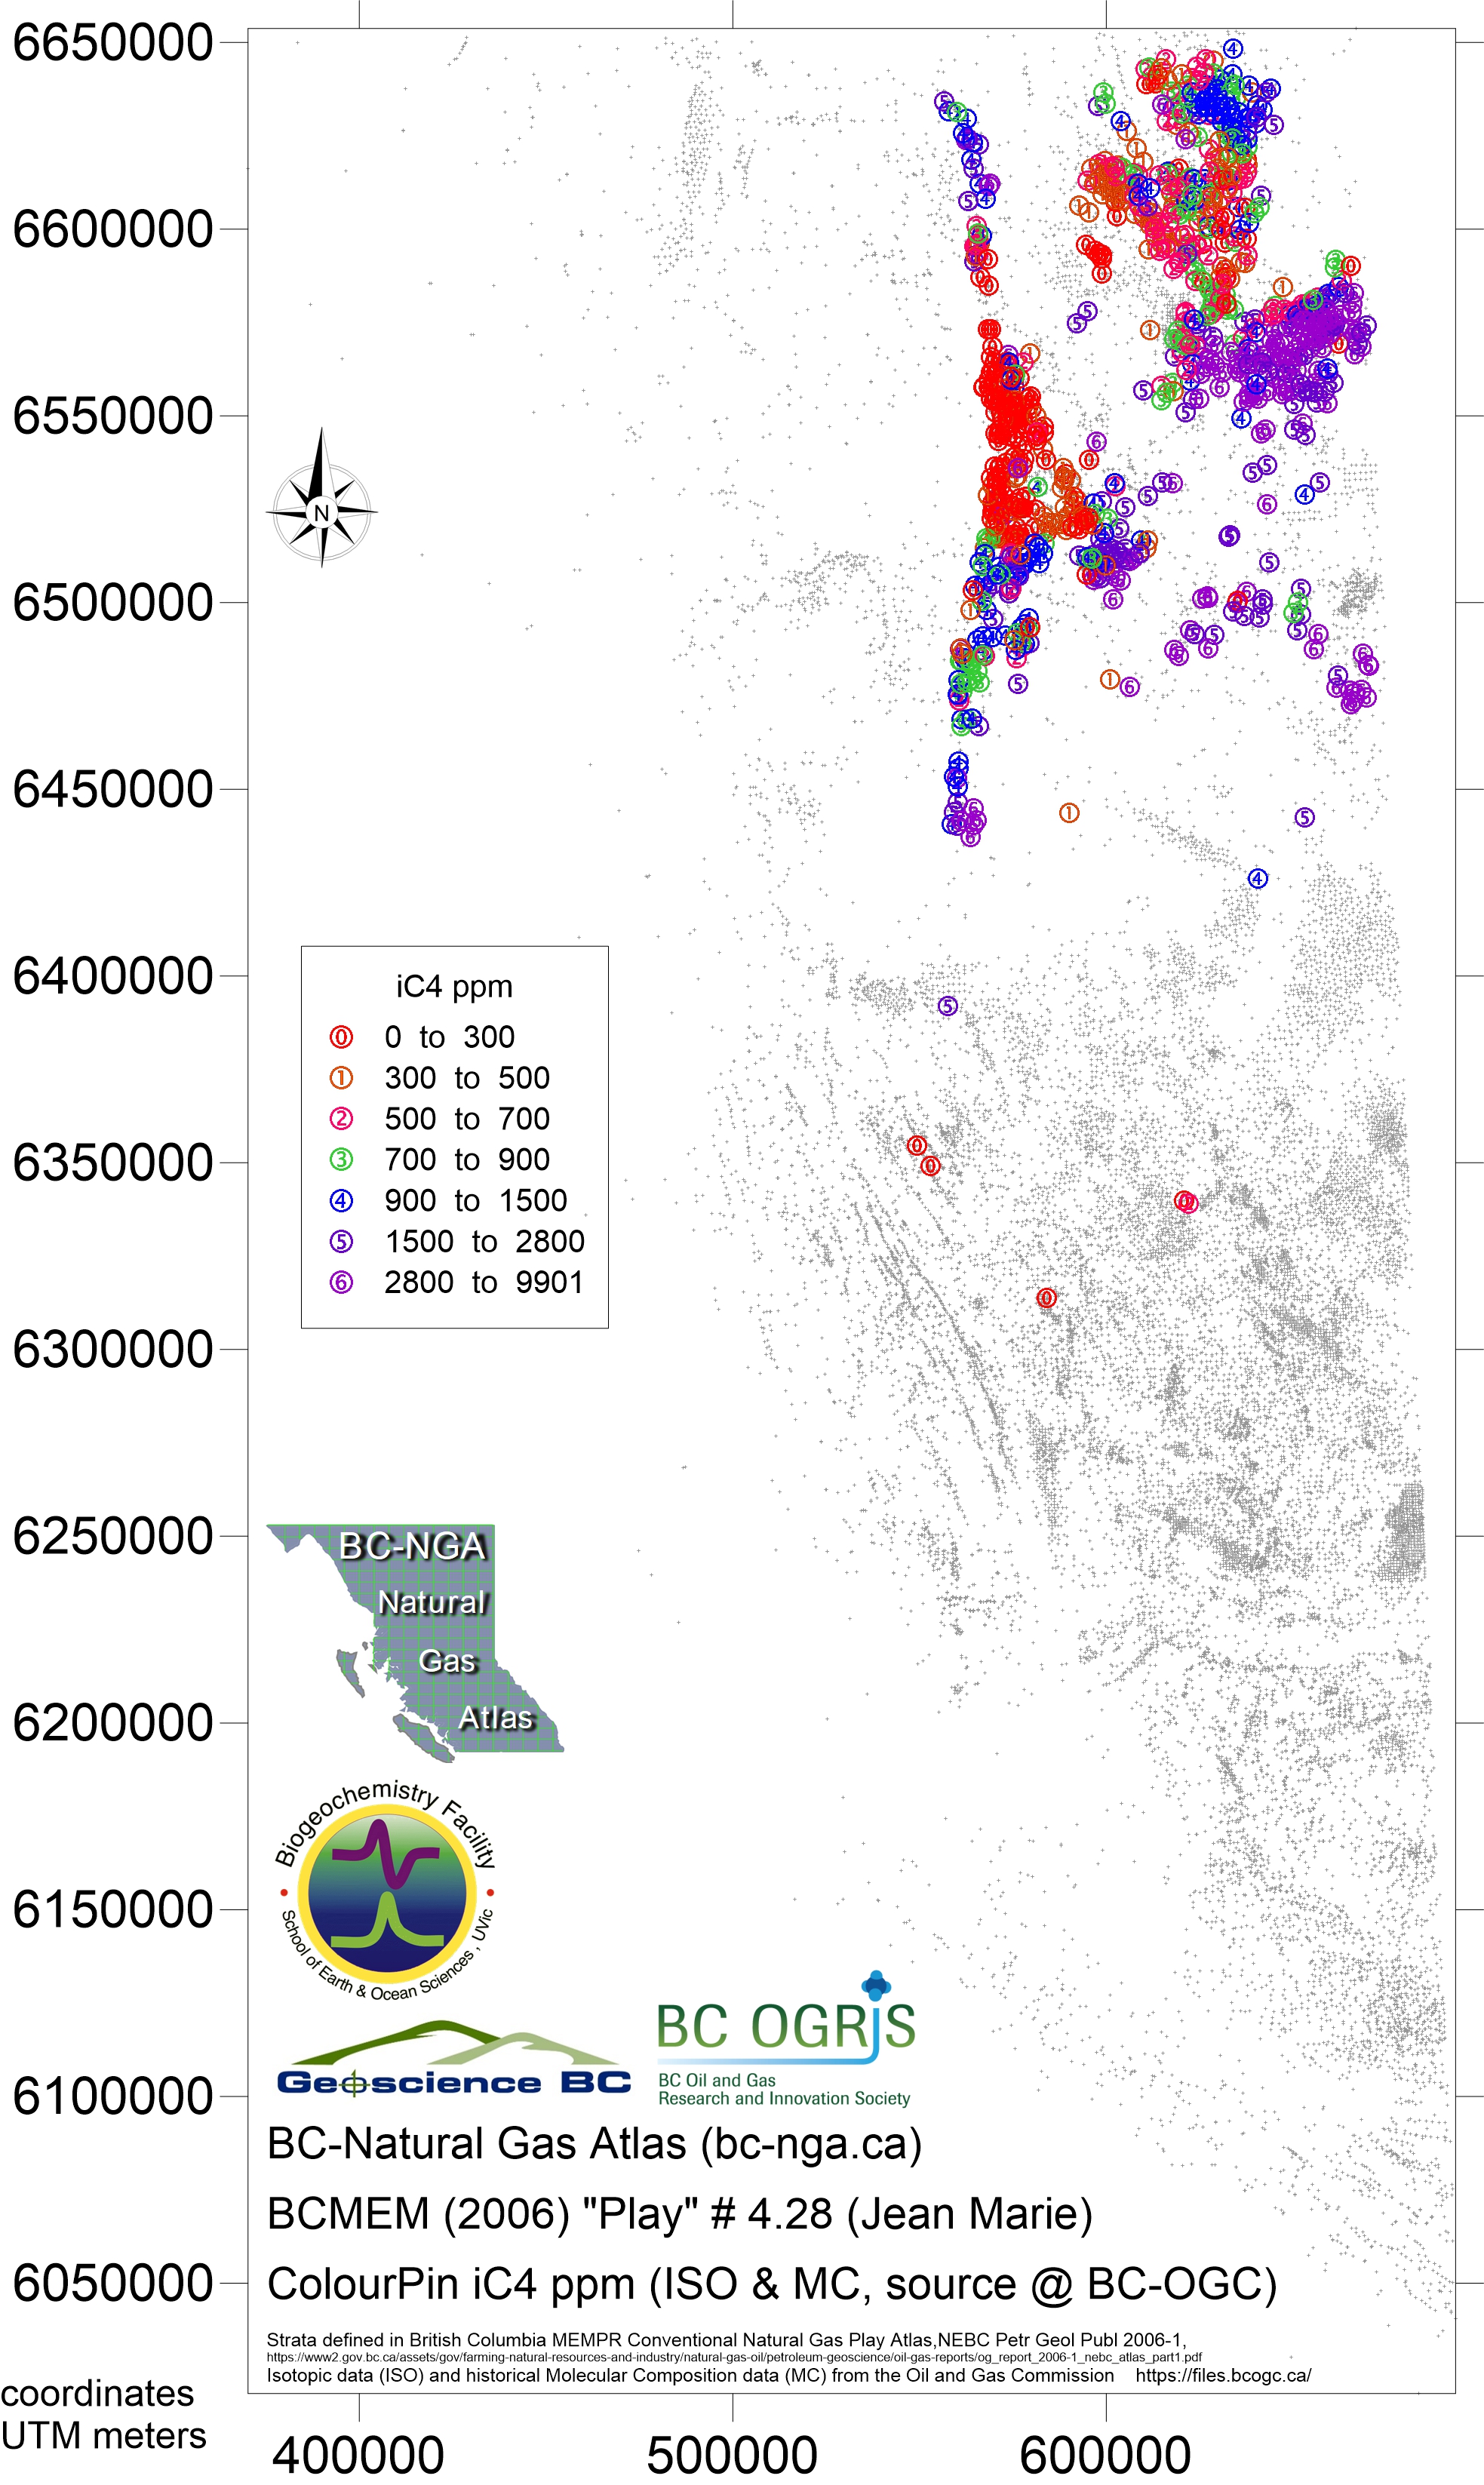
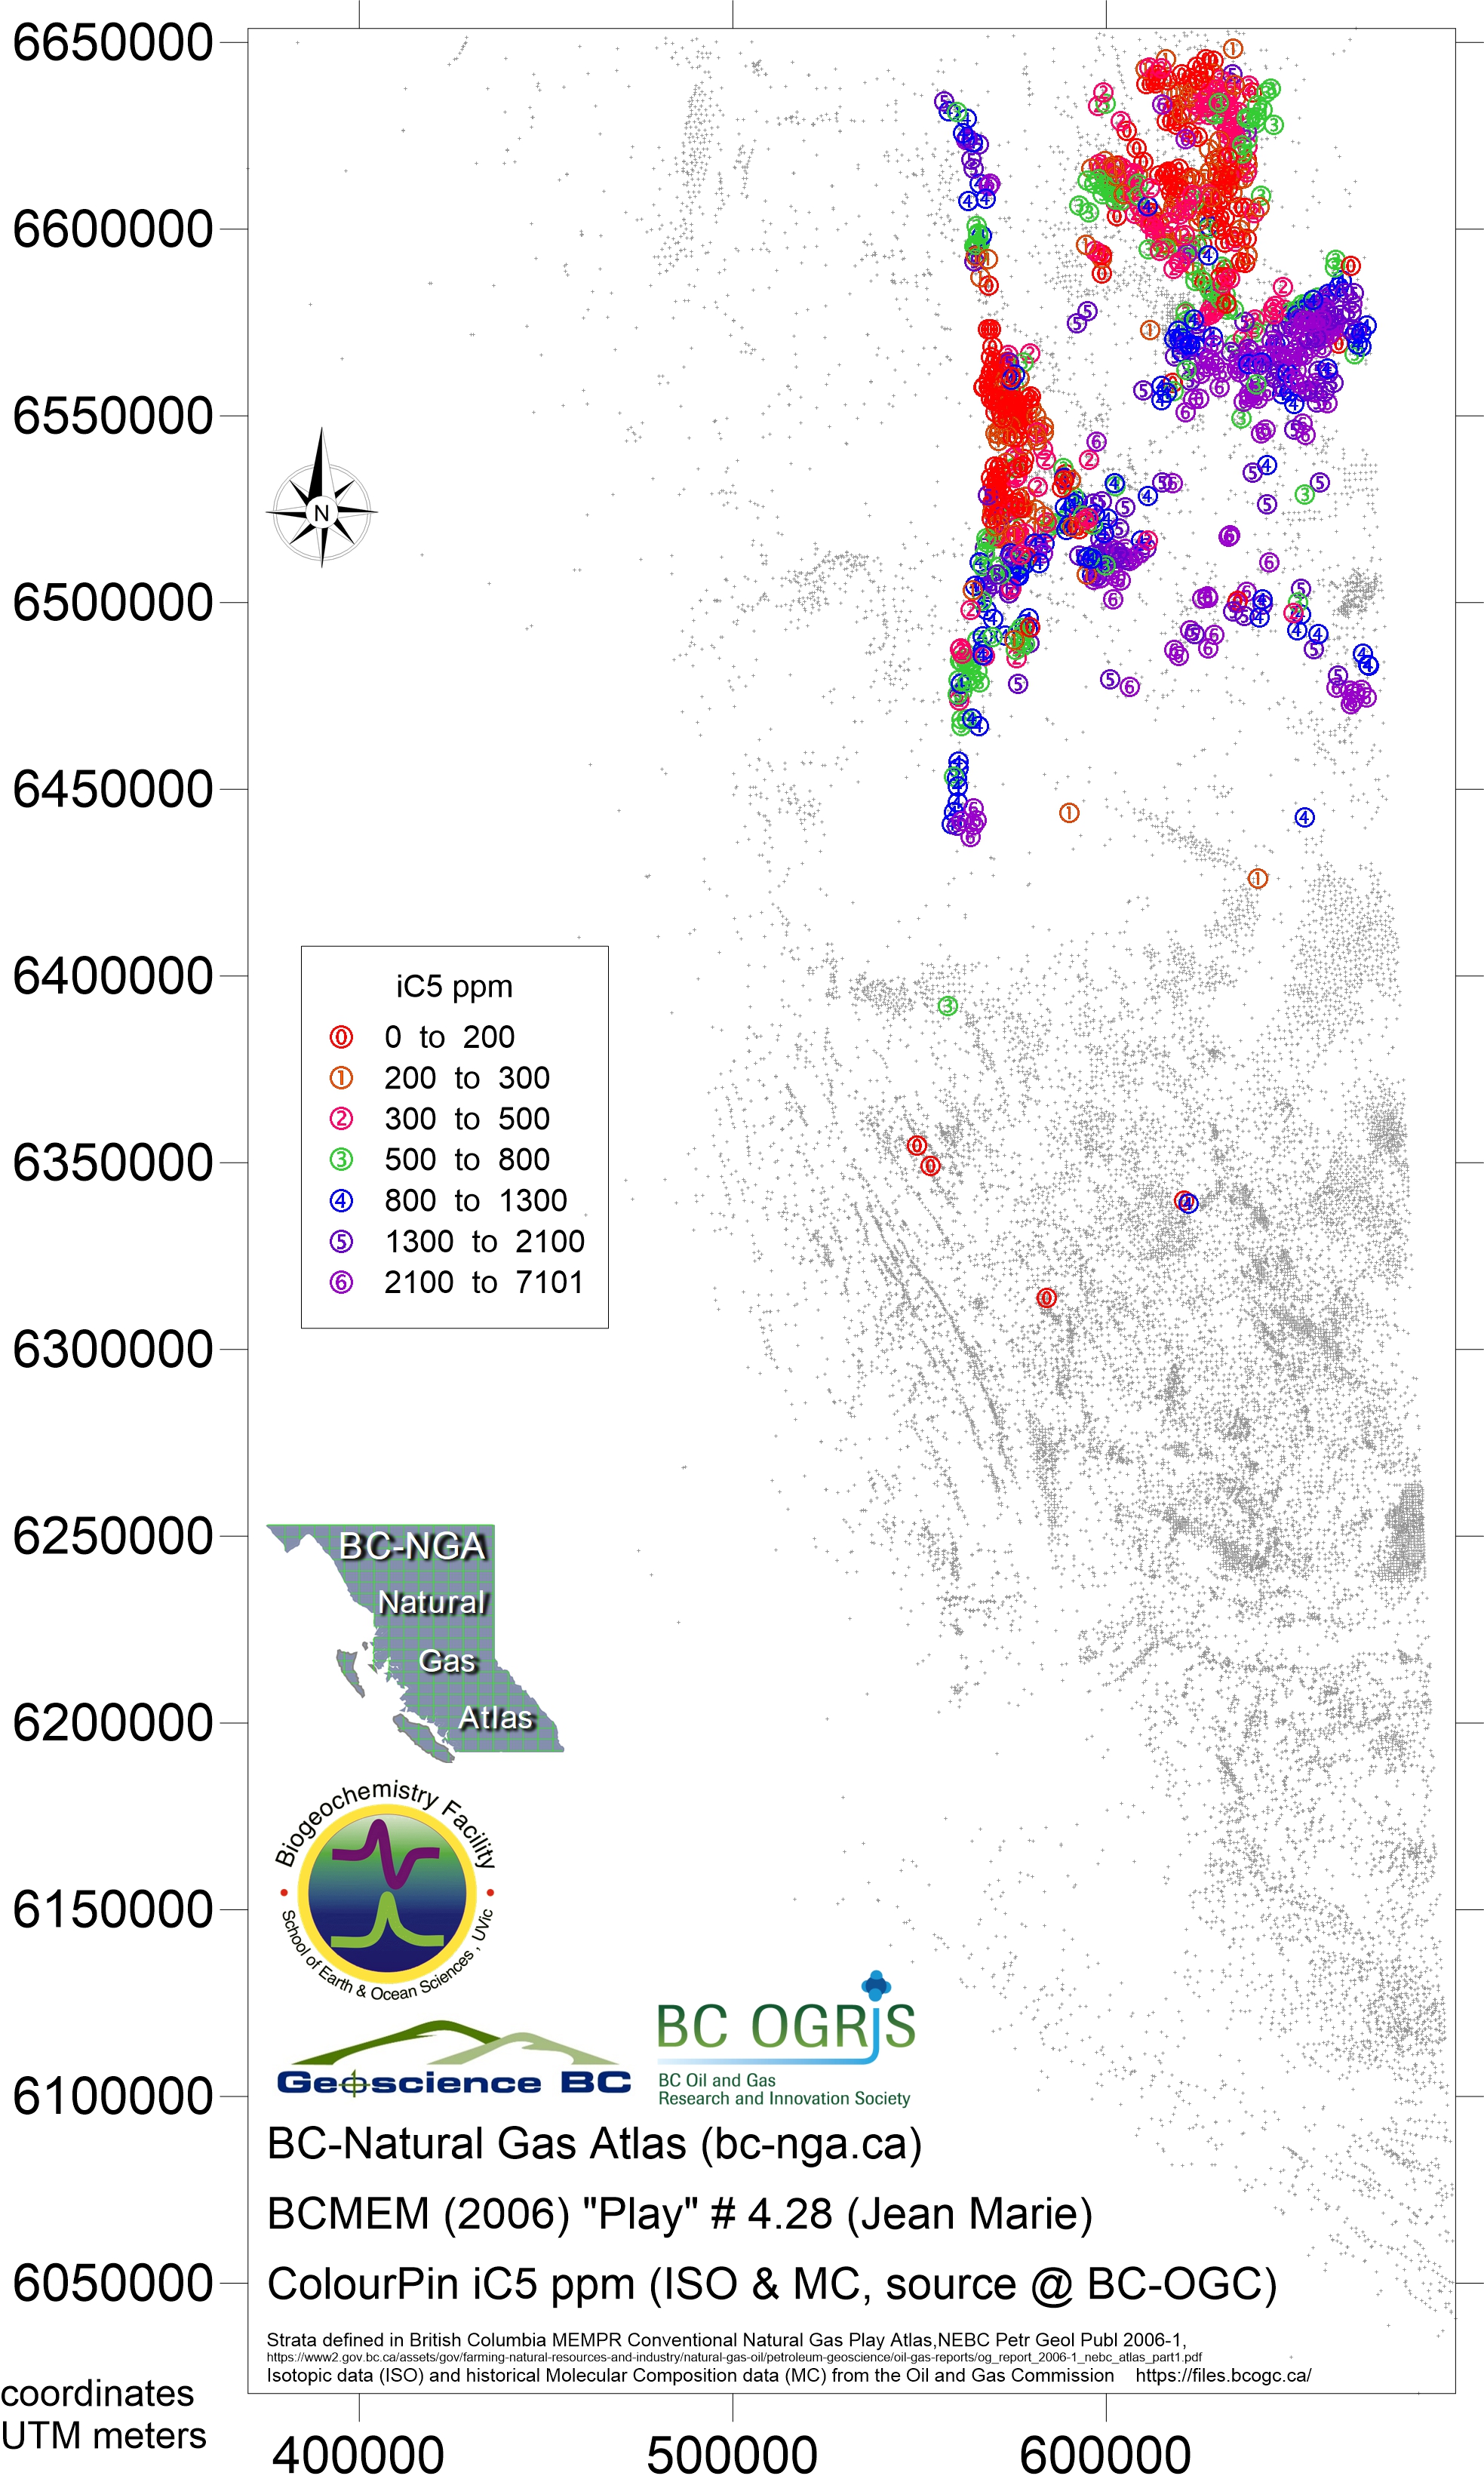
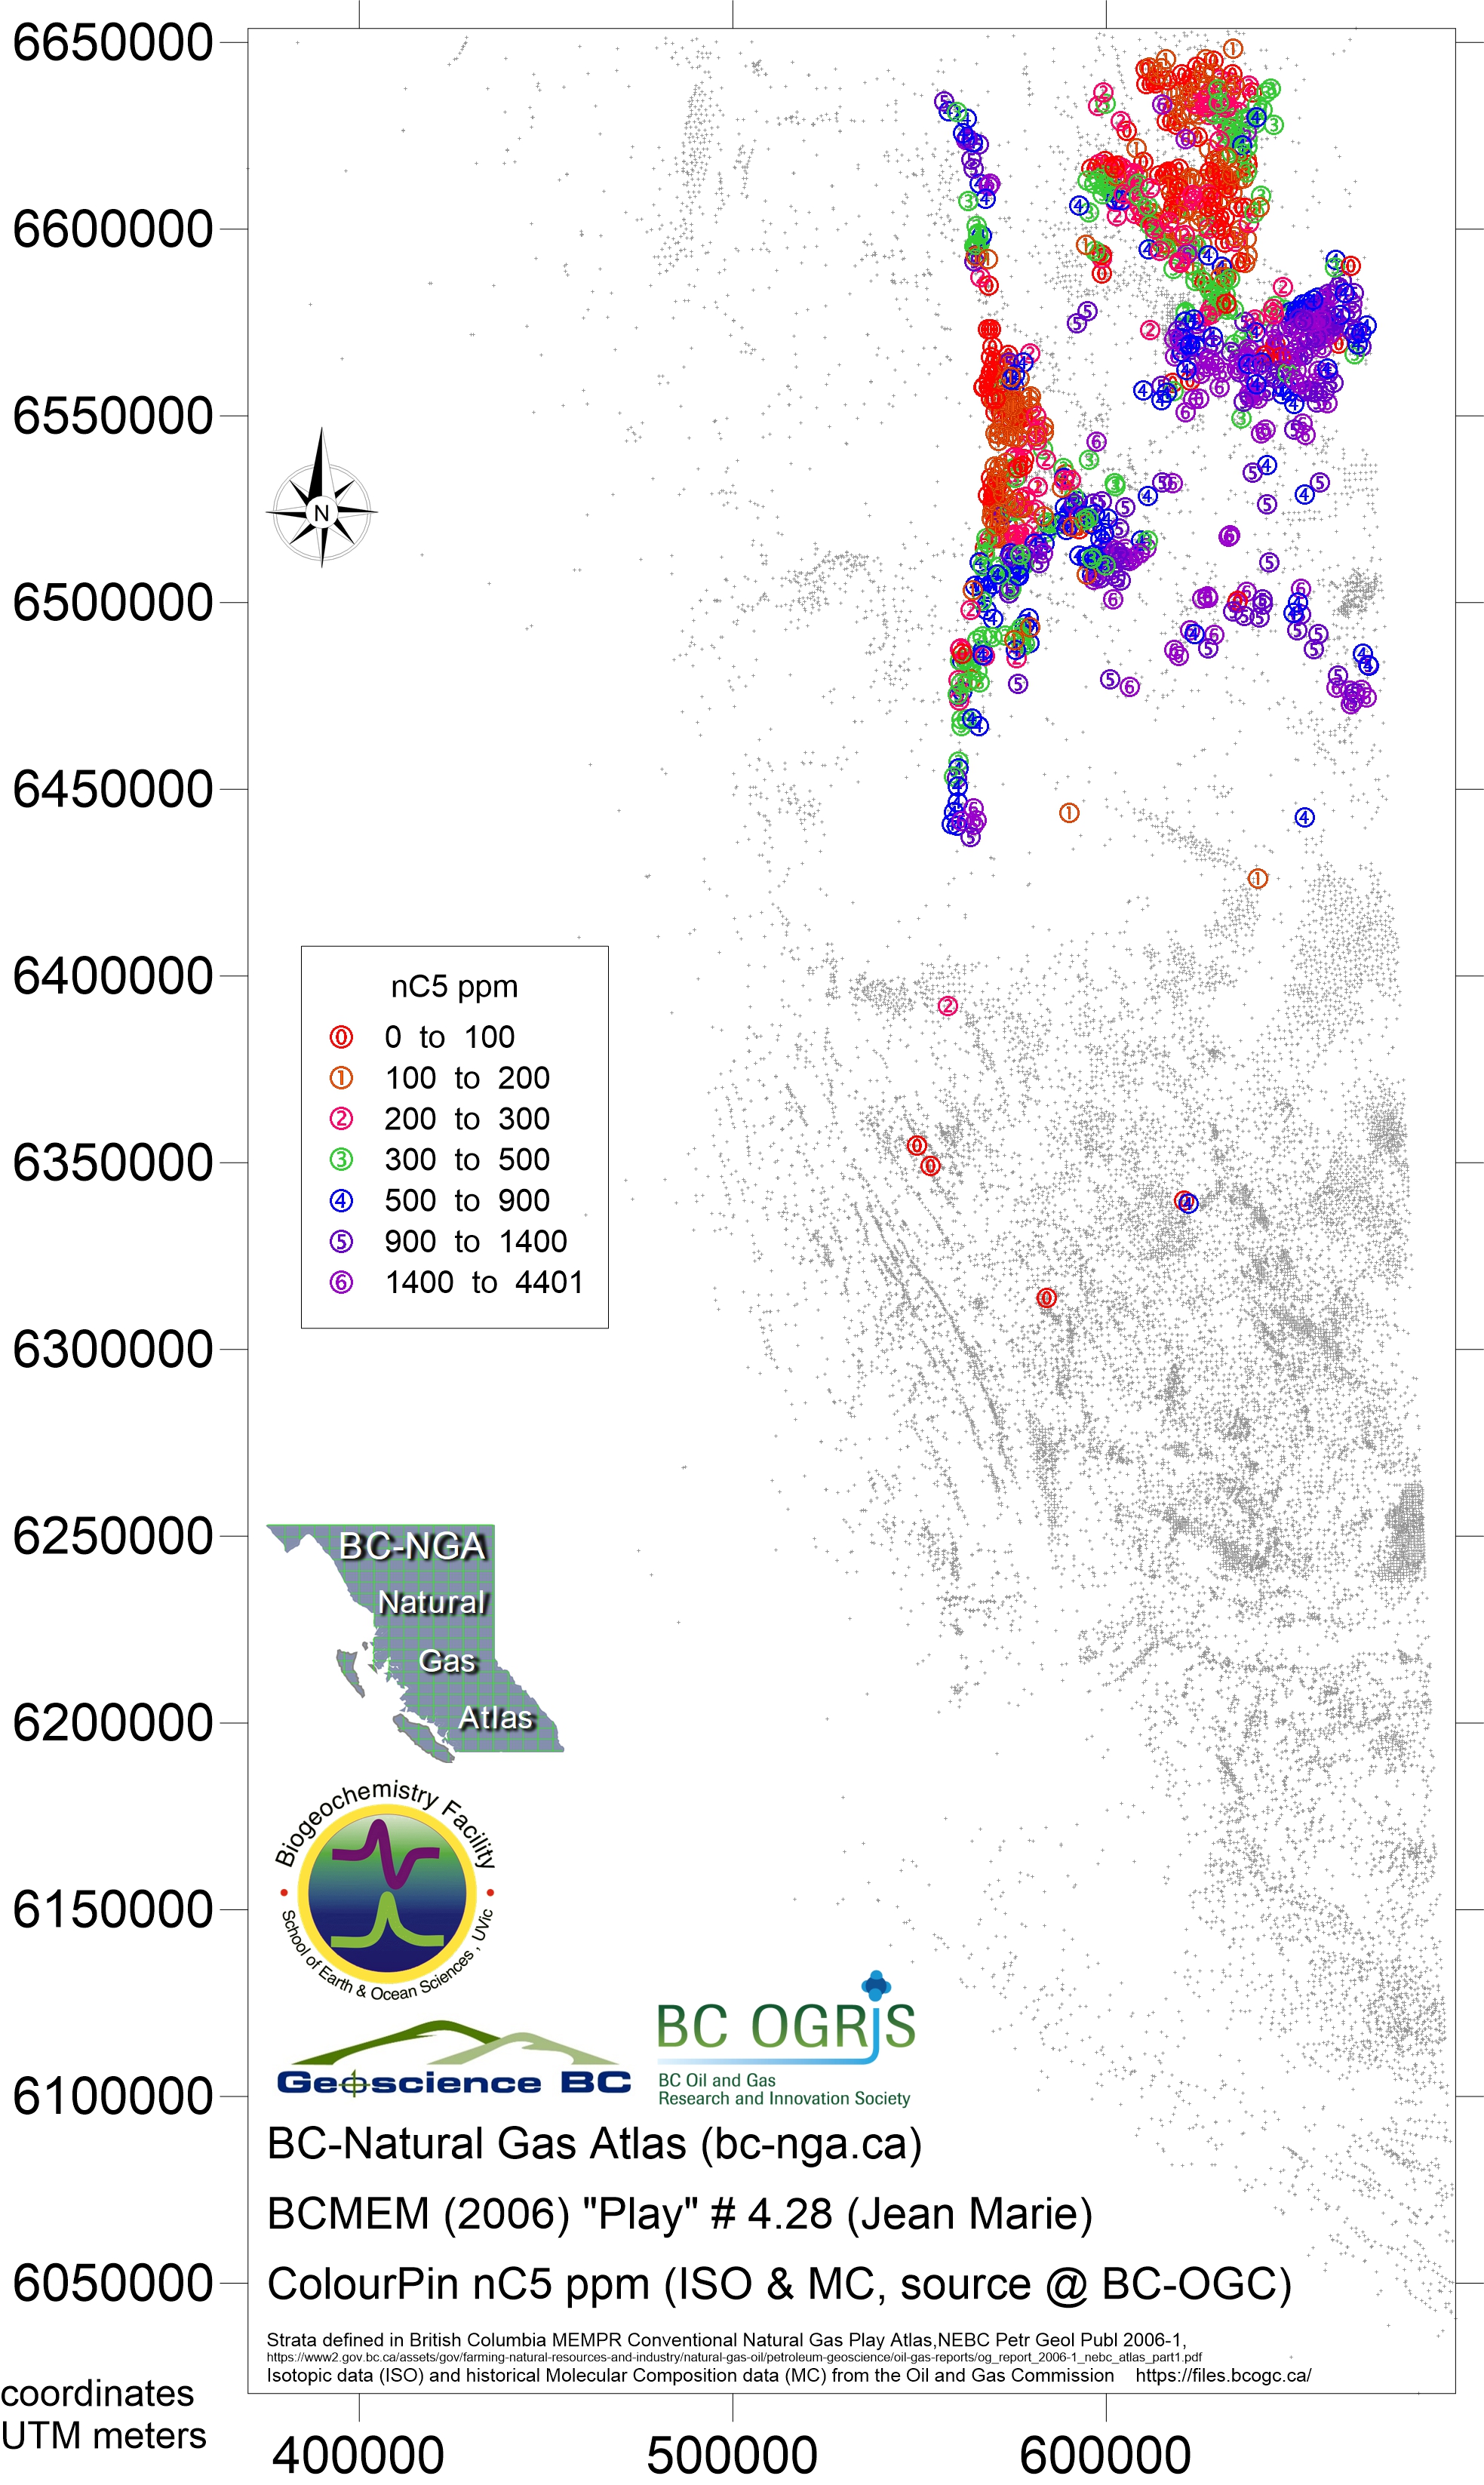
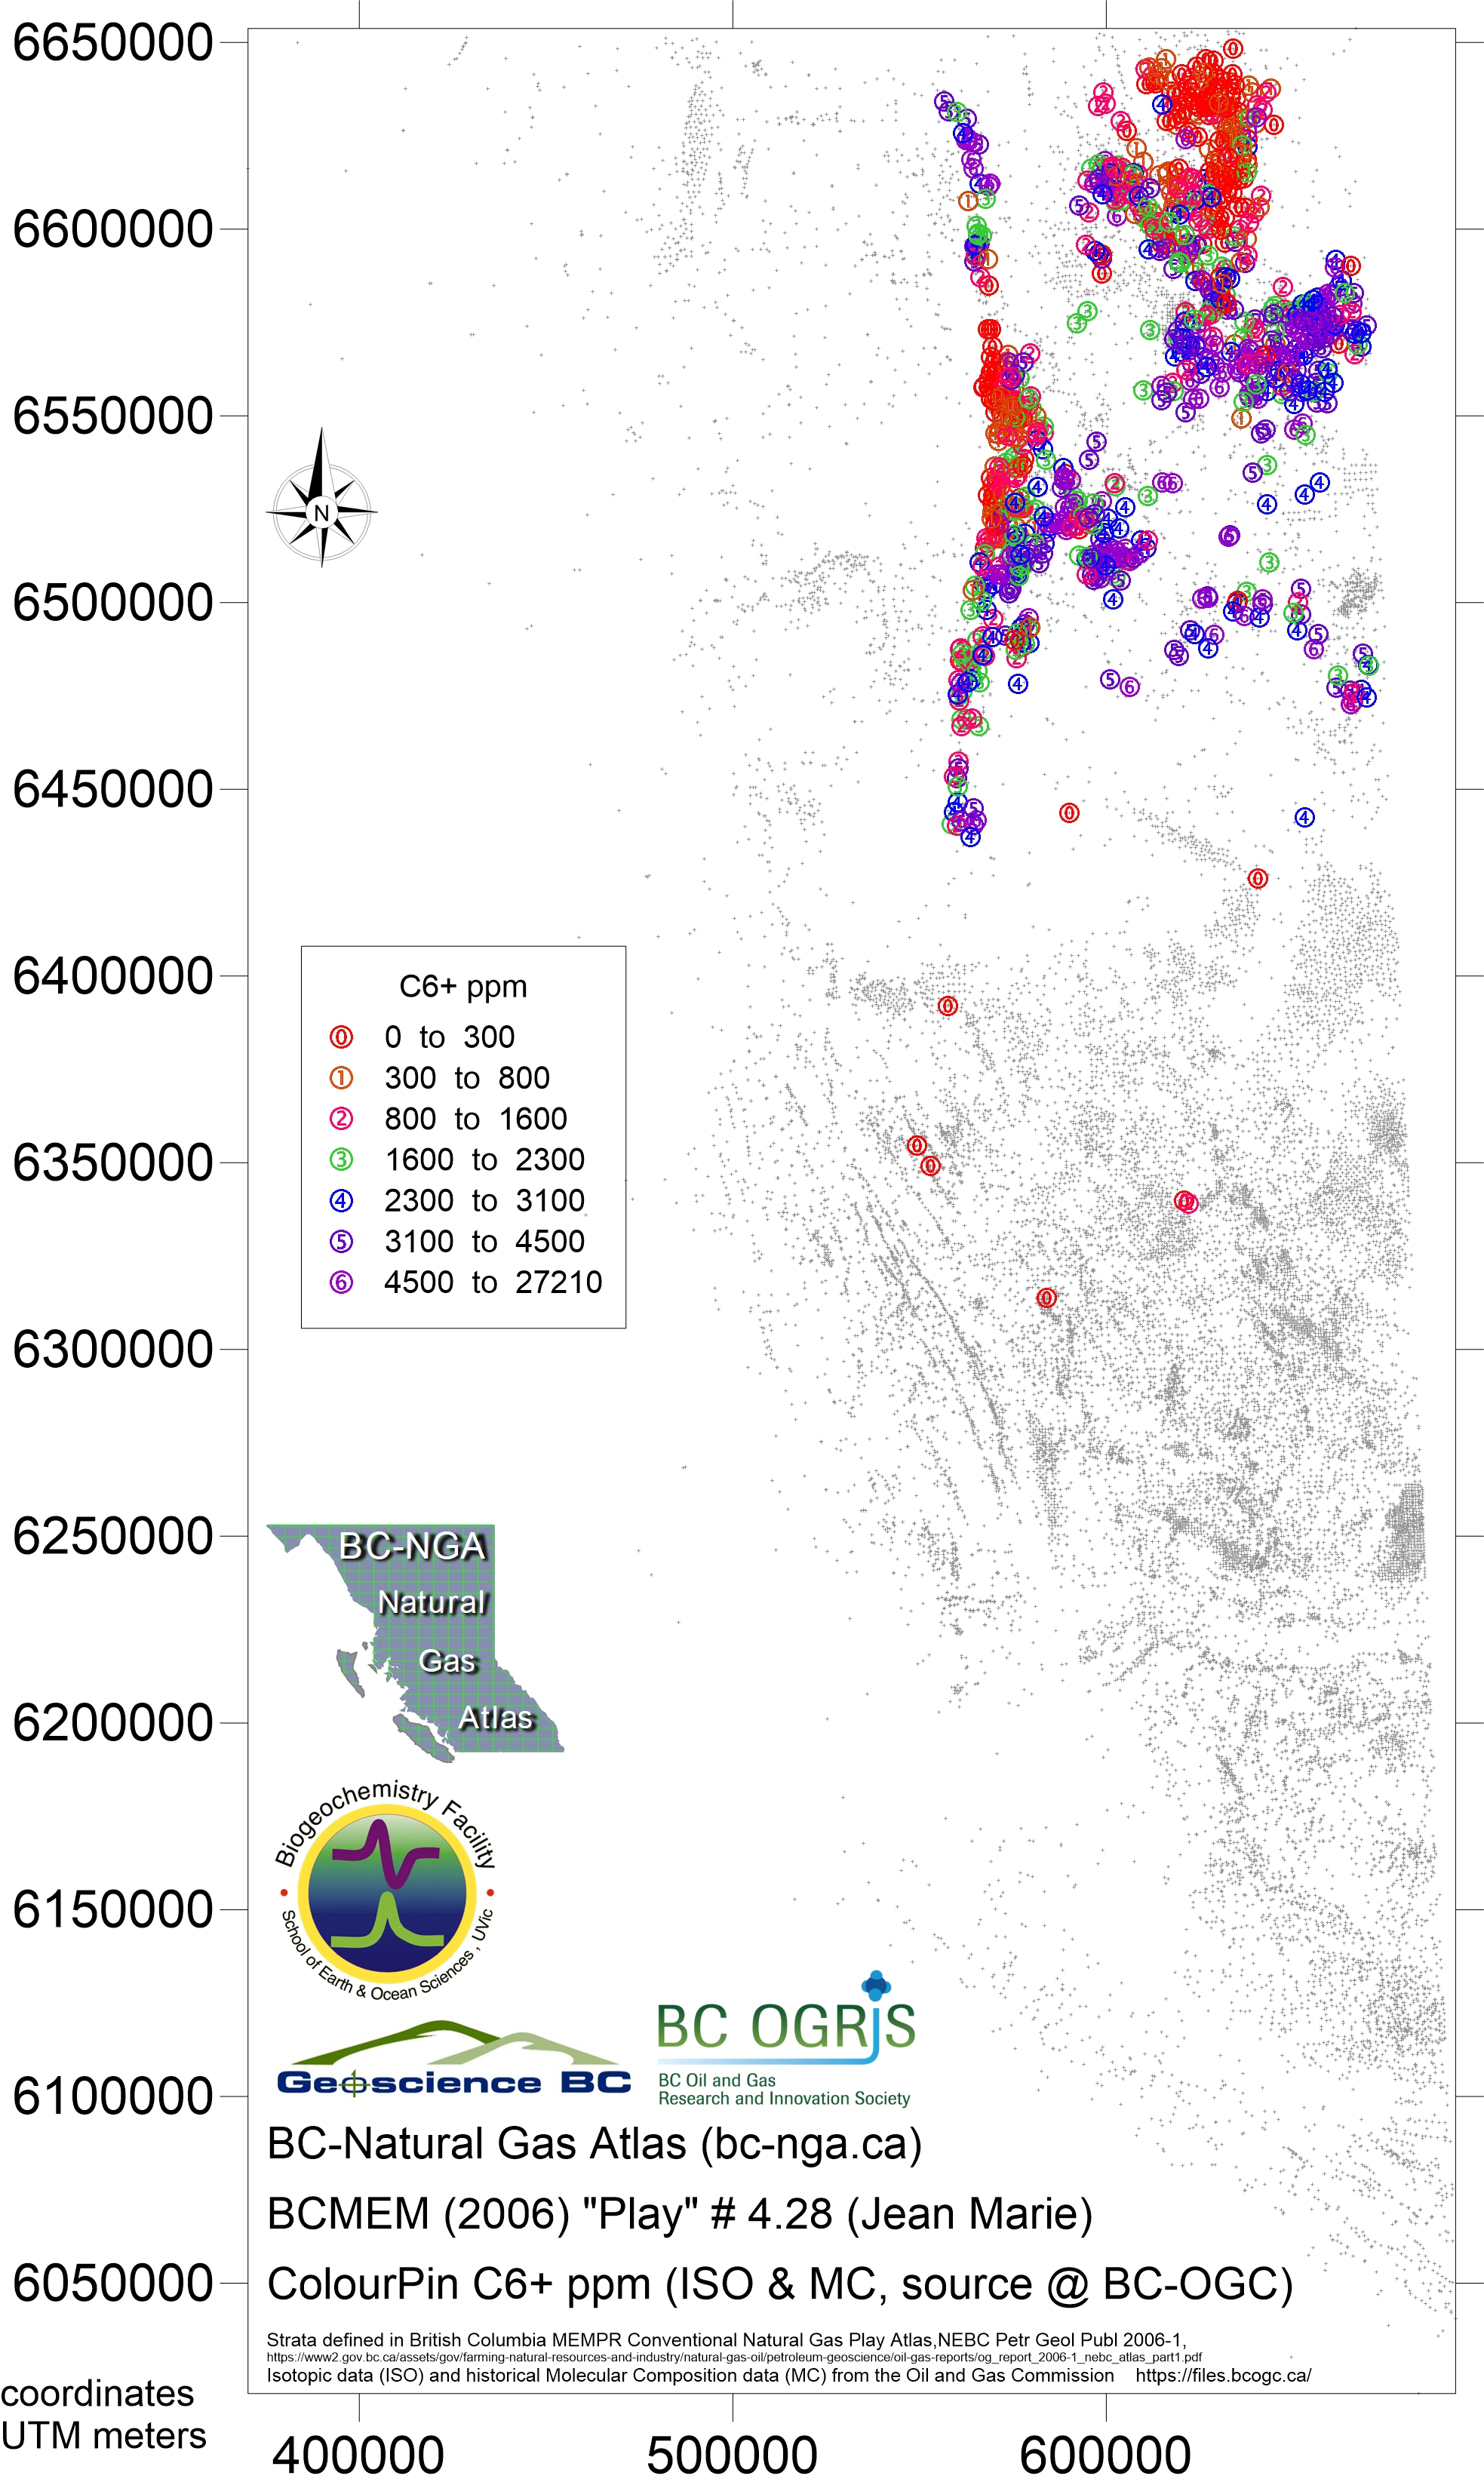
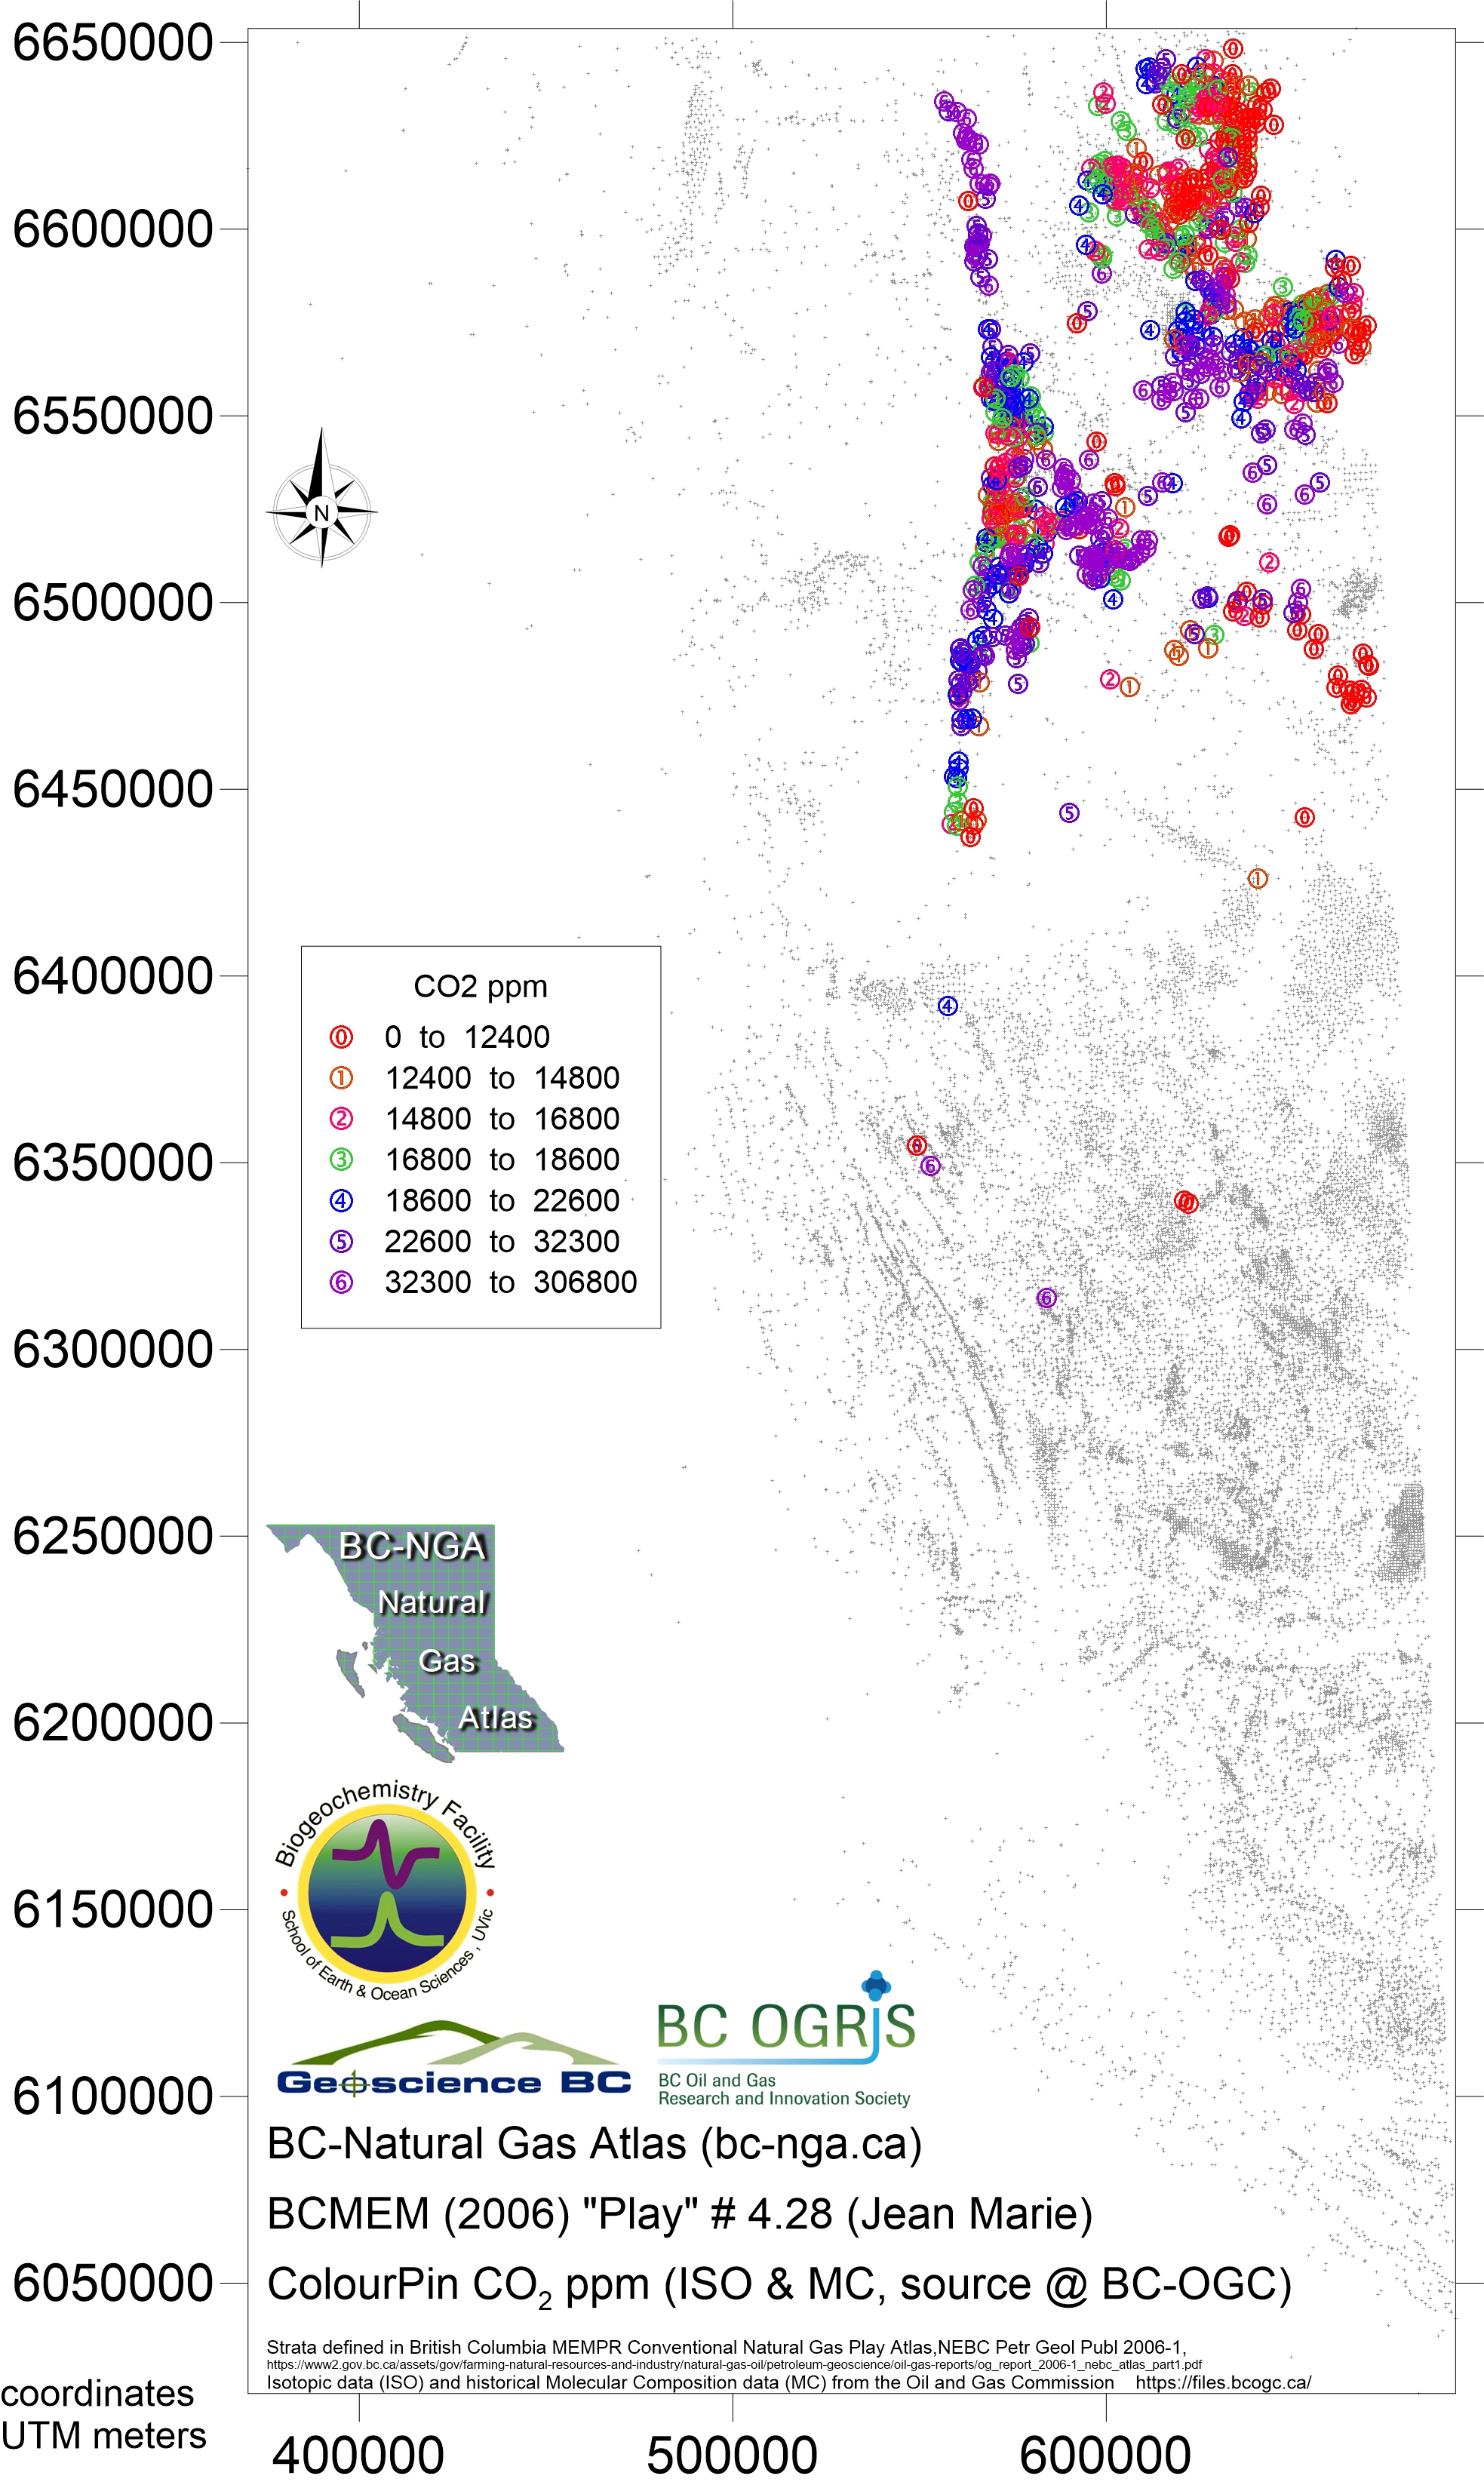
Play 4.28 Jean Marie / Muskwa Formations and equivalents
- Map303 Nov 2018 play 4.28 Jean Marie eqv Bernard ratio
- Map304 Nov 2018 play 4.28 Jean Marie eqv dryness ratio
- Map305 Nov 2018 play 4.28 Jean Marie eqv iC4nC4 ratio
- Map306 Nov 2018 play 4.28 Jean Marie eqv H2S ppm
- Map307 Nov 2018 play 4.28 Jean Marie eqv CH4 ppm
- Map308 Nov 2018 play 4.28 Jean Marie eqv C2H6 ppm
- Map309 Nov 2018 play 4.28 Jean Marie eqv C3H8 ppm
- Map310 Nov 2018 play 4.28 Jean Marie eqv iC4H10 ppm
- Map311 Nov 2018 play 4.28 Jean Marie eqv nC4H10 ppm
- Map312 Nov 2018 play 4.28 Jean Marie eqv iC5H12 ppm
- Map313 Nov 2018 play 4.28 Jean Marie eqv nC5H12 ppm
- Map314 Nov 2018 play 4.28 Jean Marie eqv C6H14 plus ppm
- Map315 Nov 2018 play 4.28 Jean Marie eqv CO2 ppm
- Map316 Nov 2018 play 4.29a Muskwa eqv Bernard ratio
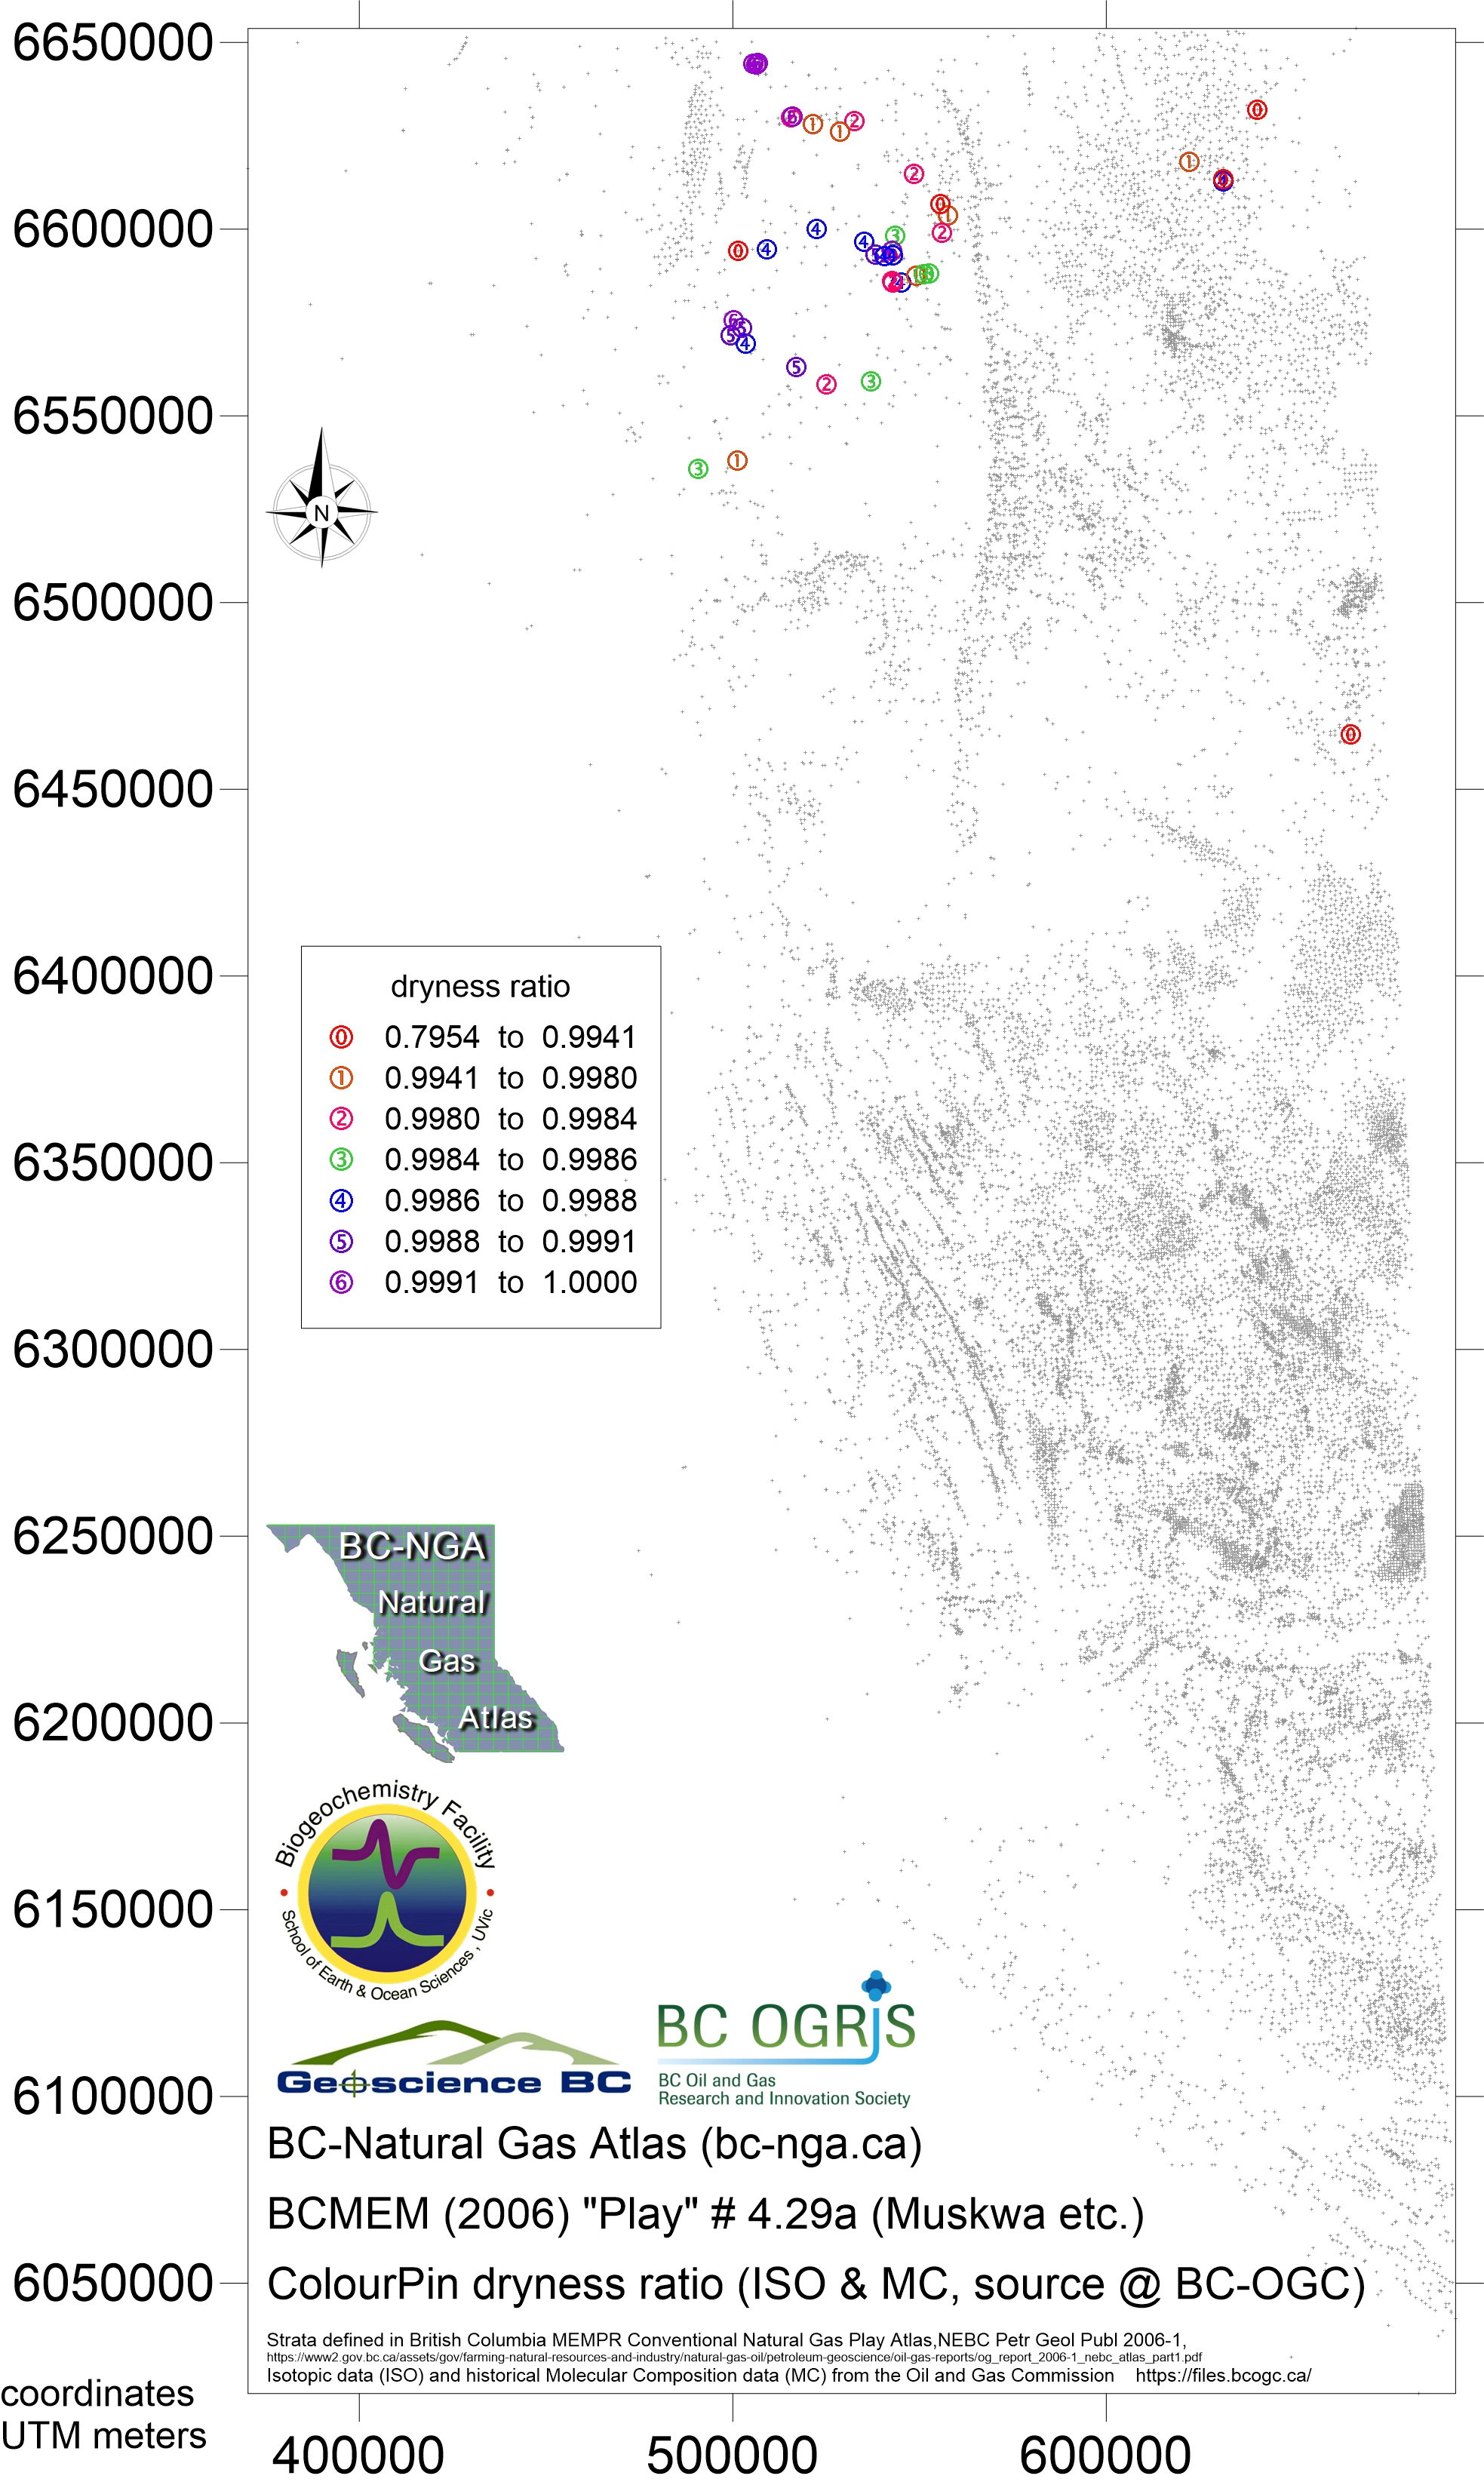
- Map317 Nov 2018 play 4.29a Muskwa eqv dryness ratio
- Map318 Nov 2018 play 4.29a Muskwa eqv iC4nC4 ratio
- Map319 Nov 2018 play 4.29a Muskwa eqv ISO ratio
- Map320 Nov 2018 play 4.29a Muskwa eqv CH4 ppm
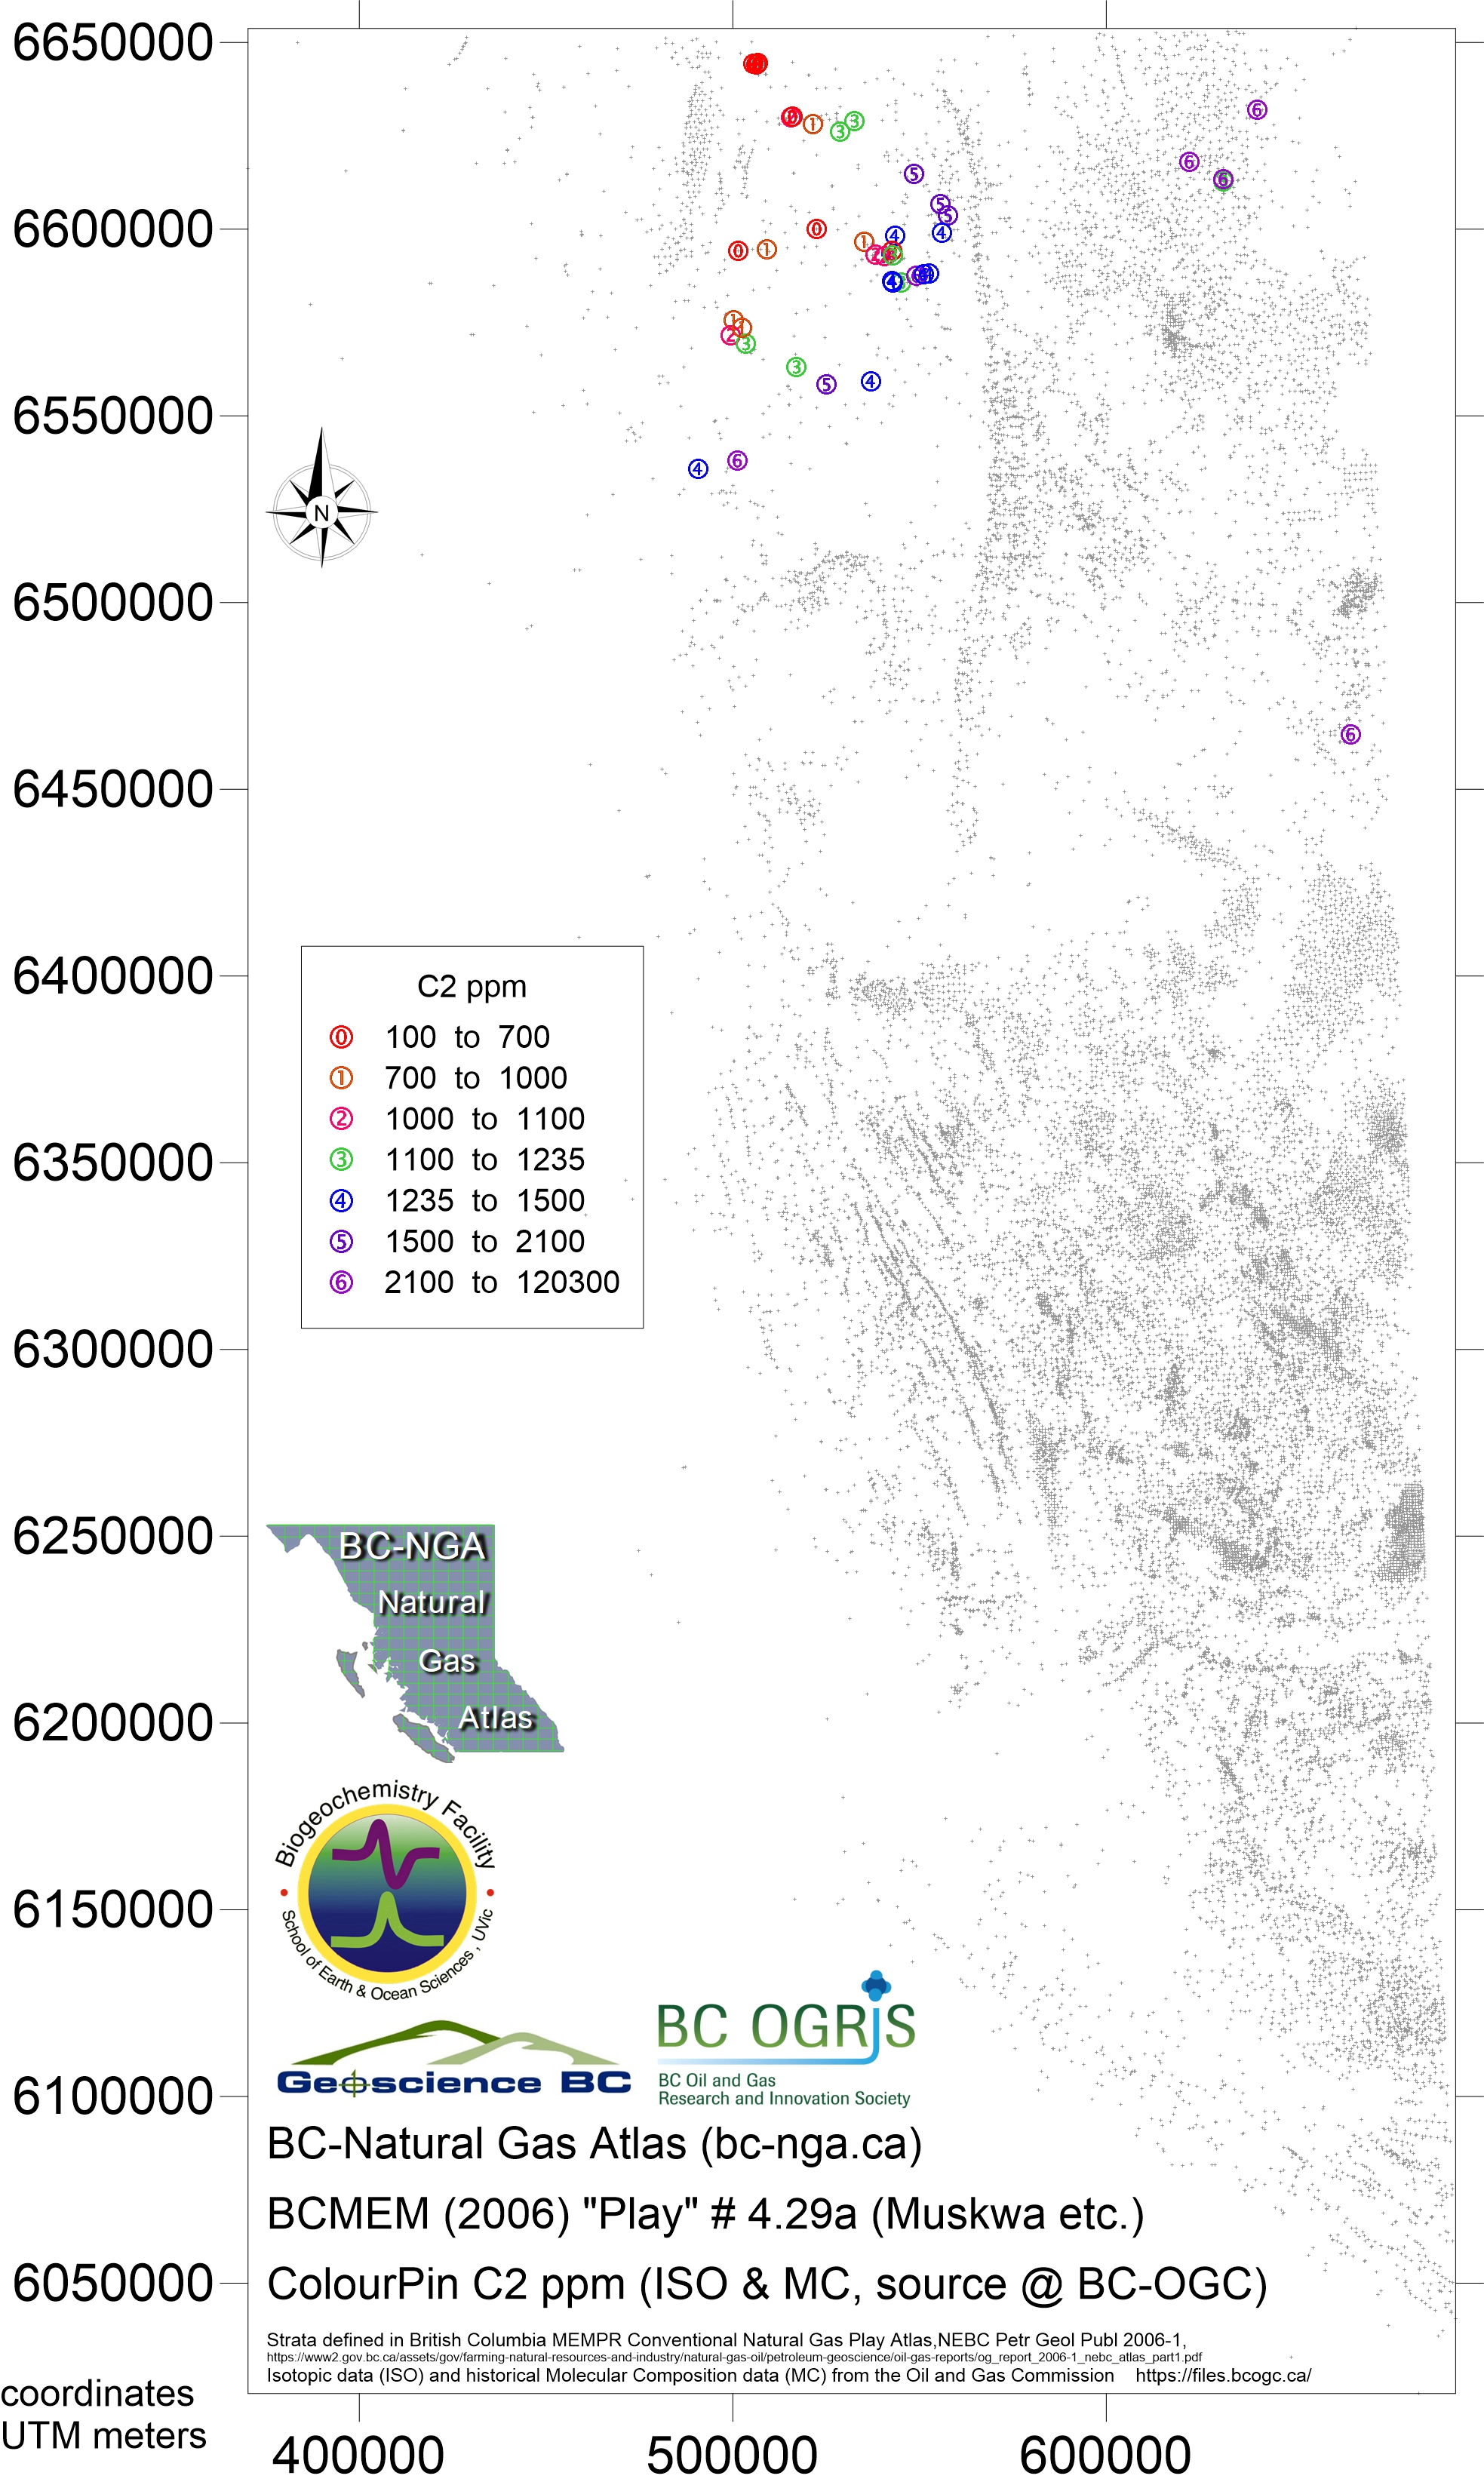
- Map321 Nov 2018 play 4.29a Muskwa eqv C2H6 ppm
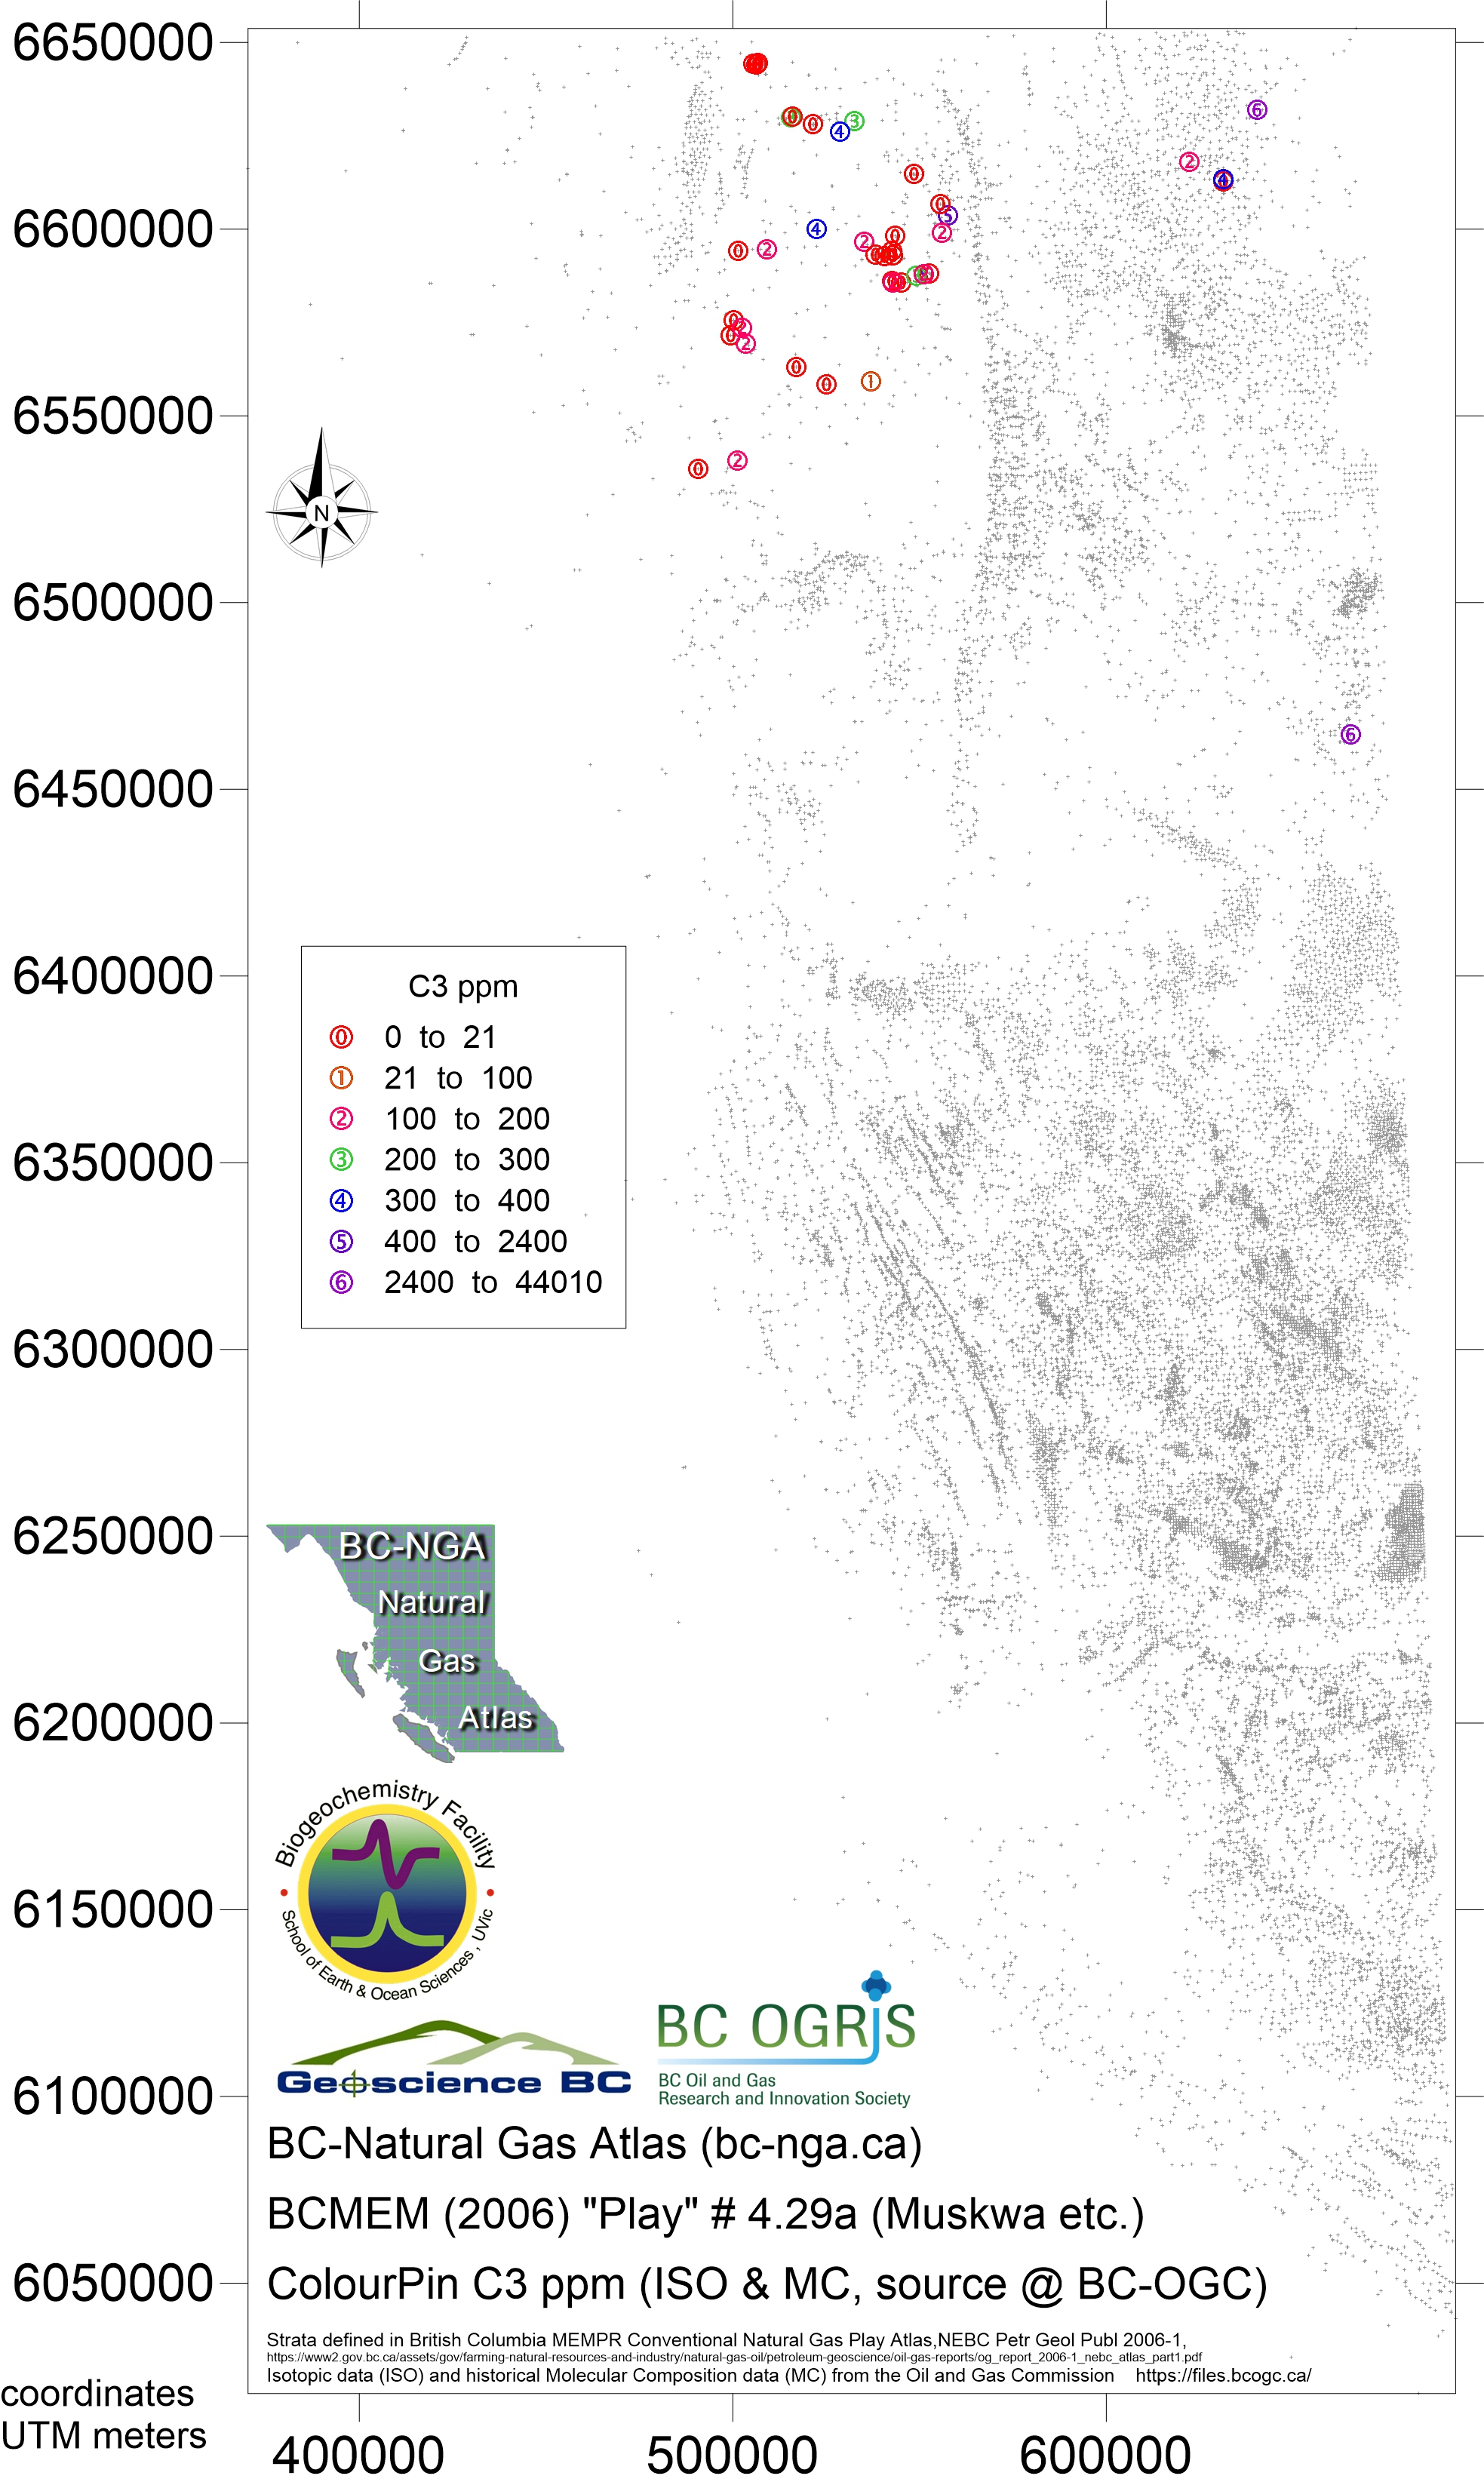
- Map322 Nov 2018 play 4.29a Muskwa eqv C3H8 ppm
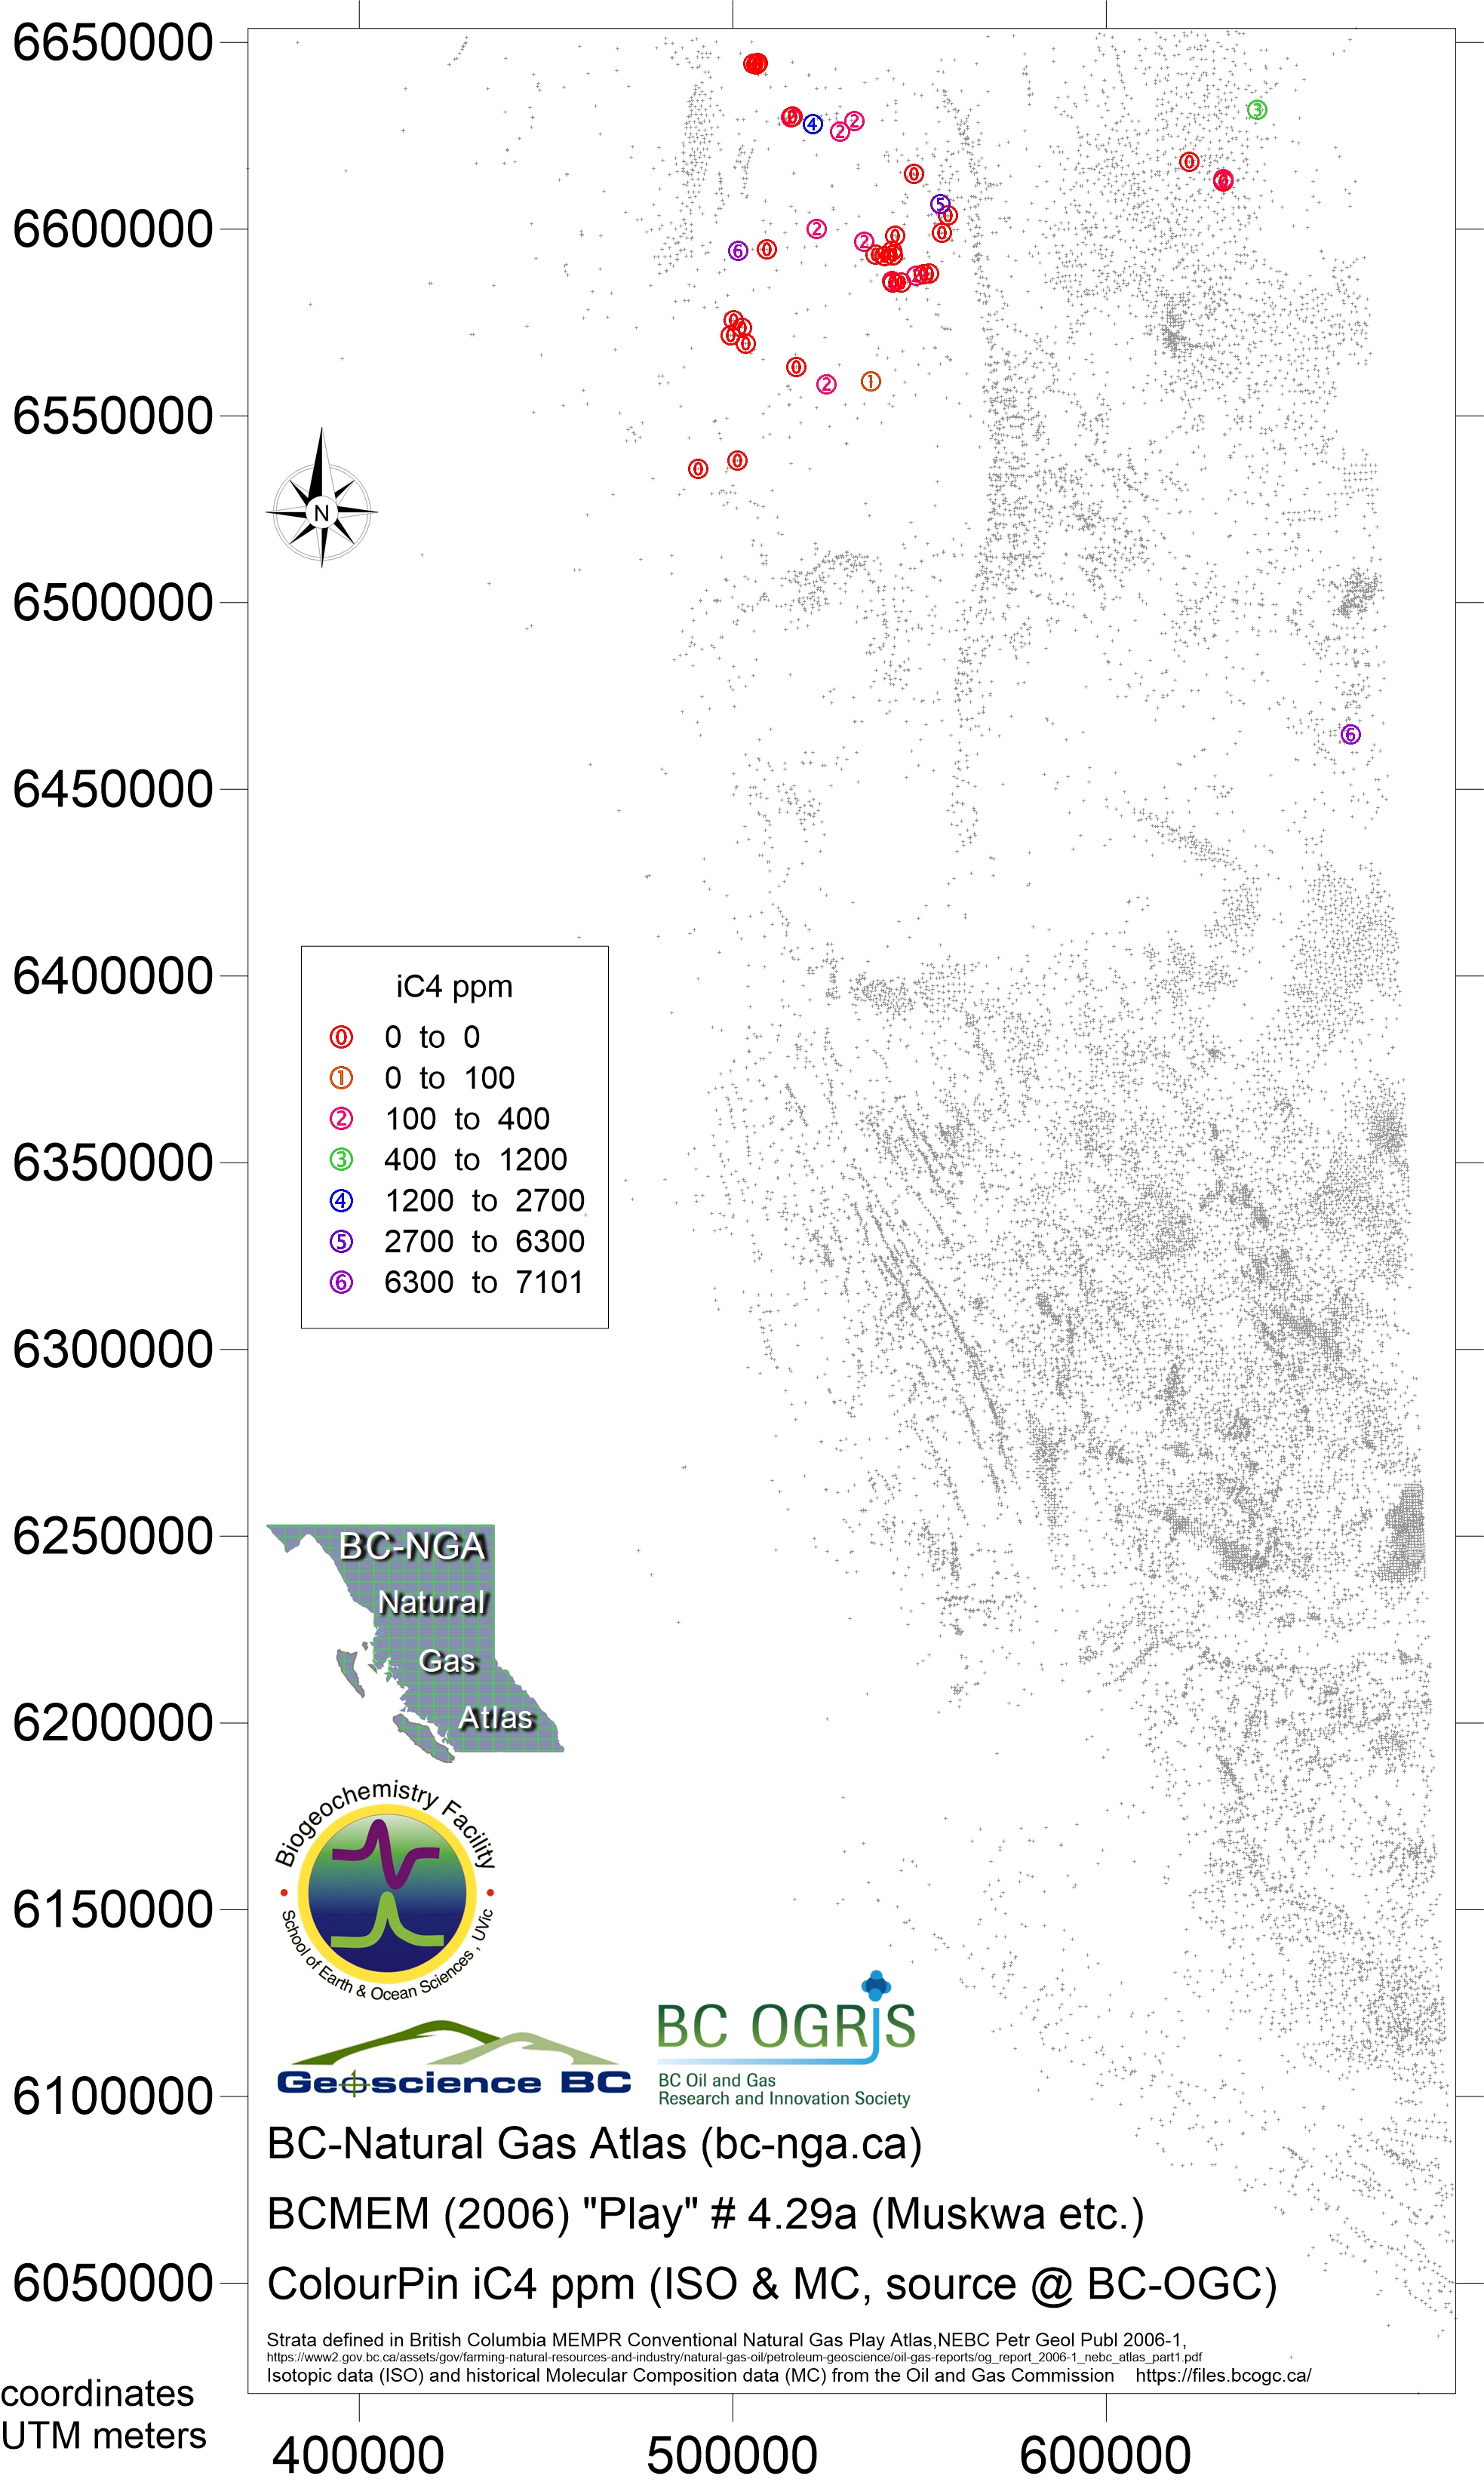
- Map323 Nov 2018 play 4.29a Muskwa eqv iC4H10 ppm
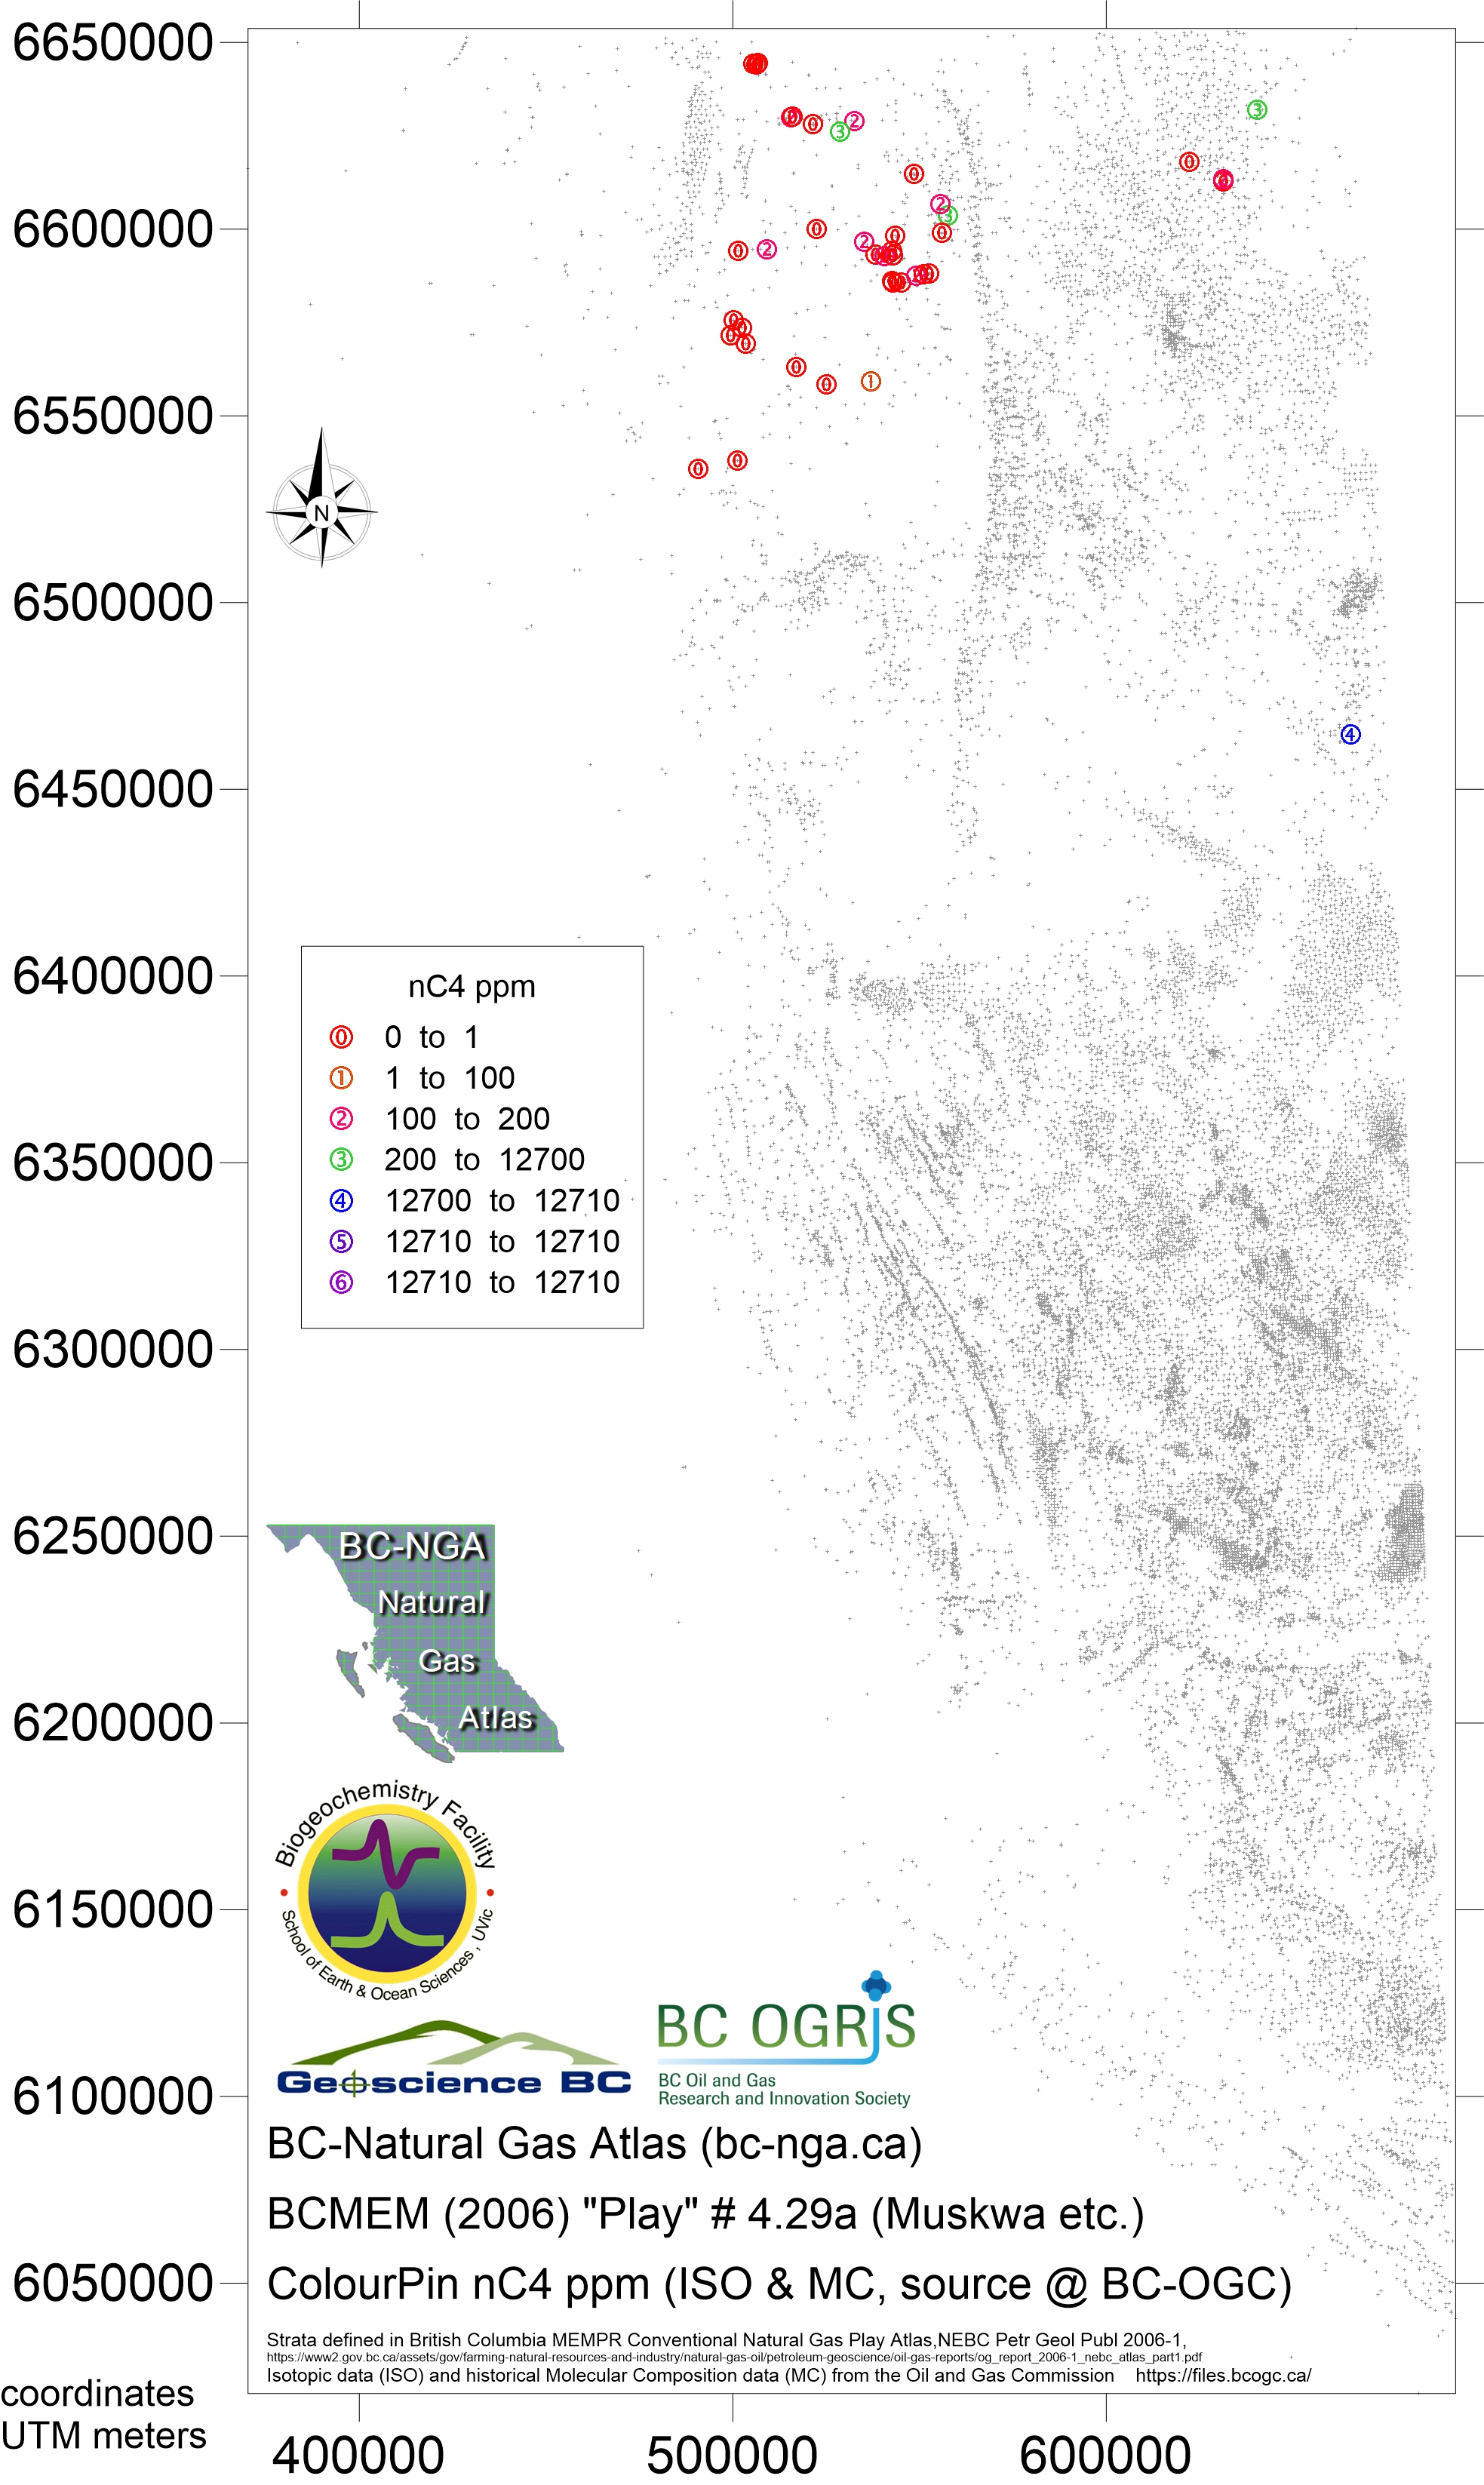
- Map324 Nov 2018 play 4.29a Muskwa eqv nC4H10 ppm
- Map325 Nov 2018 play 4.29a Muskwa eqv CO2 ppm
- Map326 Nov 2018 play 4.29a Muskwa eqv δ13CH4
- Map327 Nov 2018 play 4.29a Muskwa eqv δ13C2H6
- Map328 Nov 2018 play 4.29a Muskwa eqv δ13C3H8
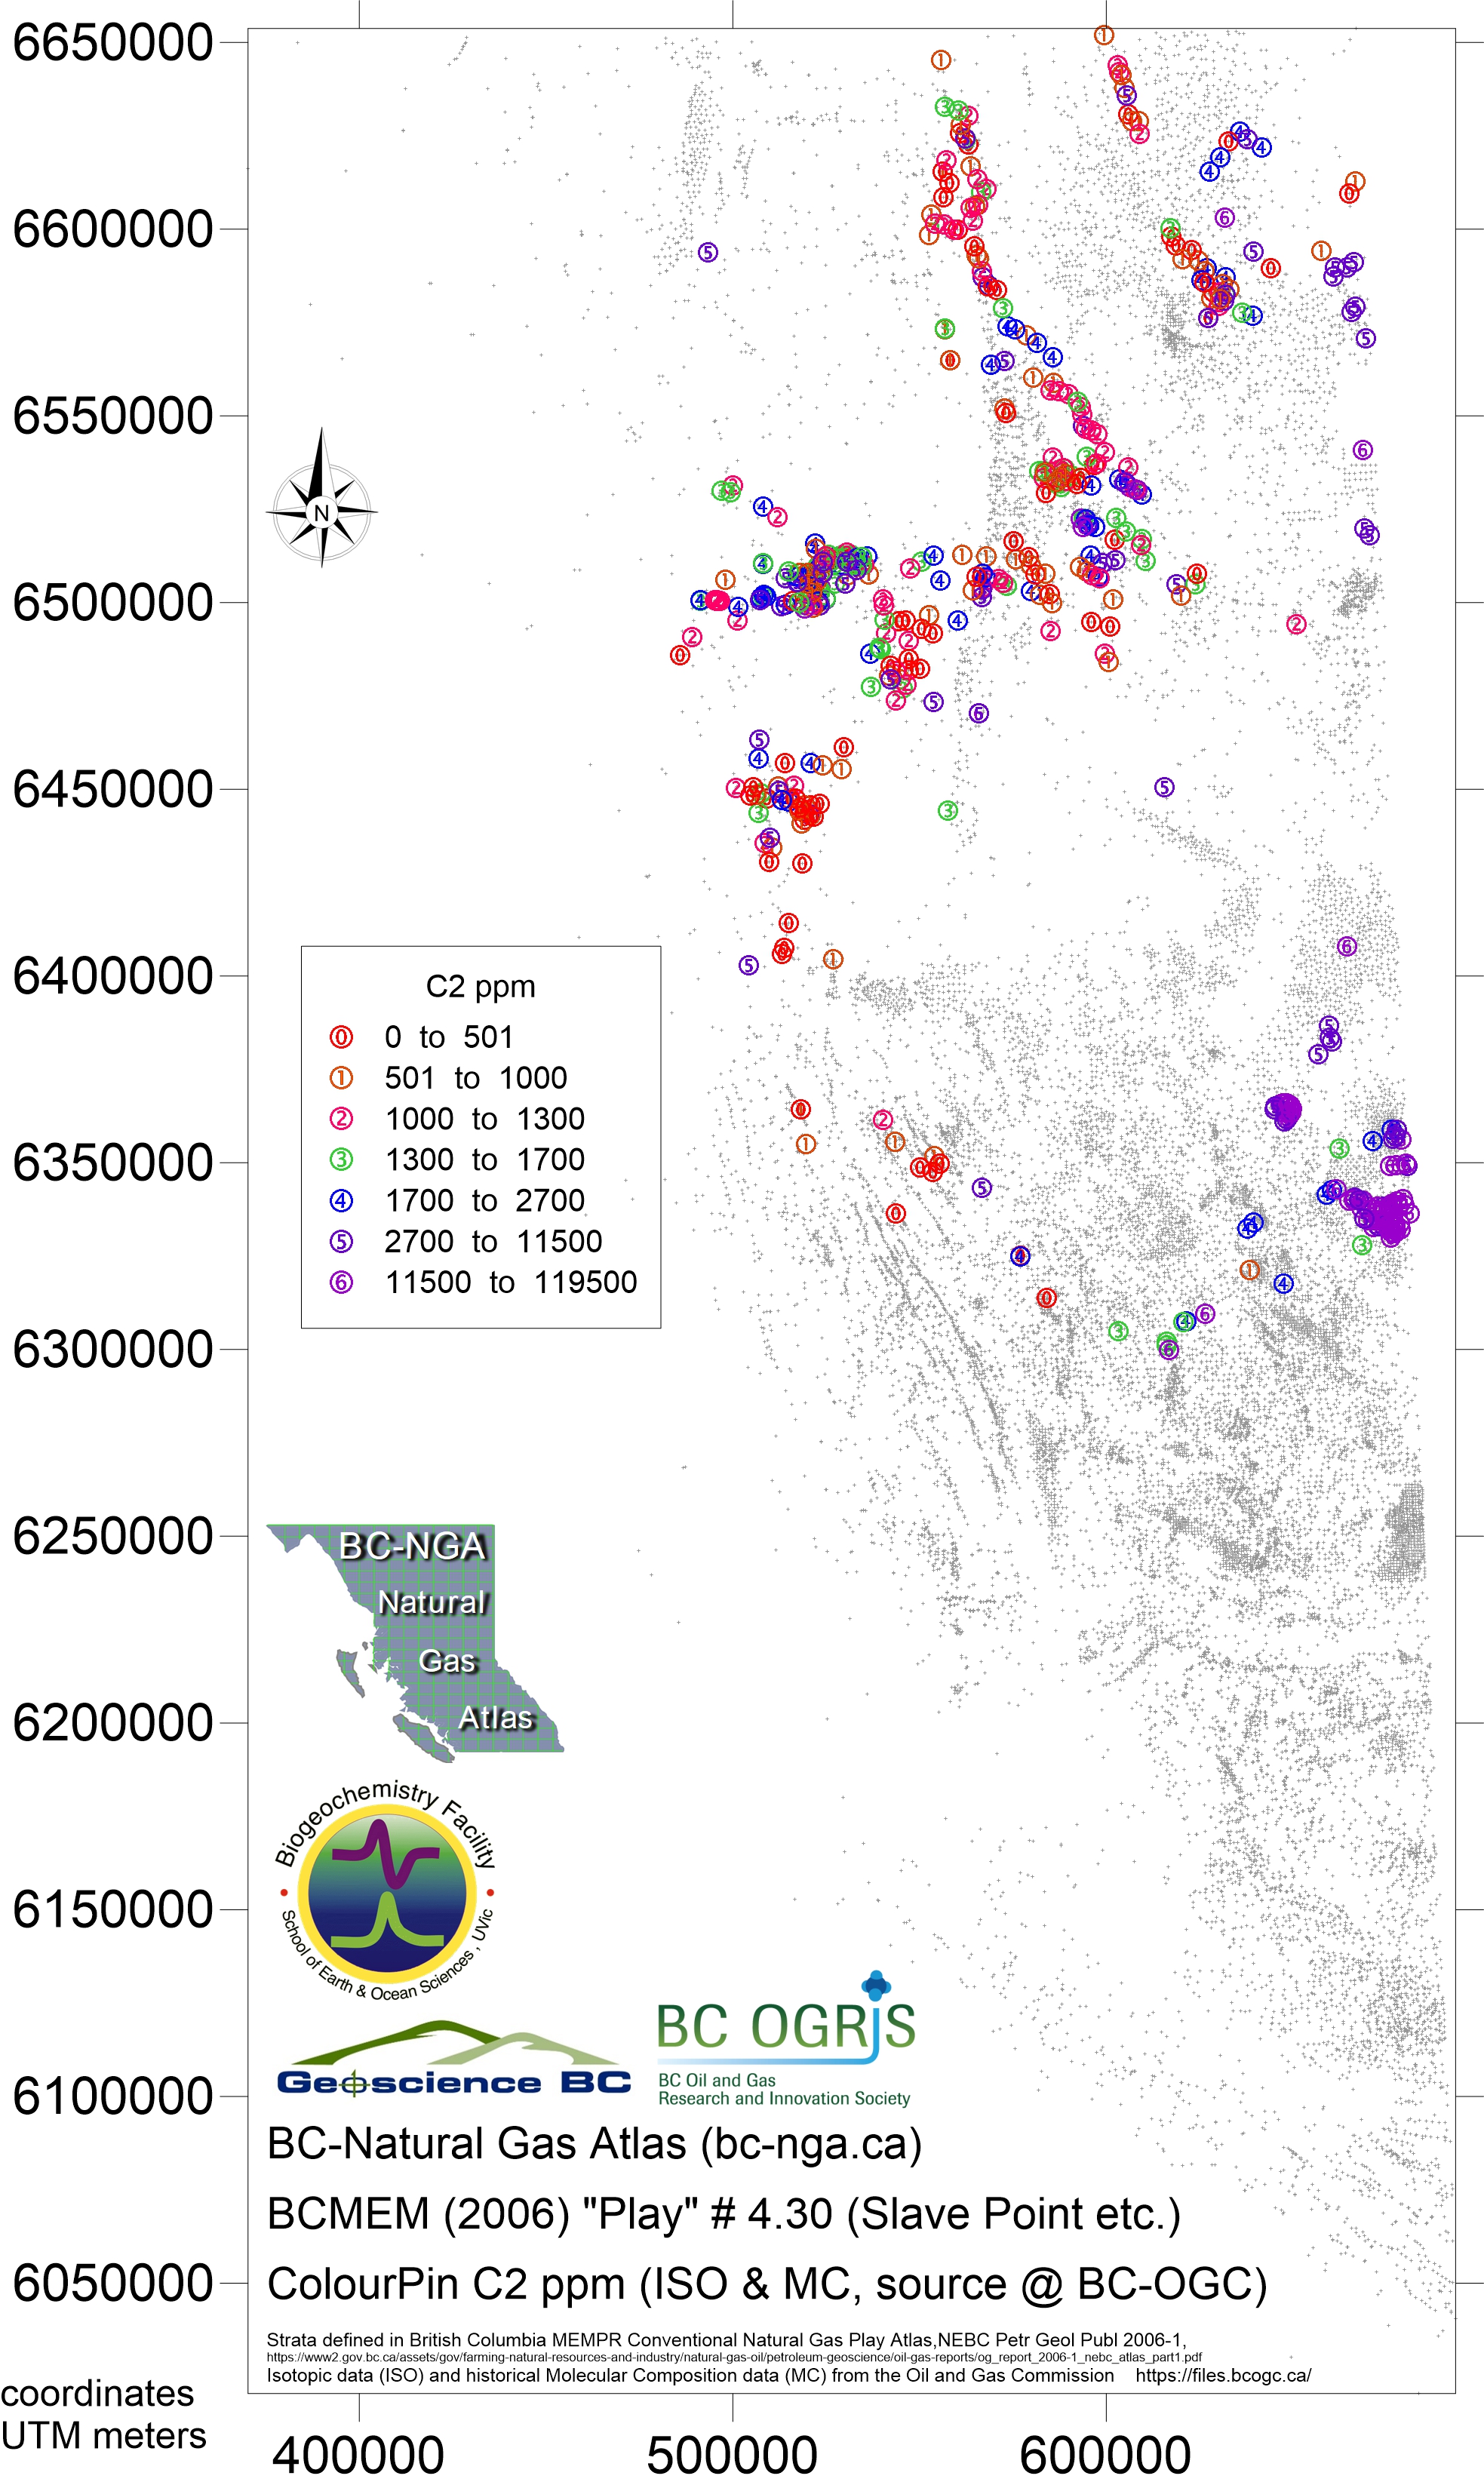
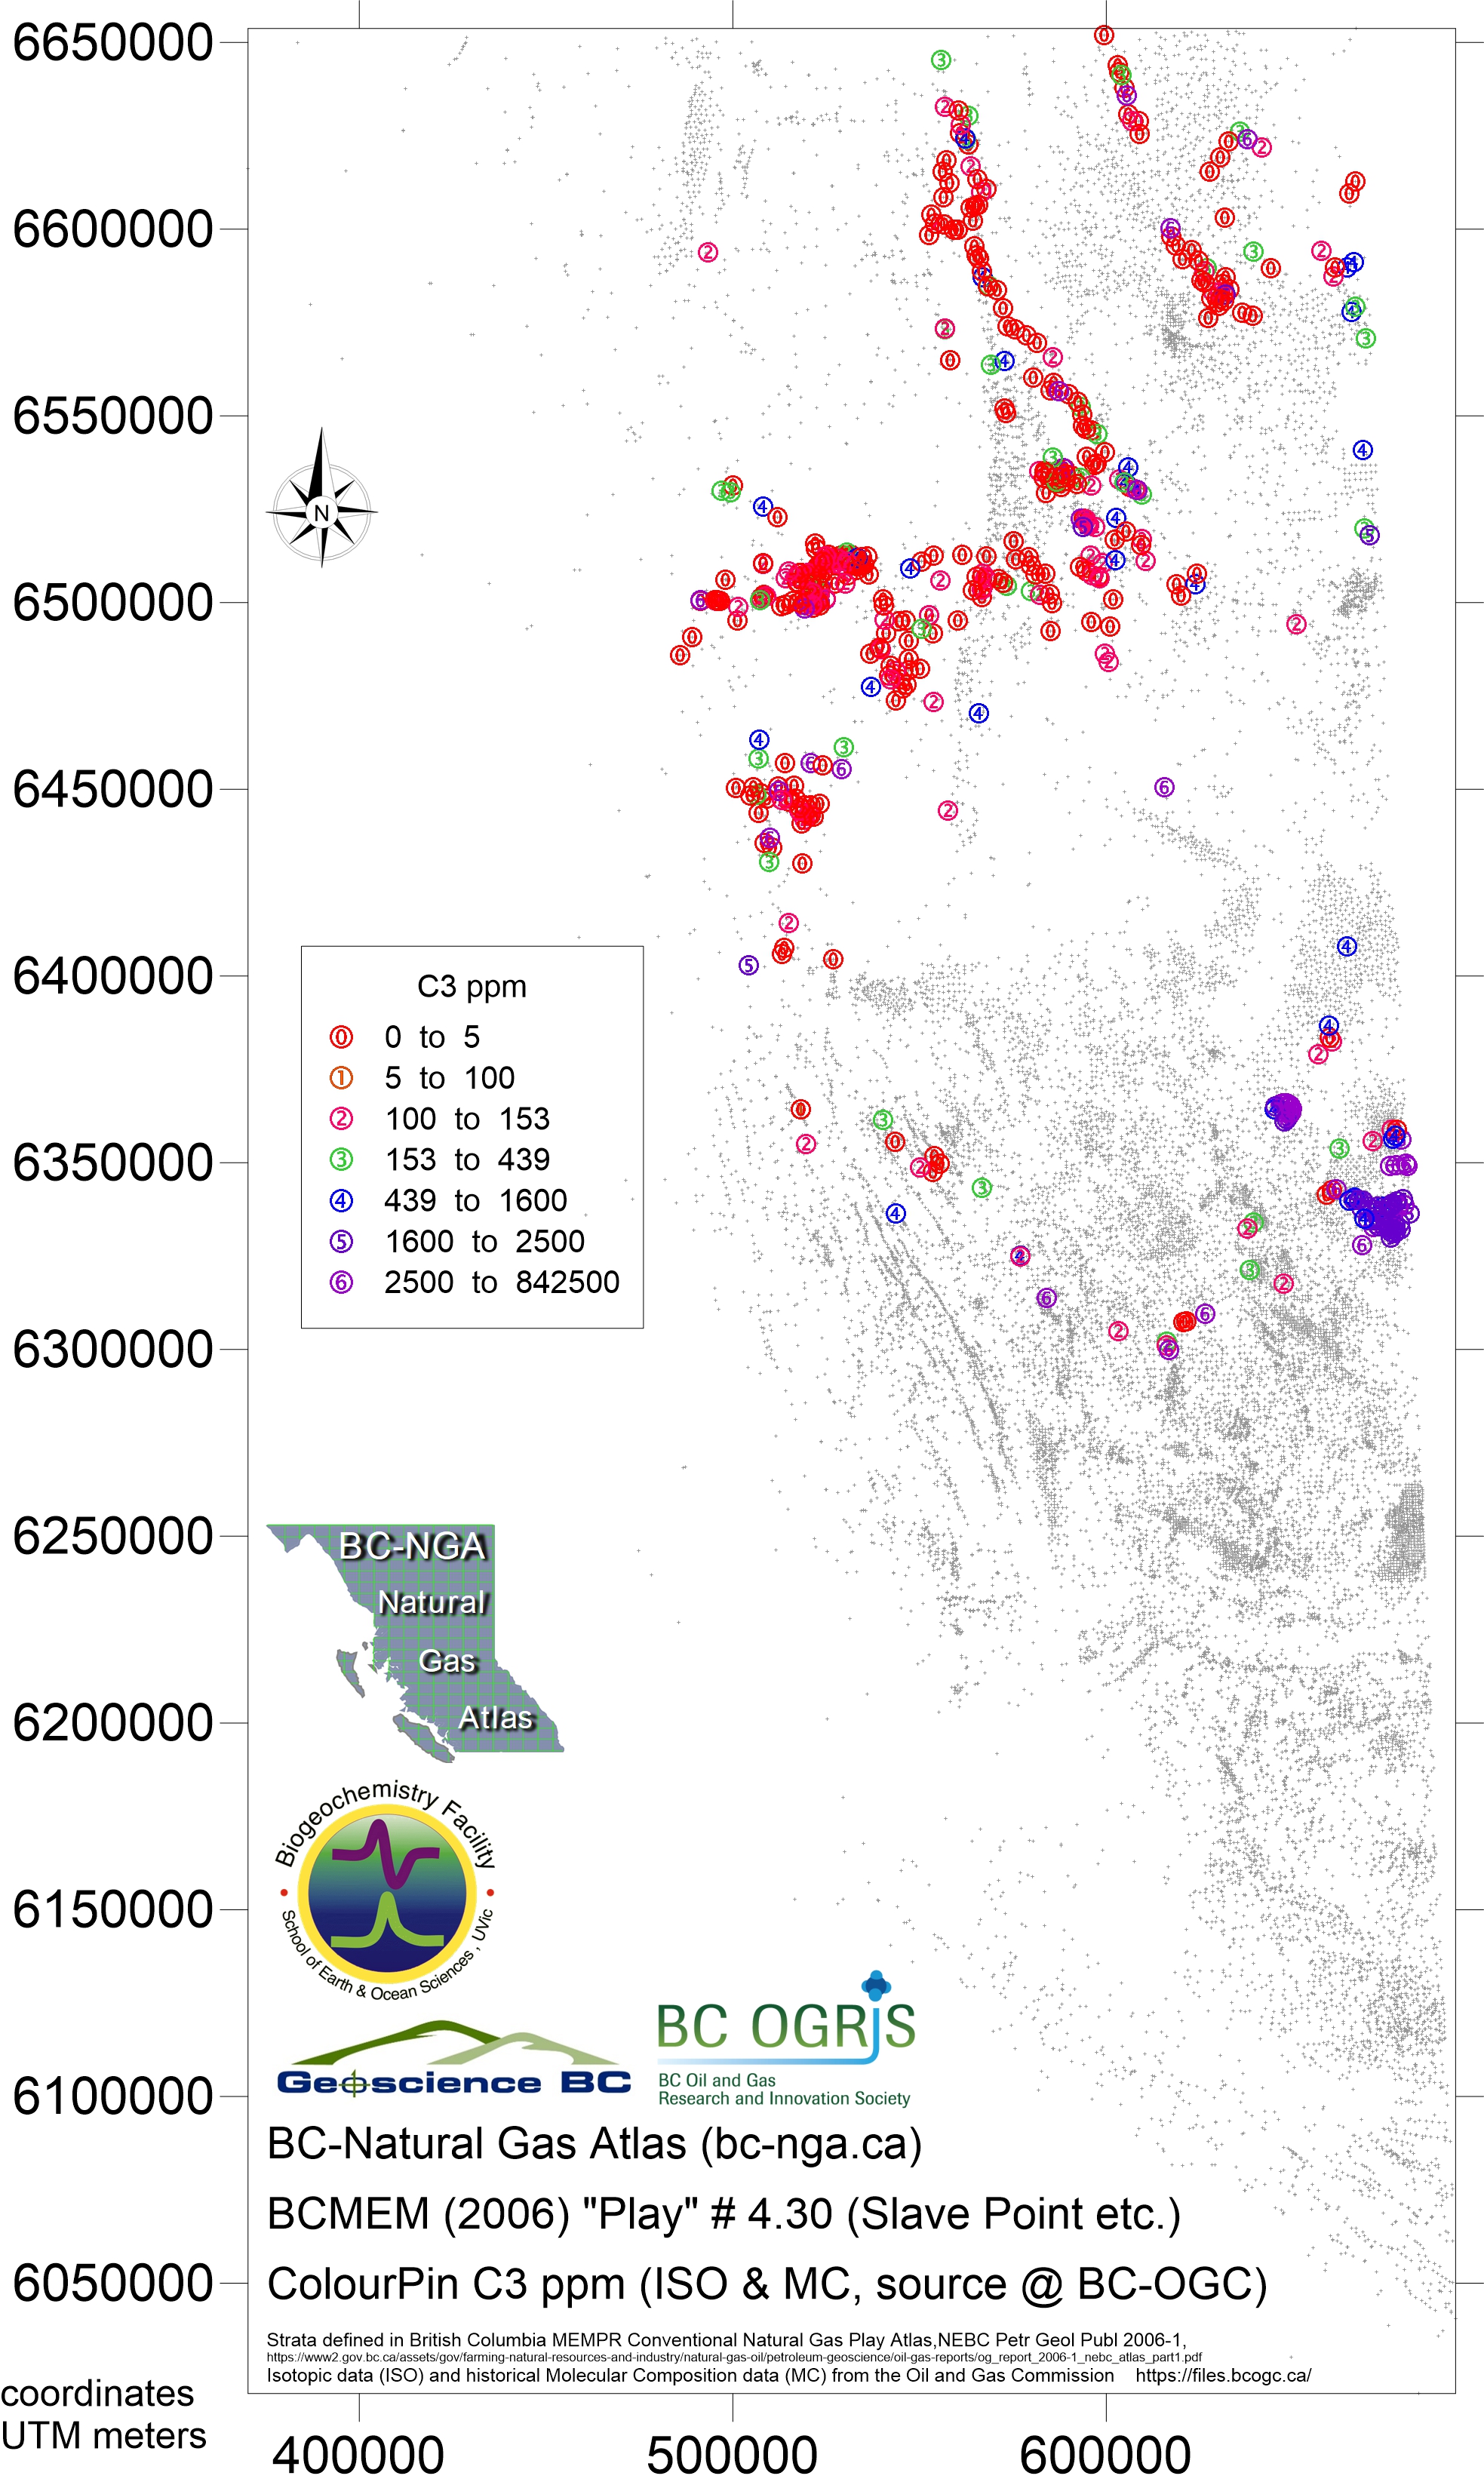
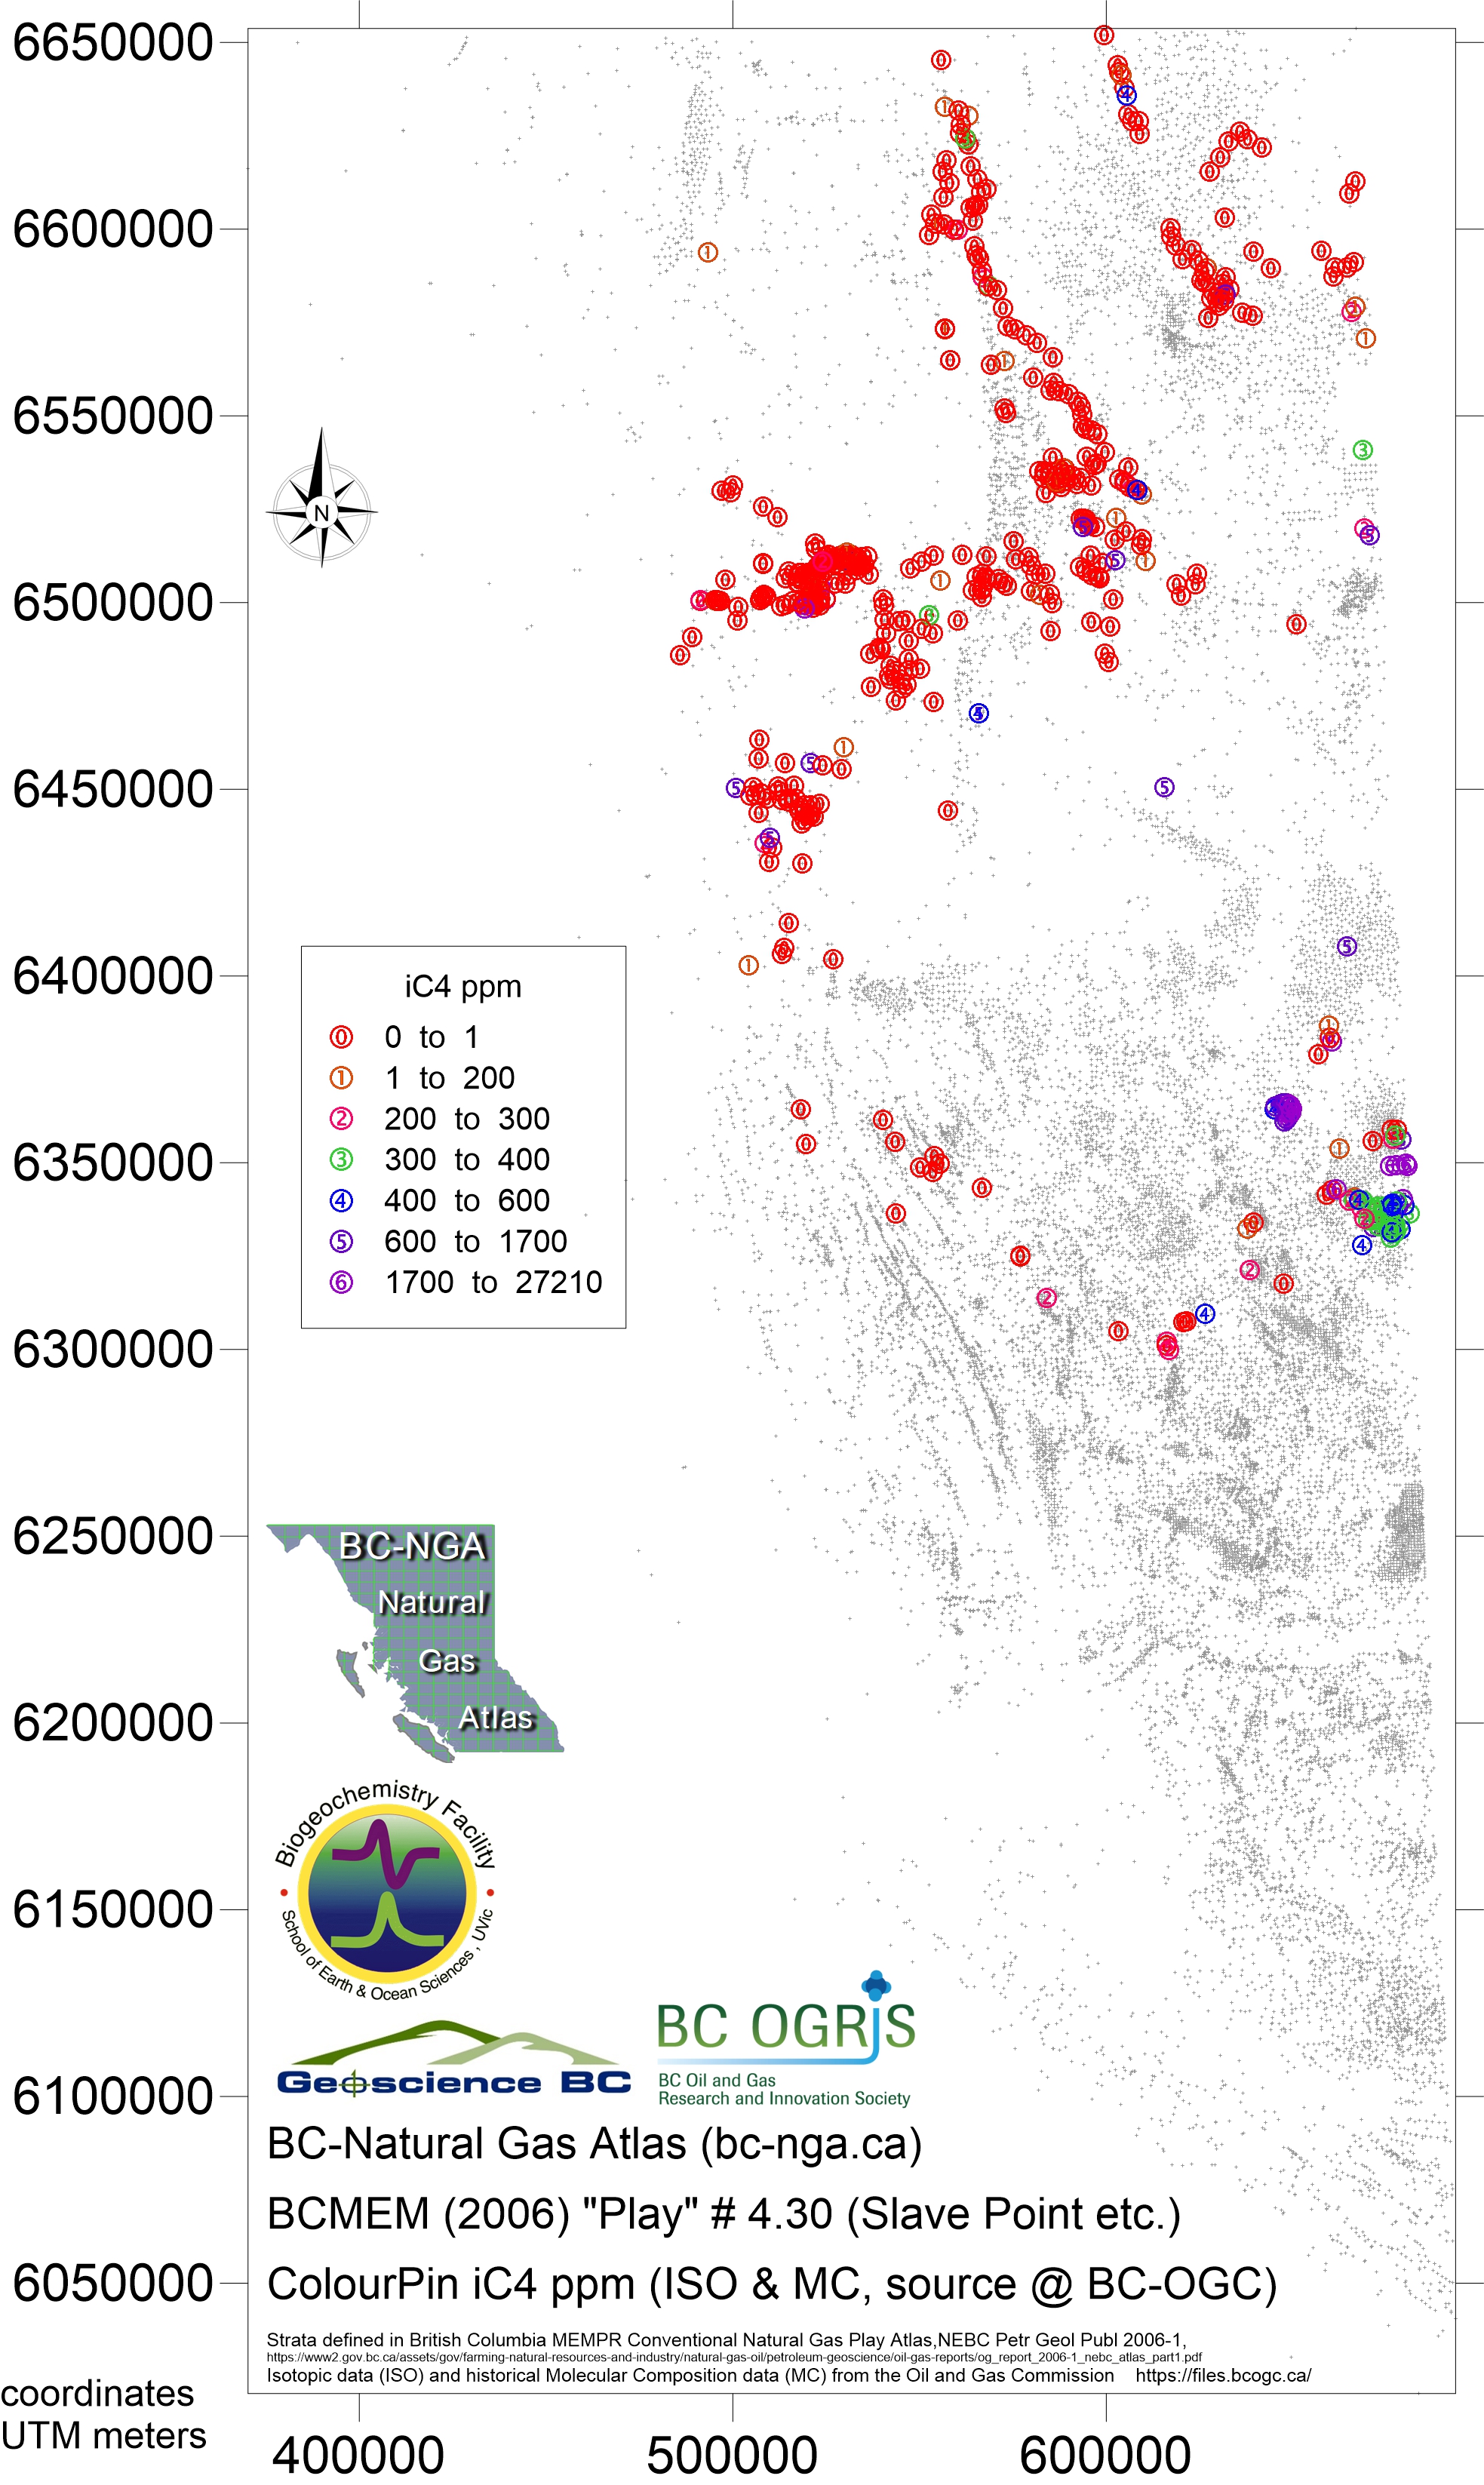
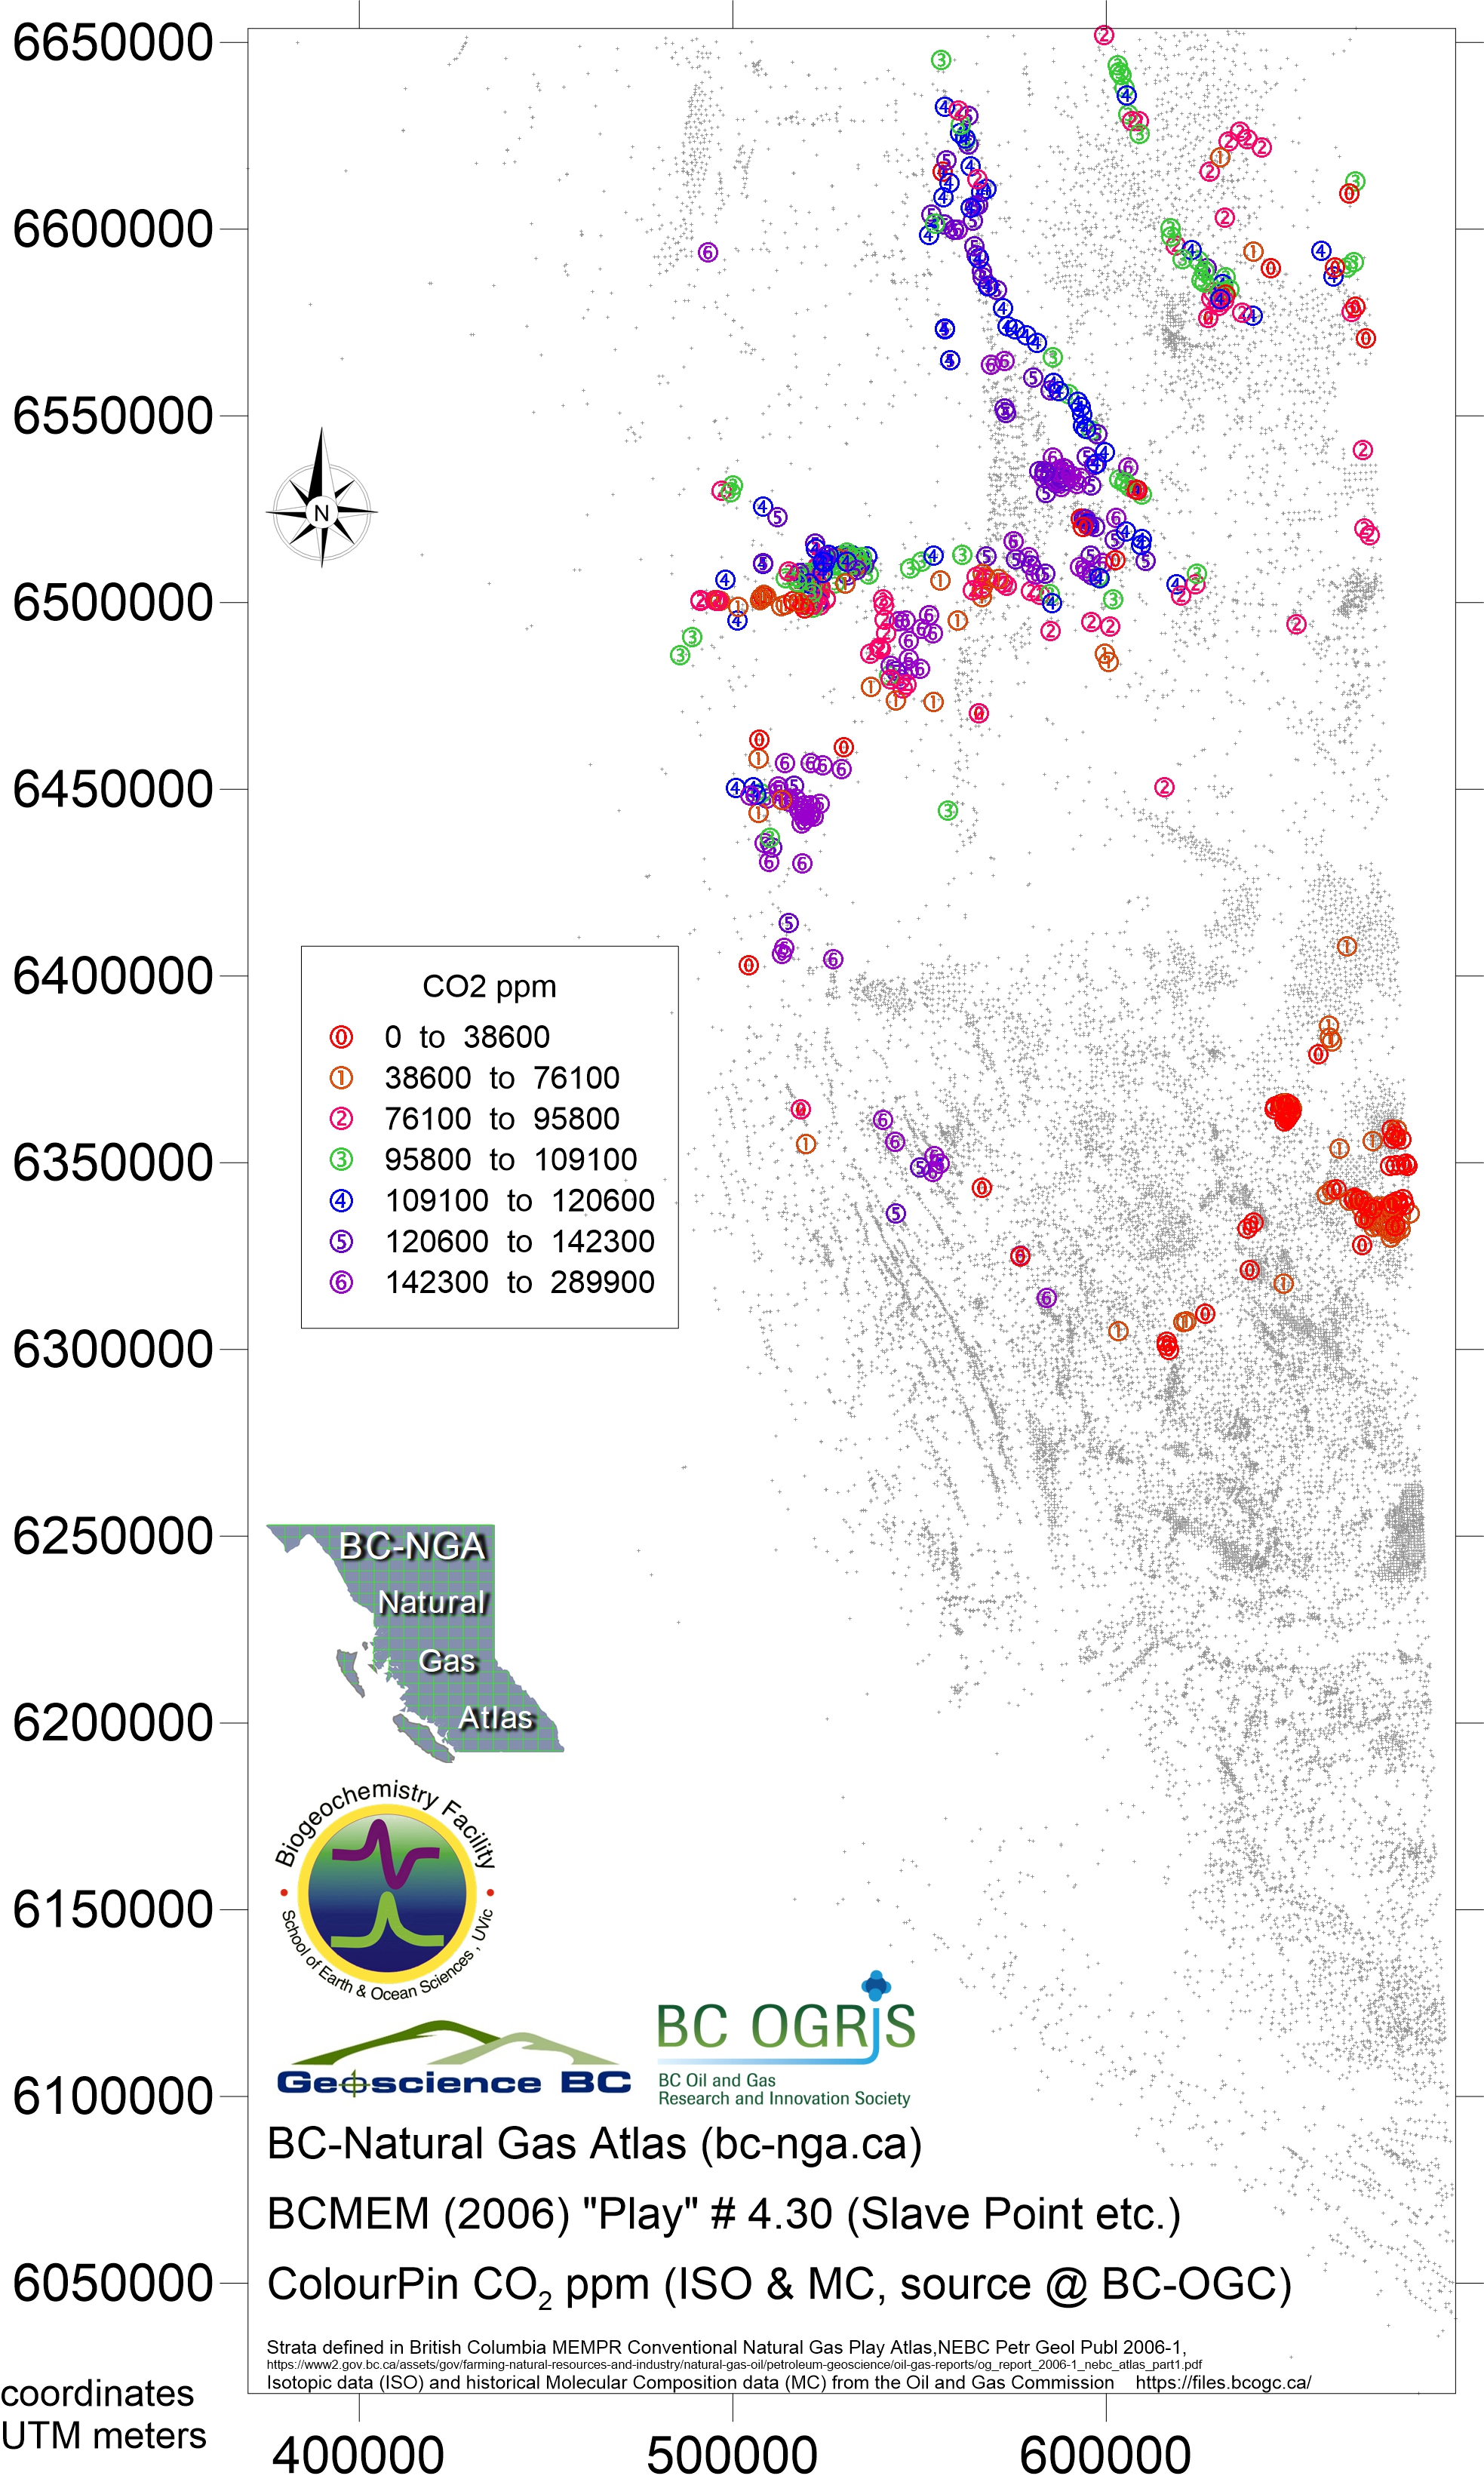
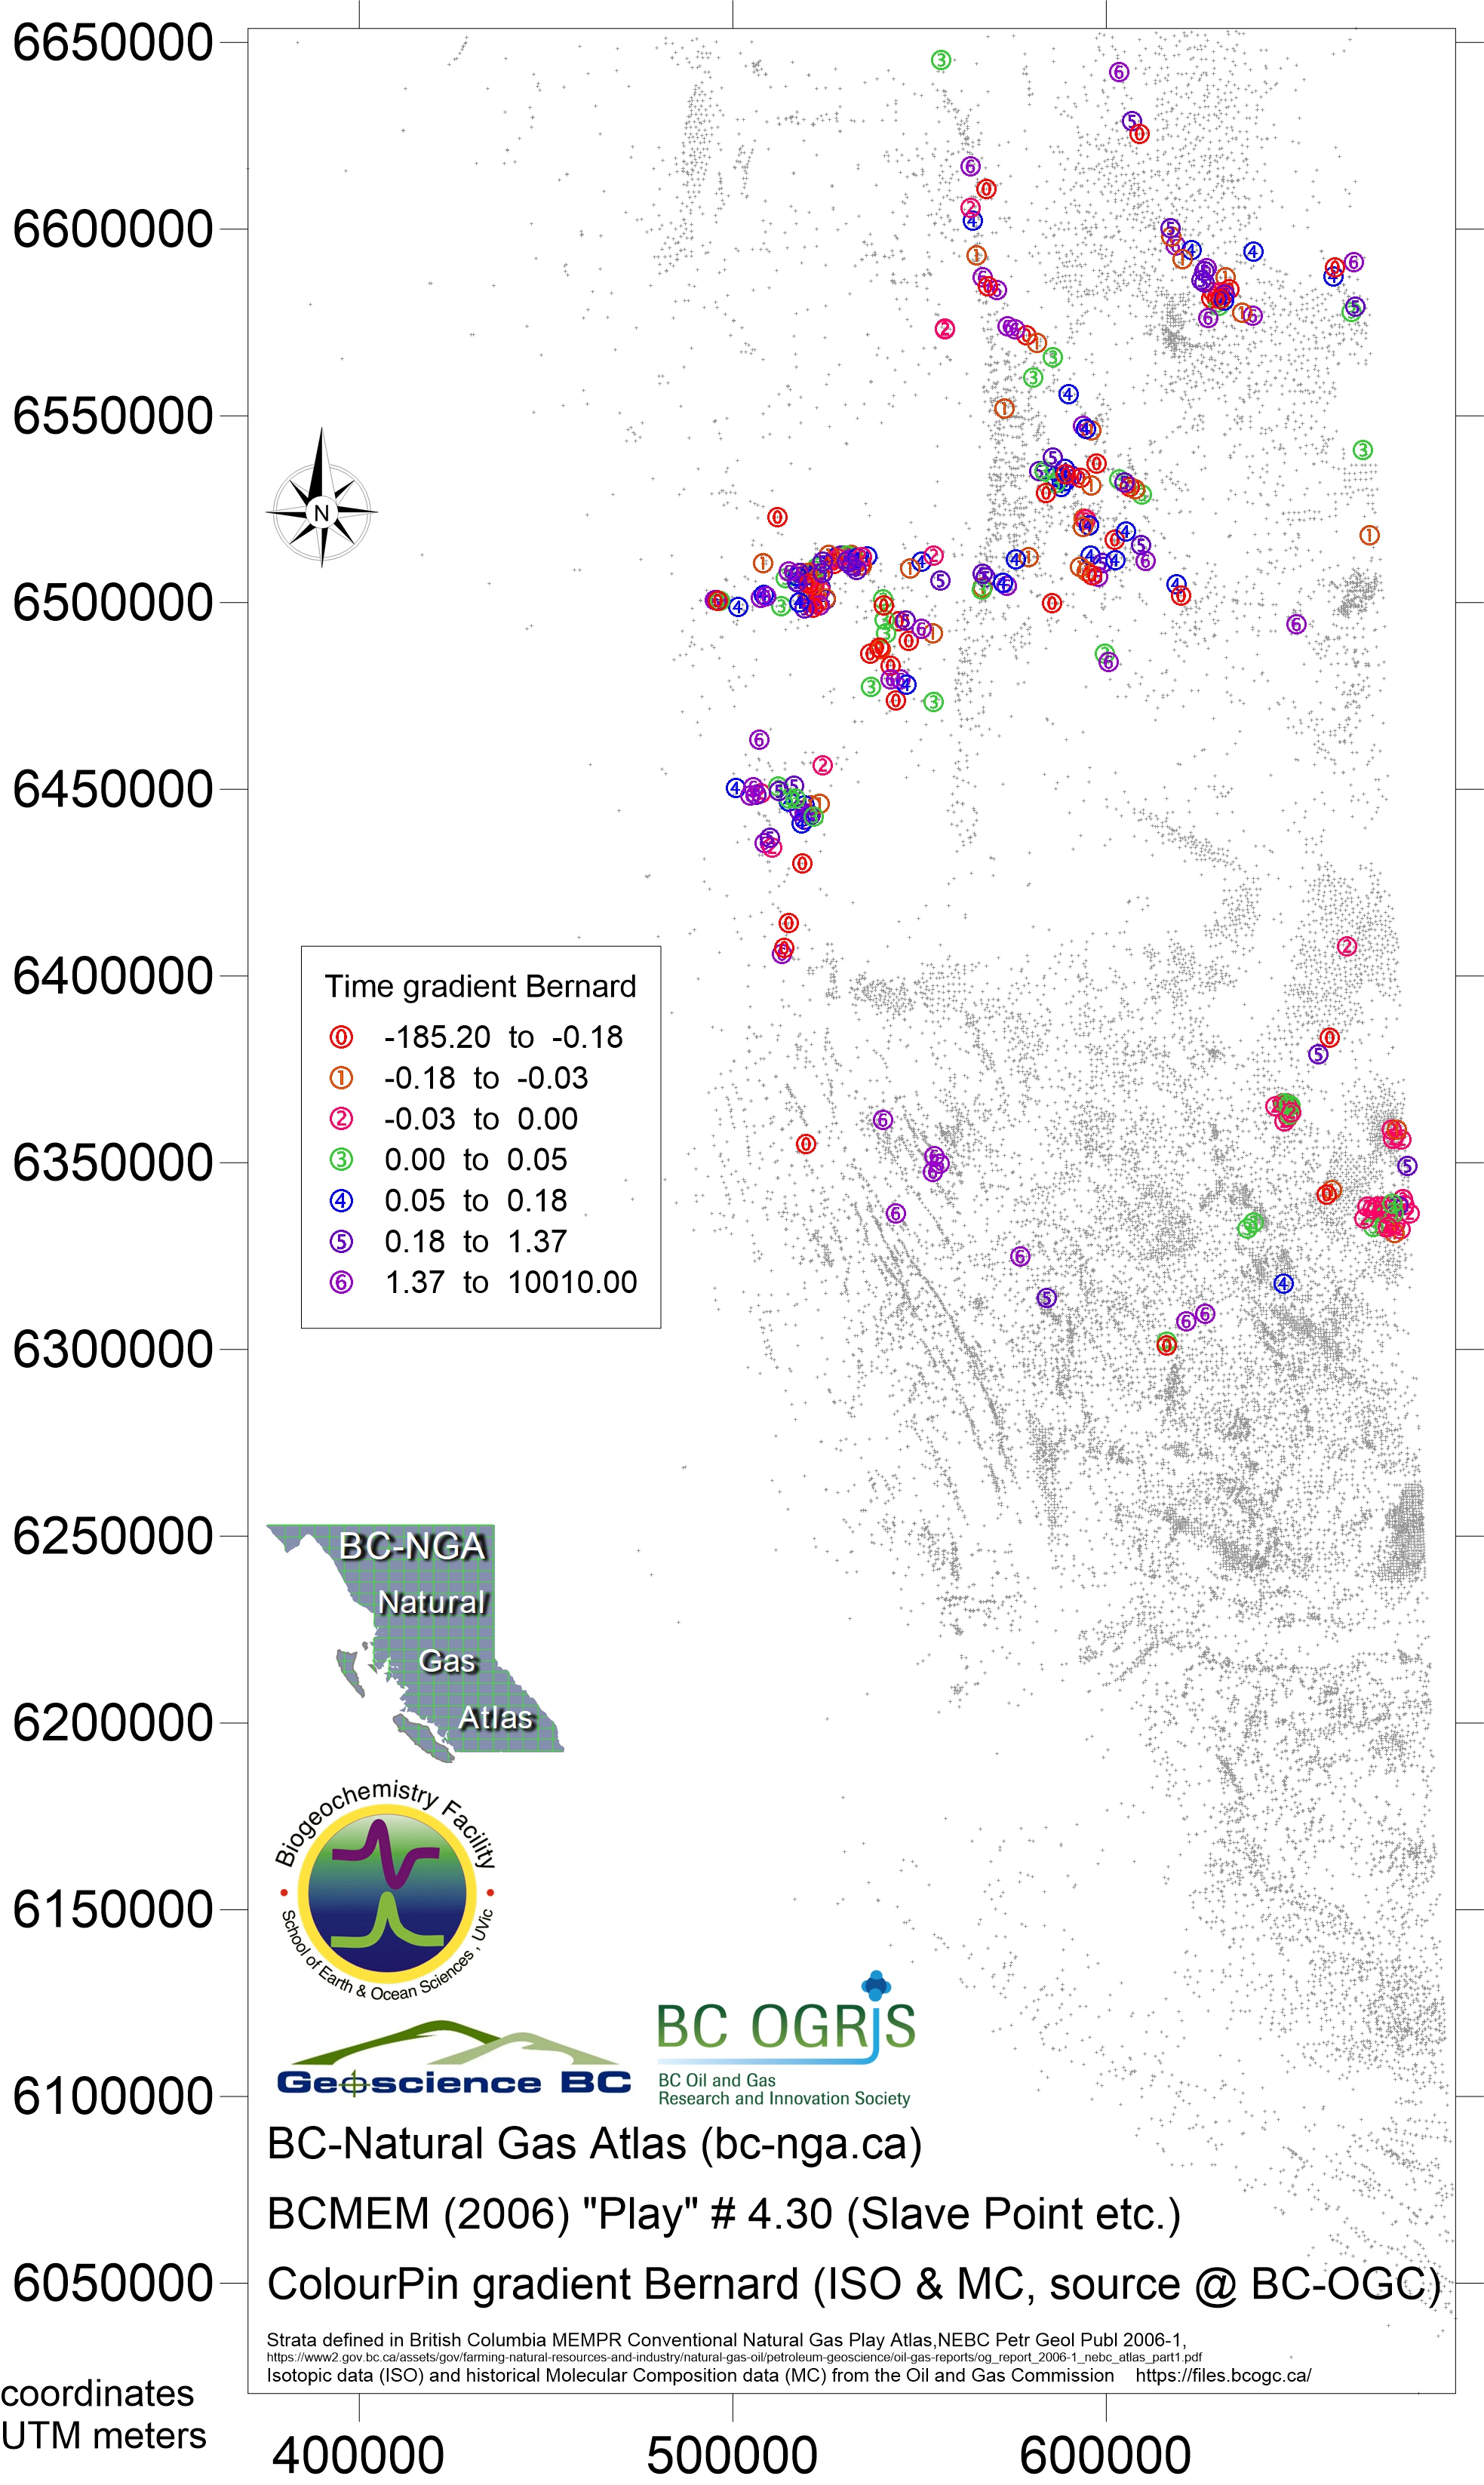
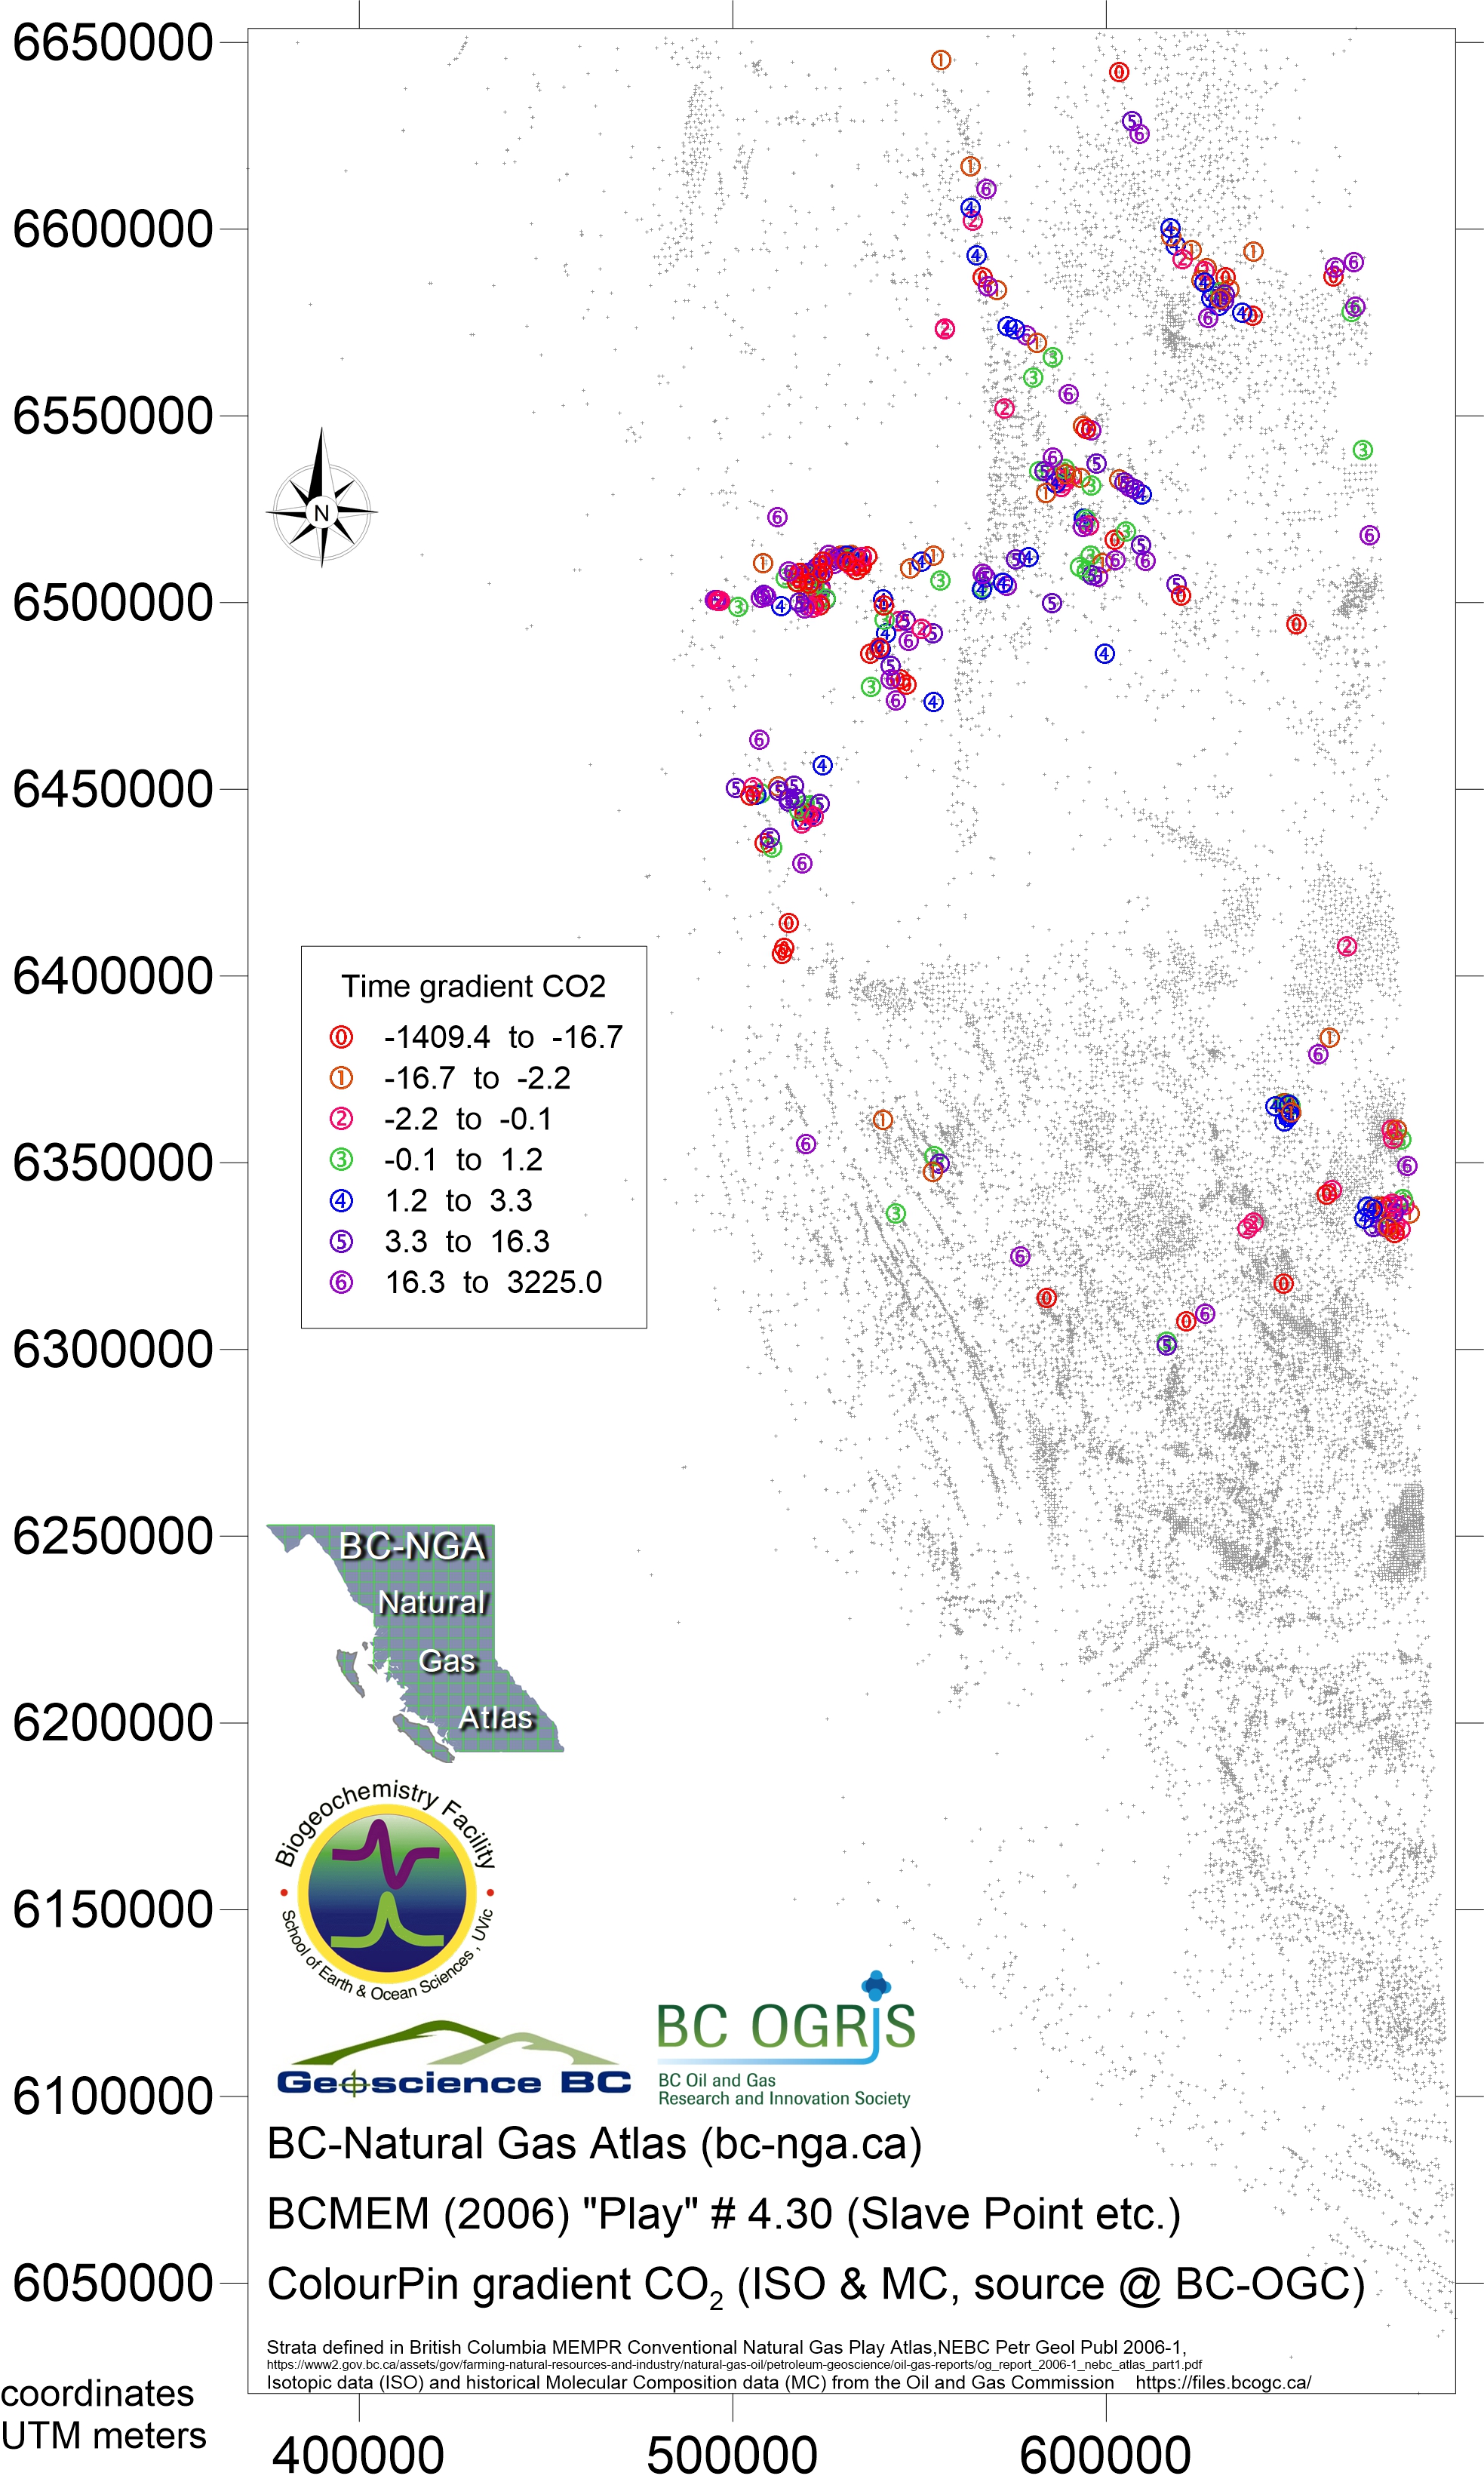
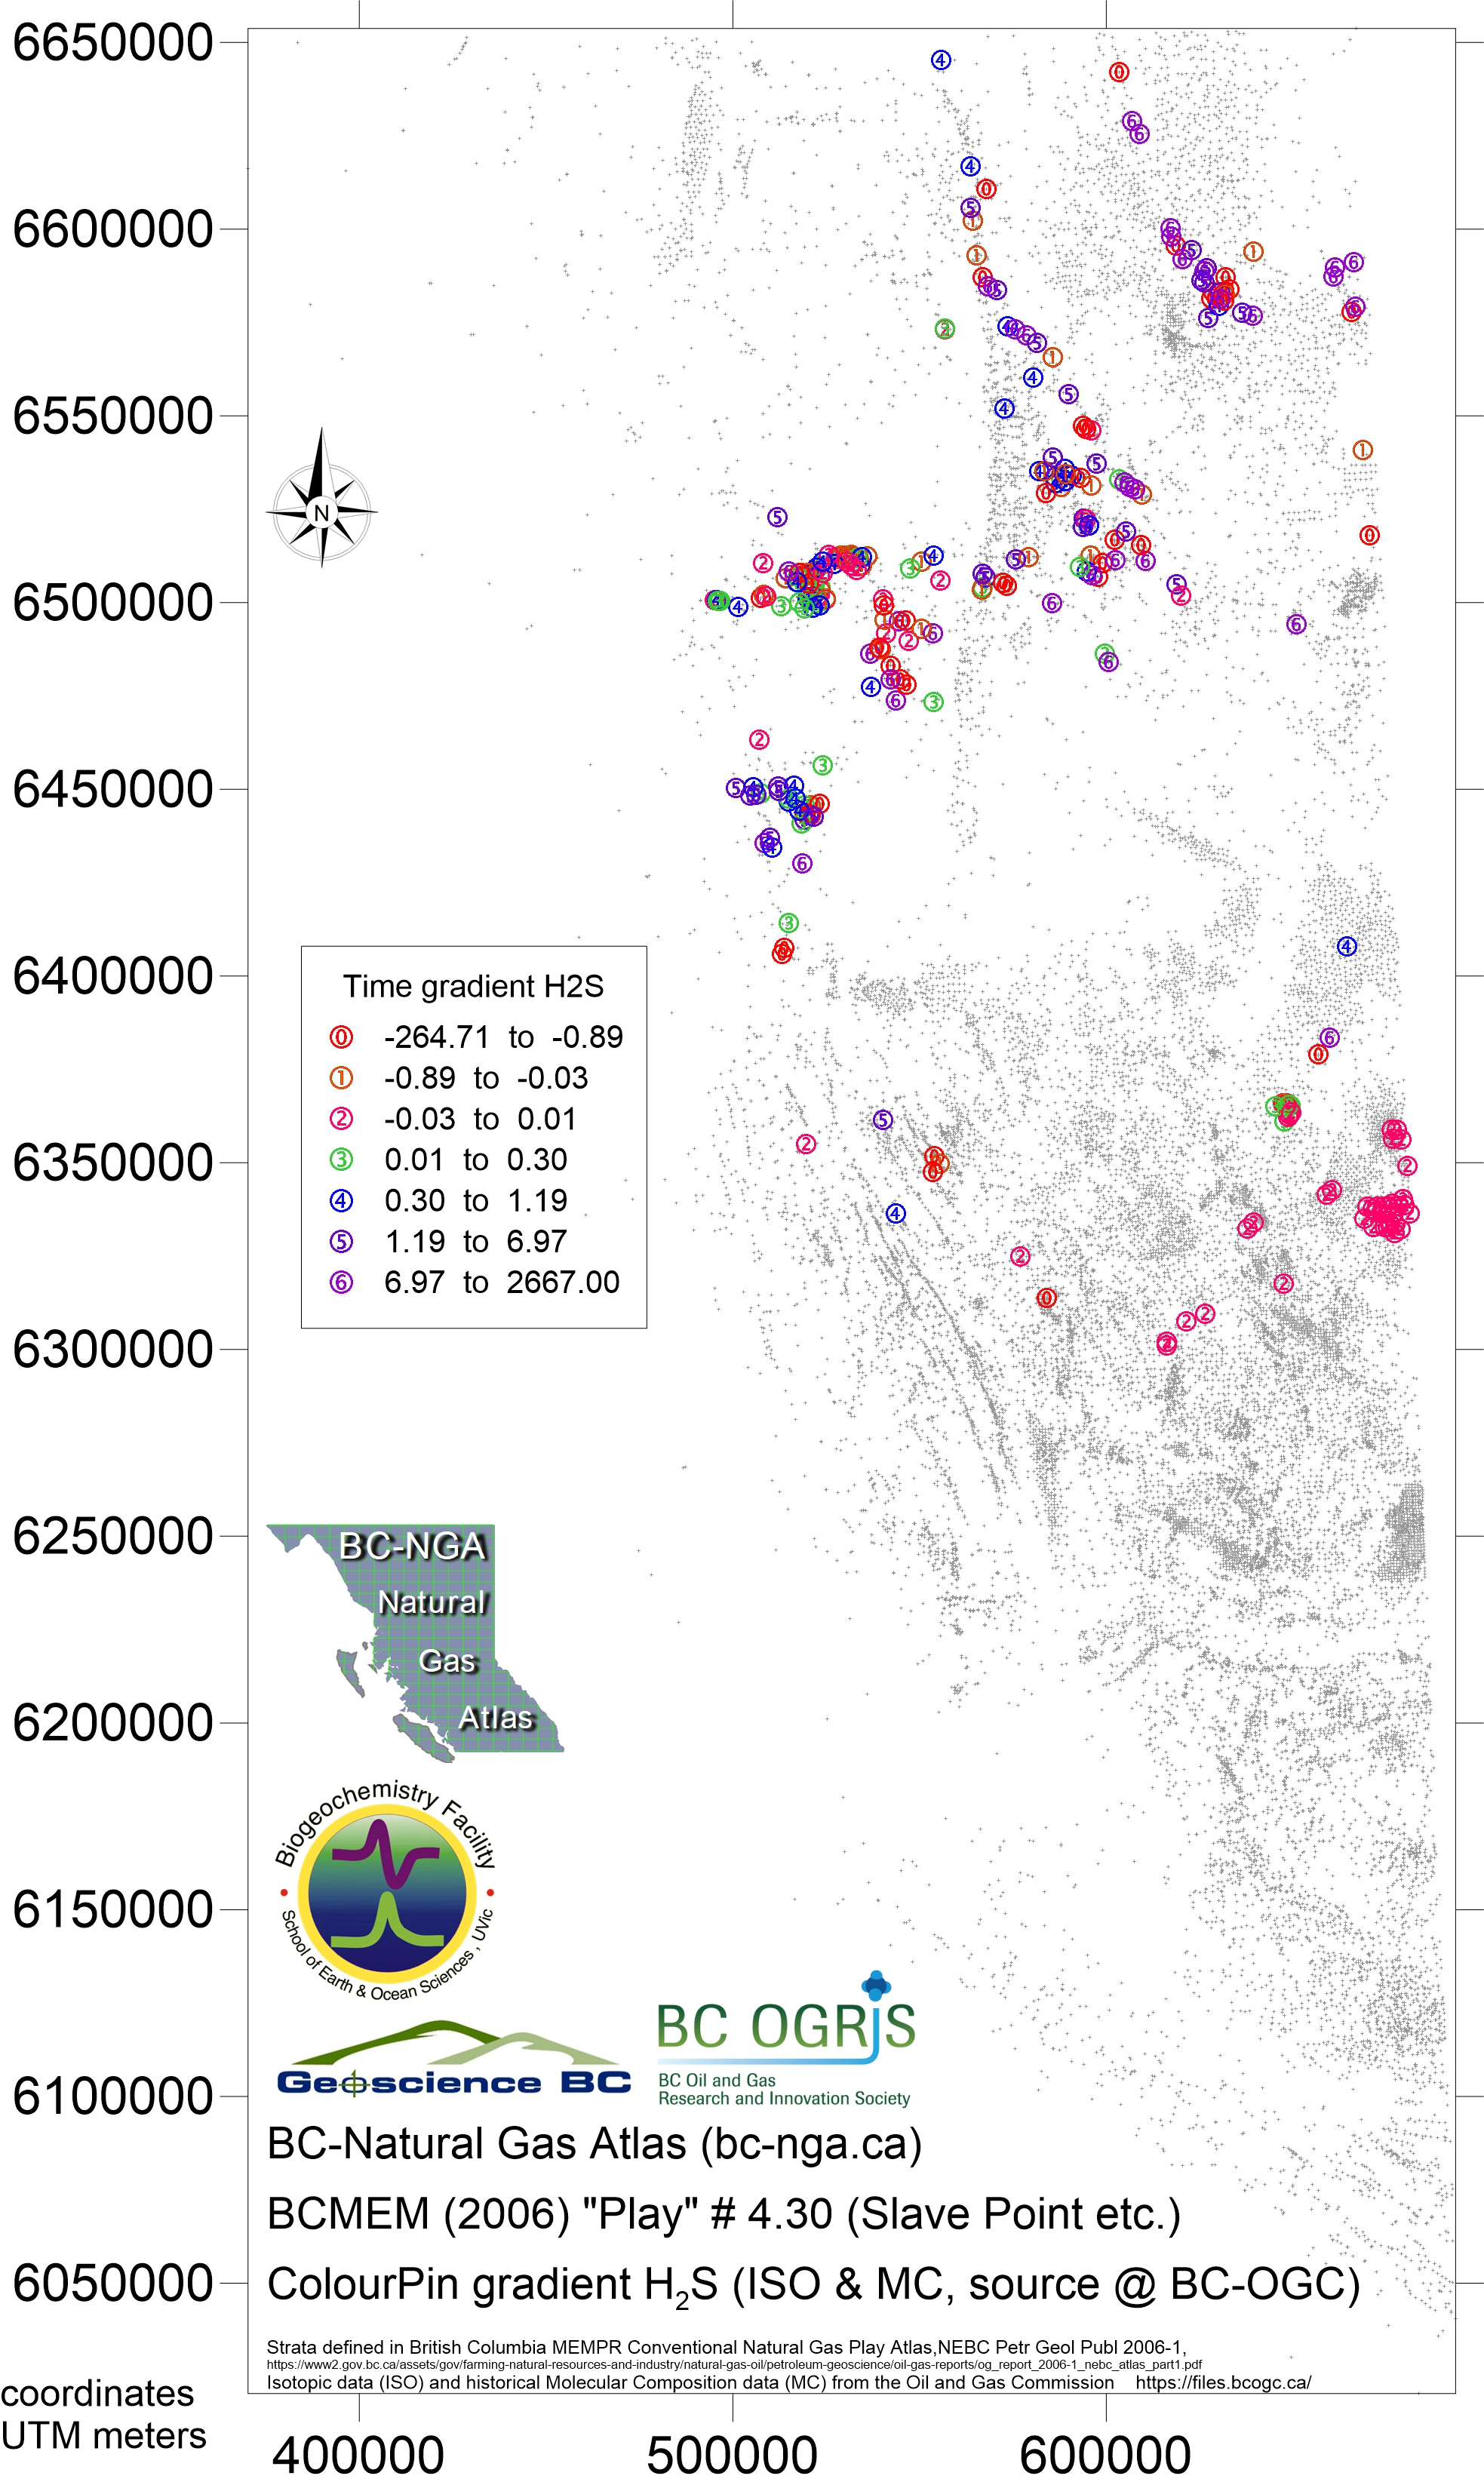
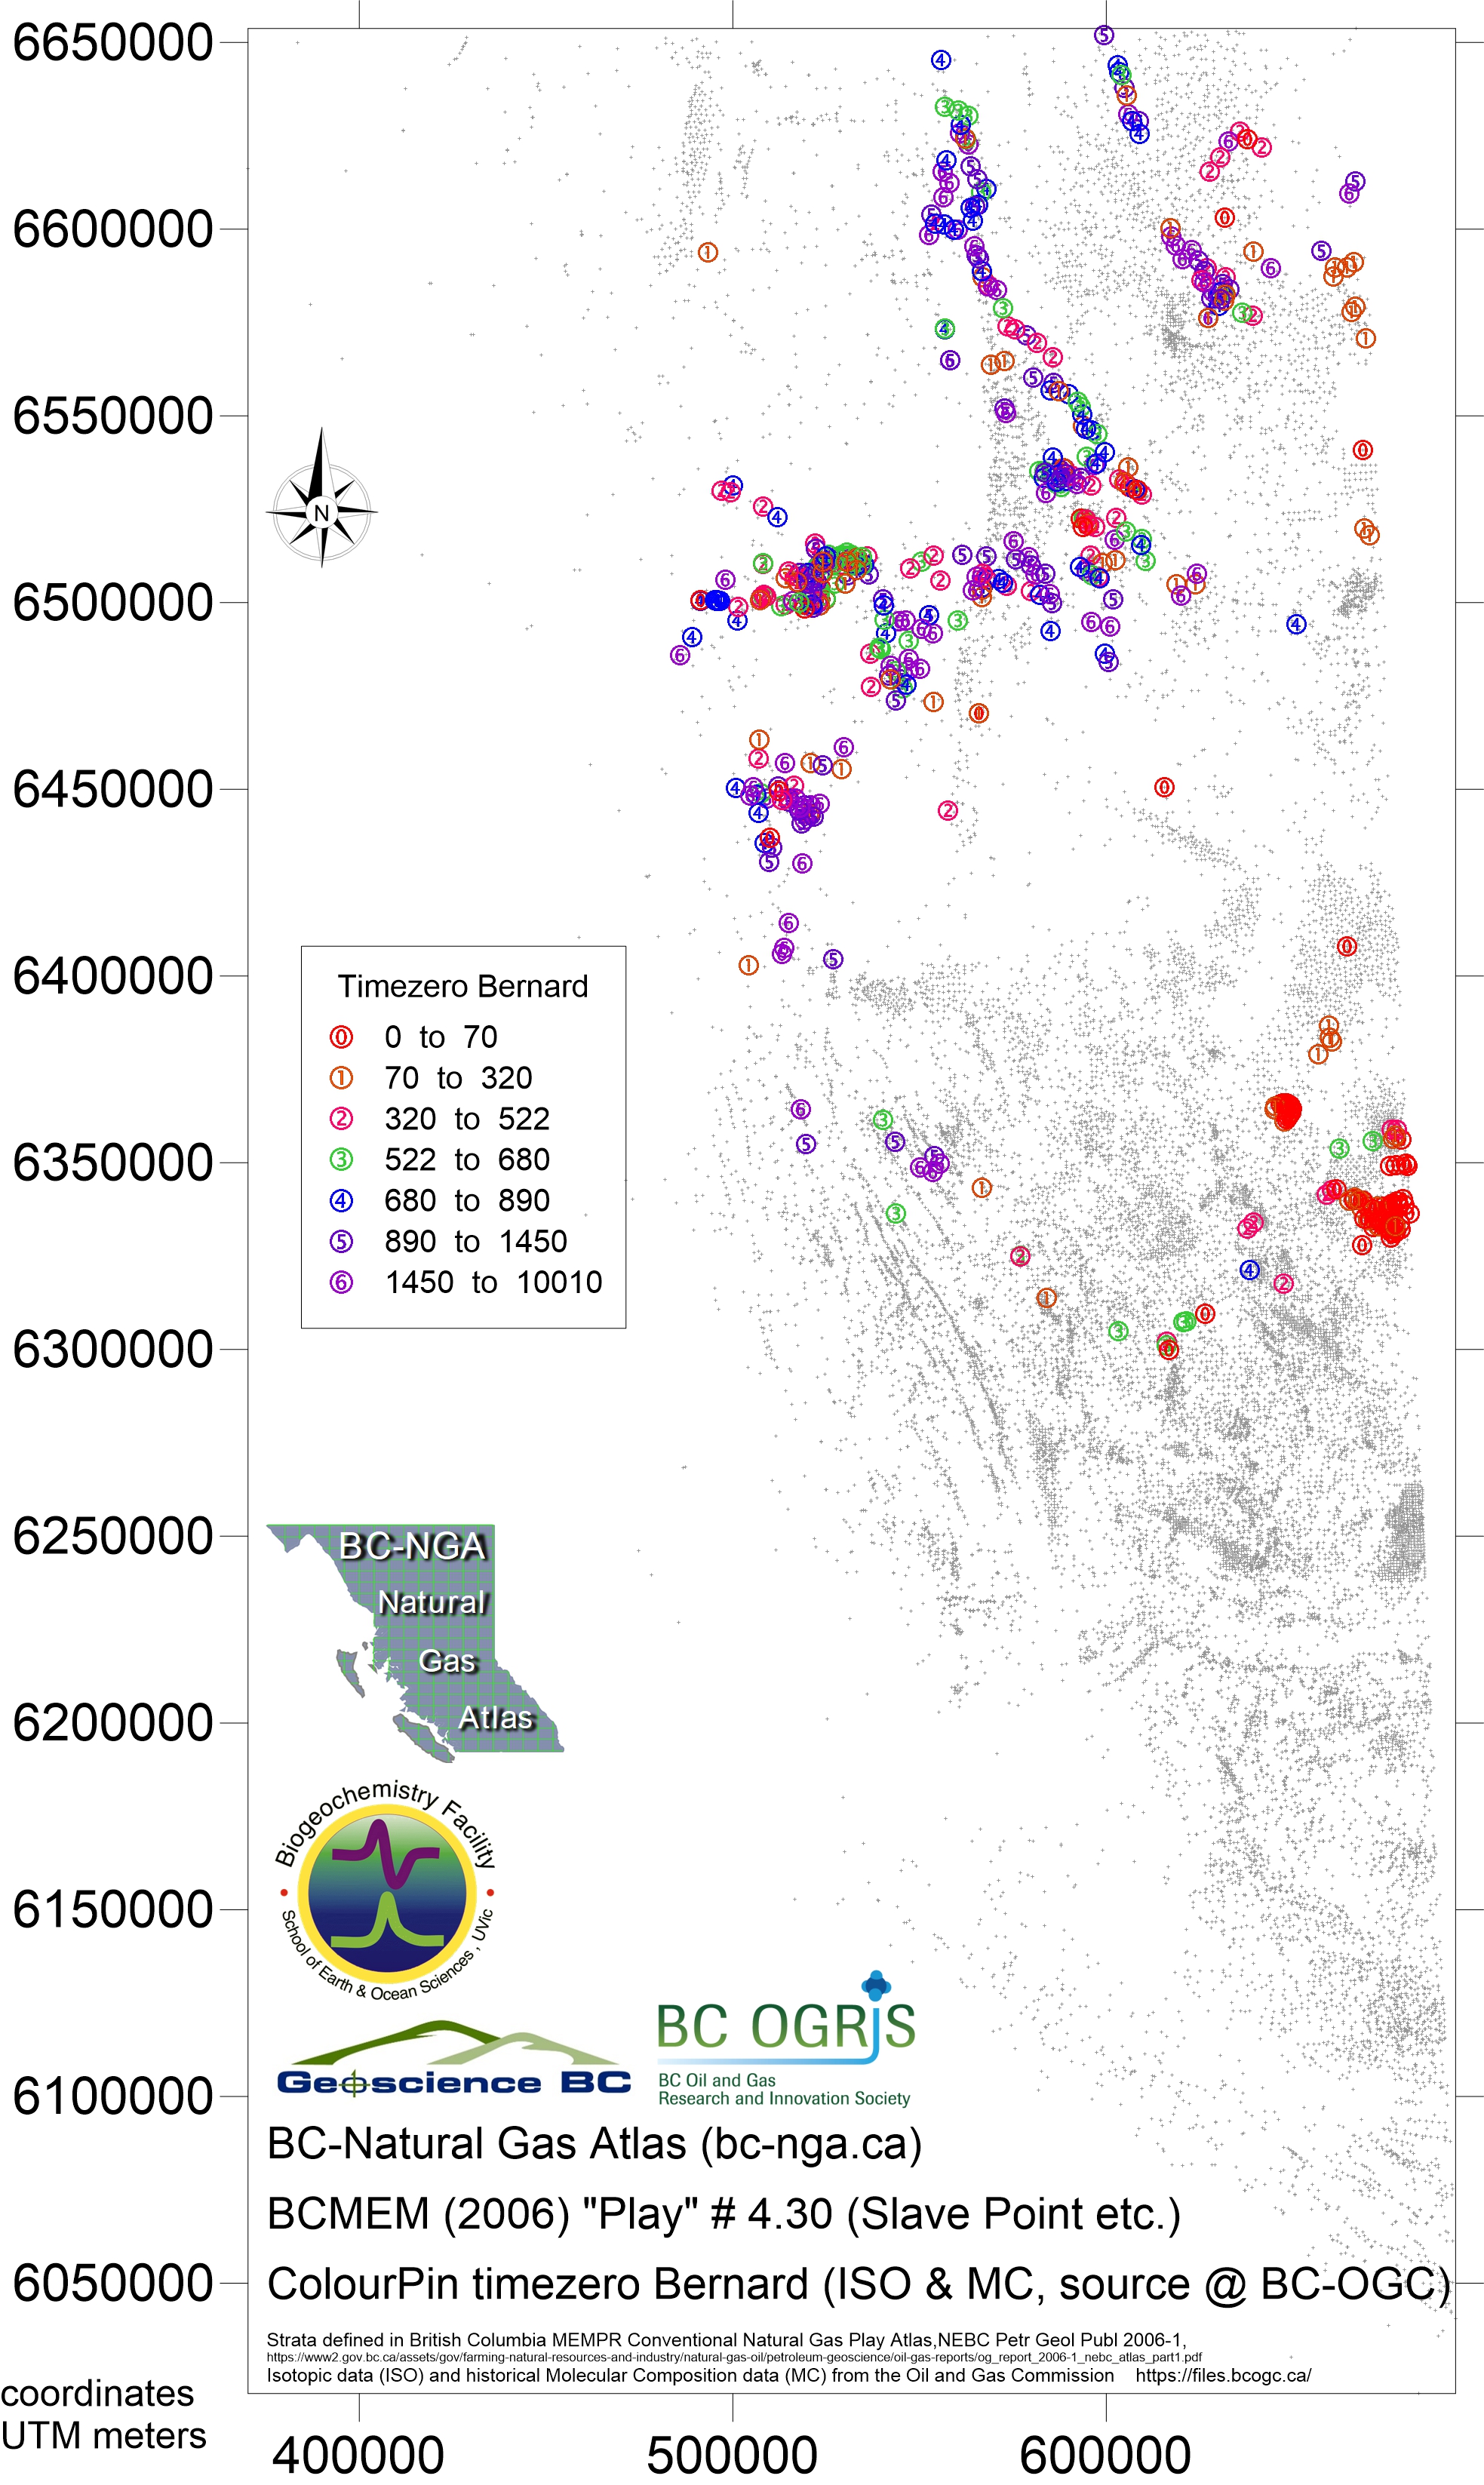
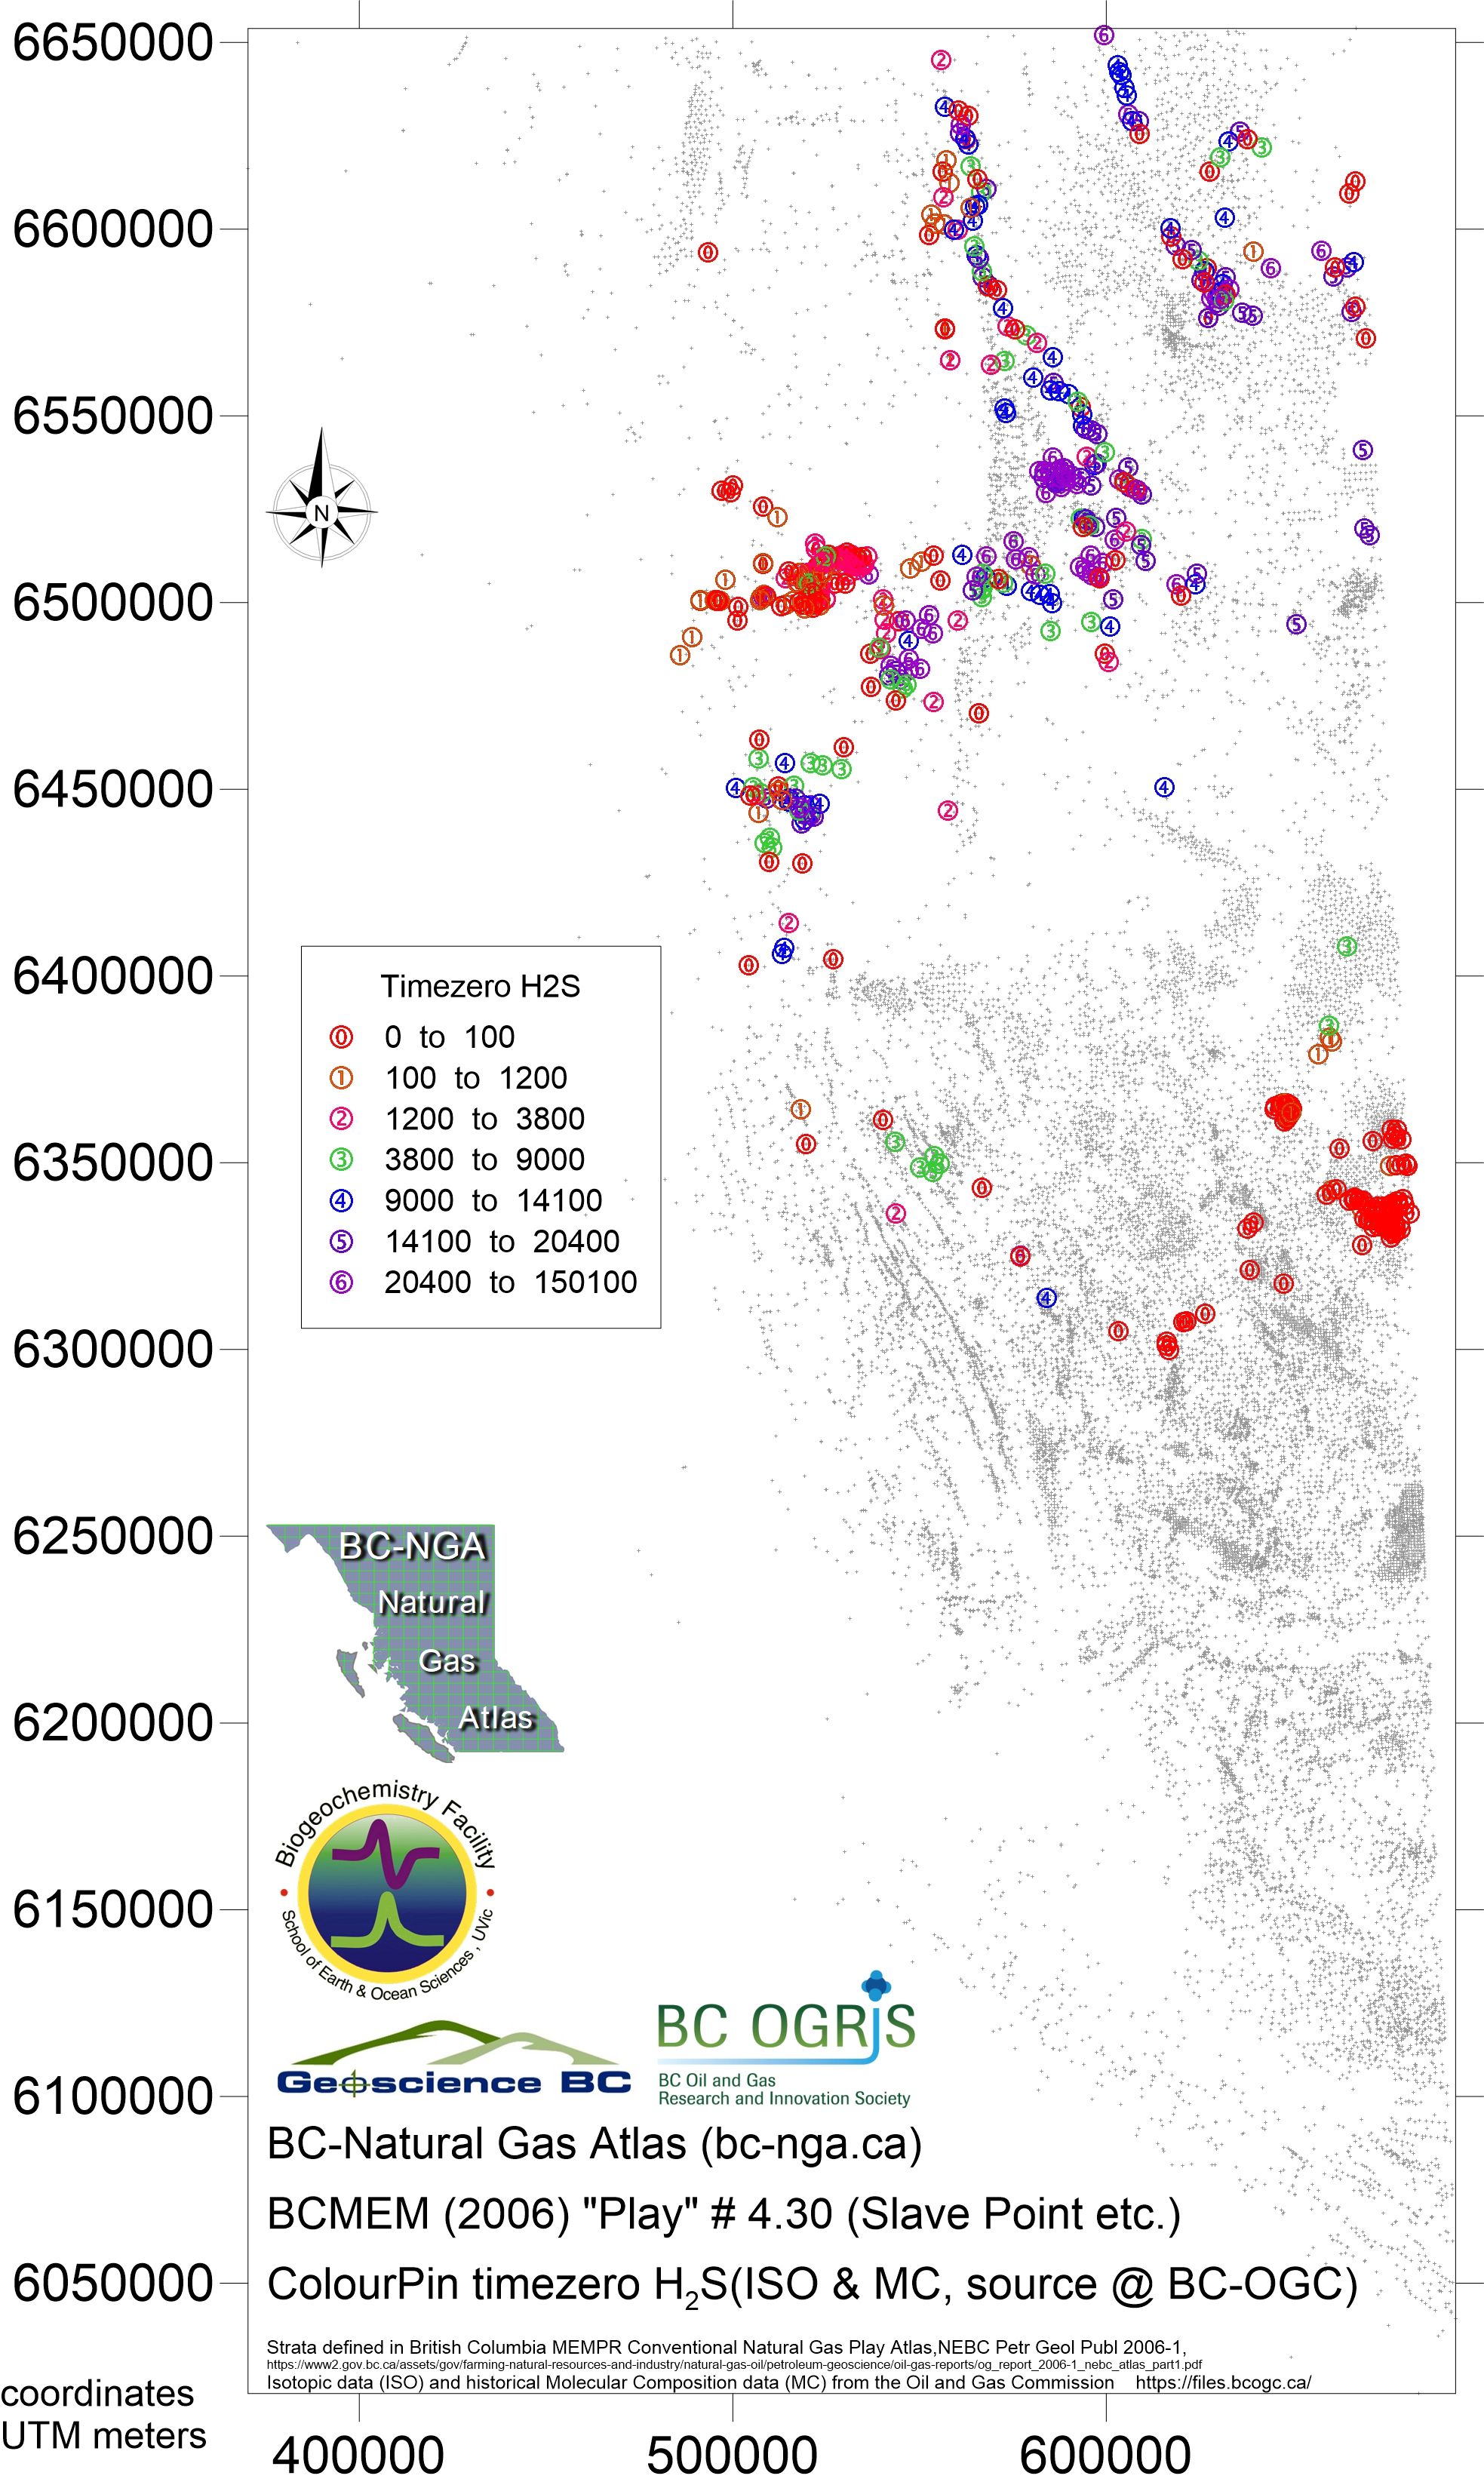
Play 4.28 Slave Point / Pine Point / Evie Formations and equivalents
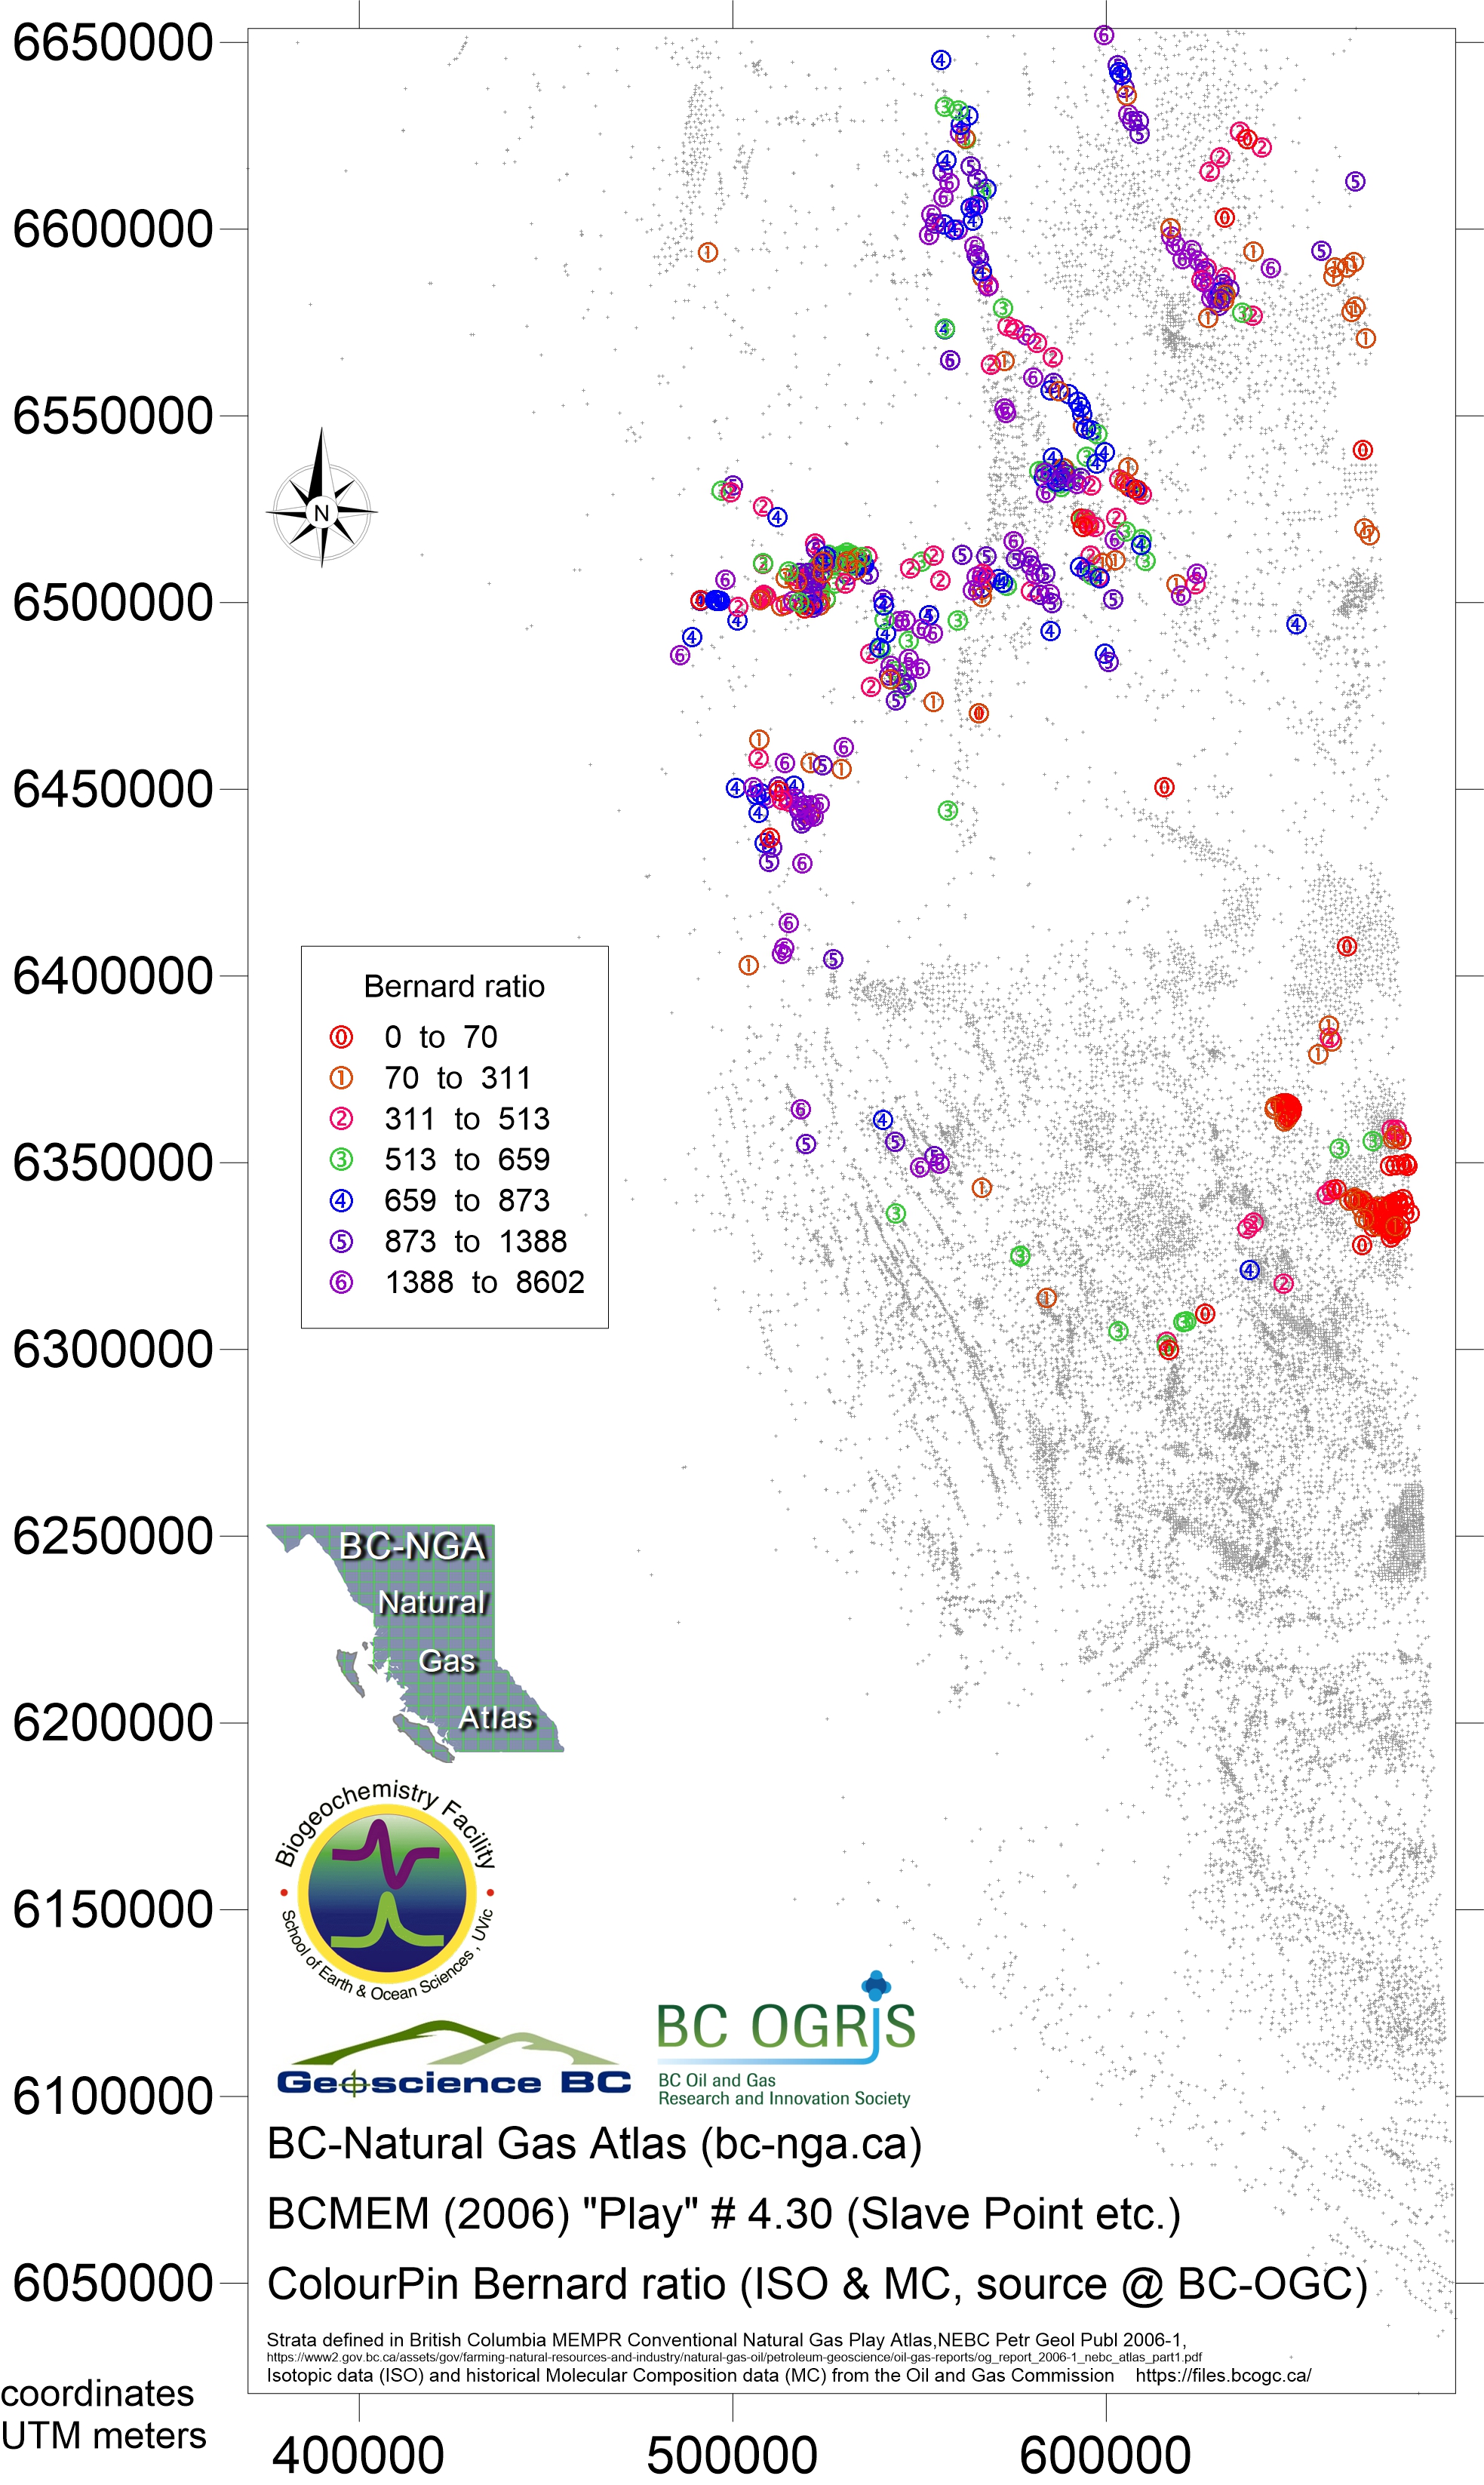
- Map329 Nov 2018 play 4.30 Slave/Pine/Keg eqv Bernard ratio
- Map330 Nov 2018 play 4.30 Slave/Pine/Keg eqv dryness ratio
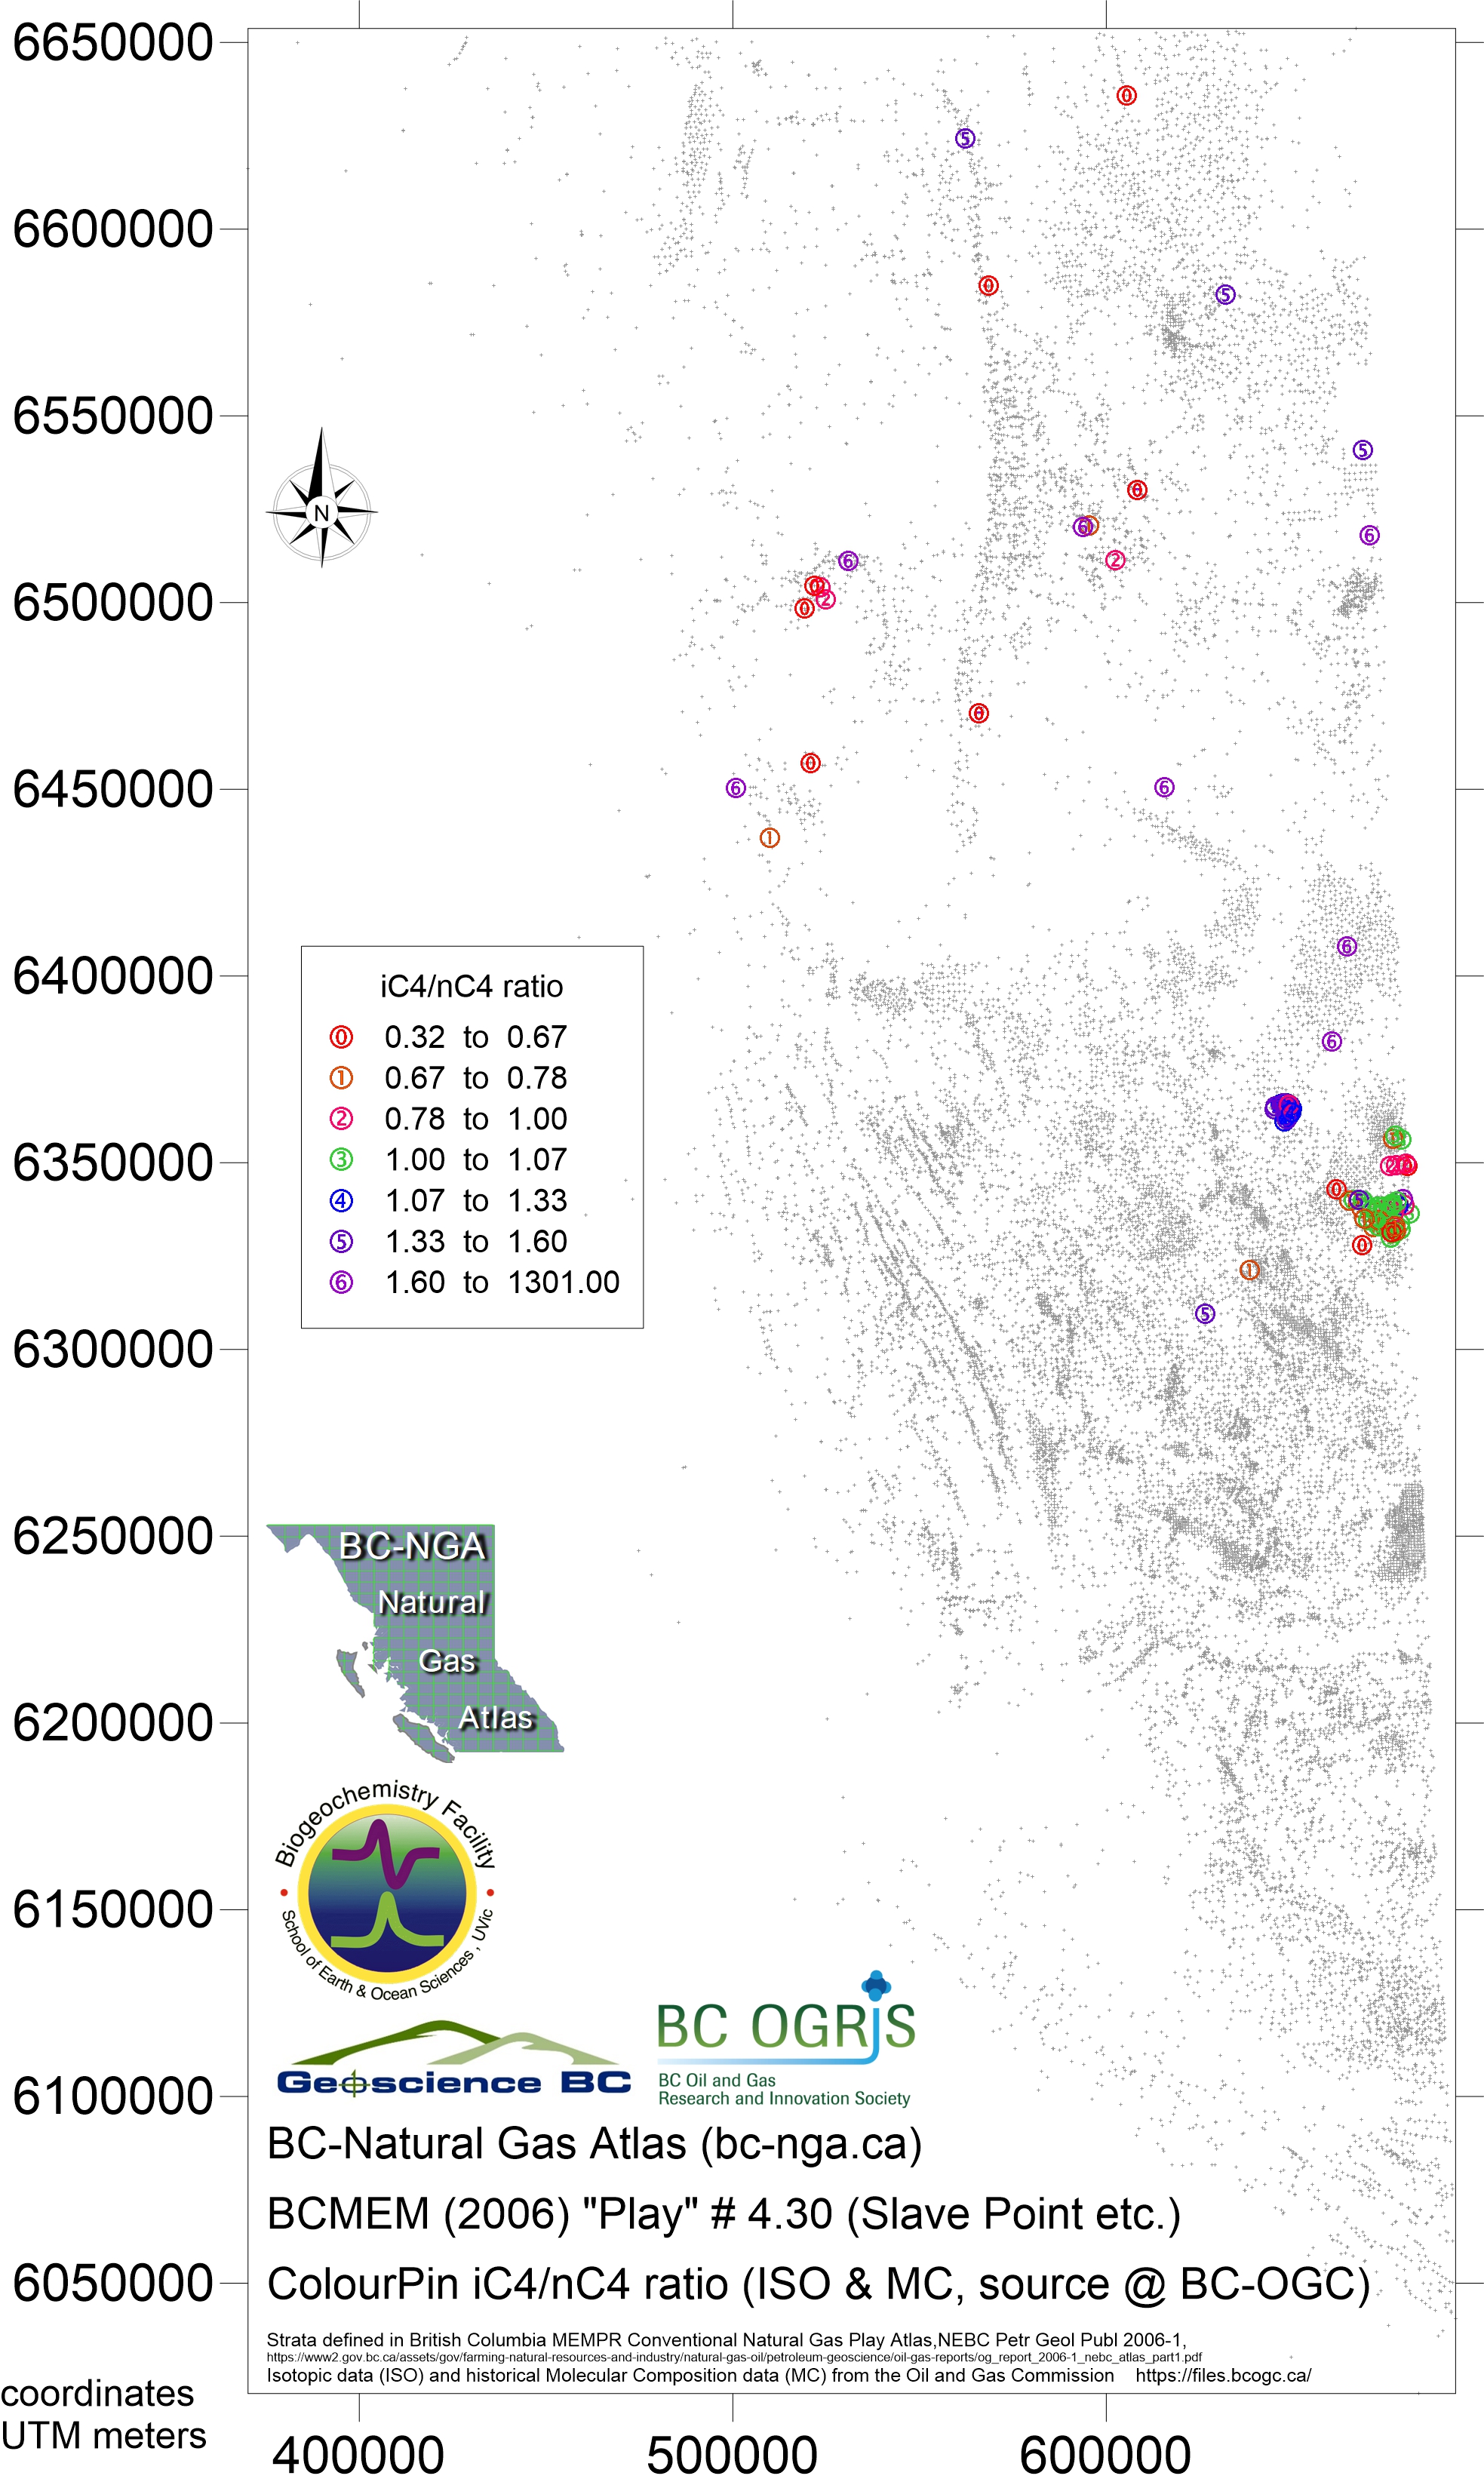
- Map331 Nov 2018 play 4.30 Slave/Pine/Keg eqv iC4nC4 ratio
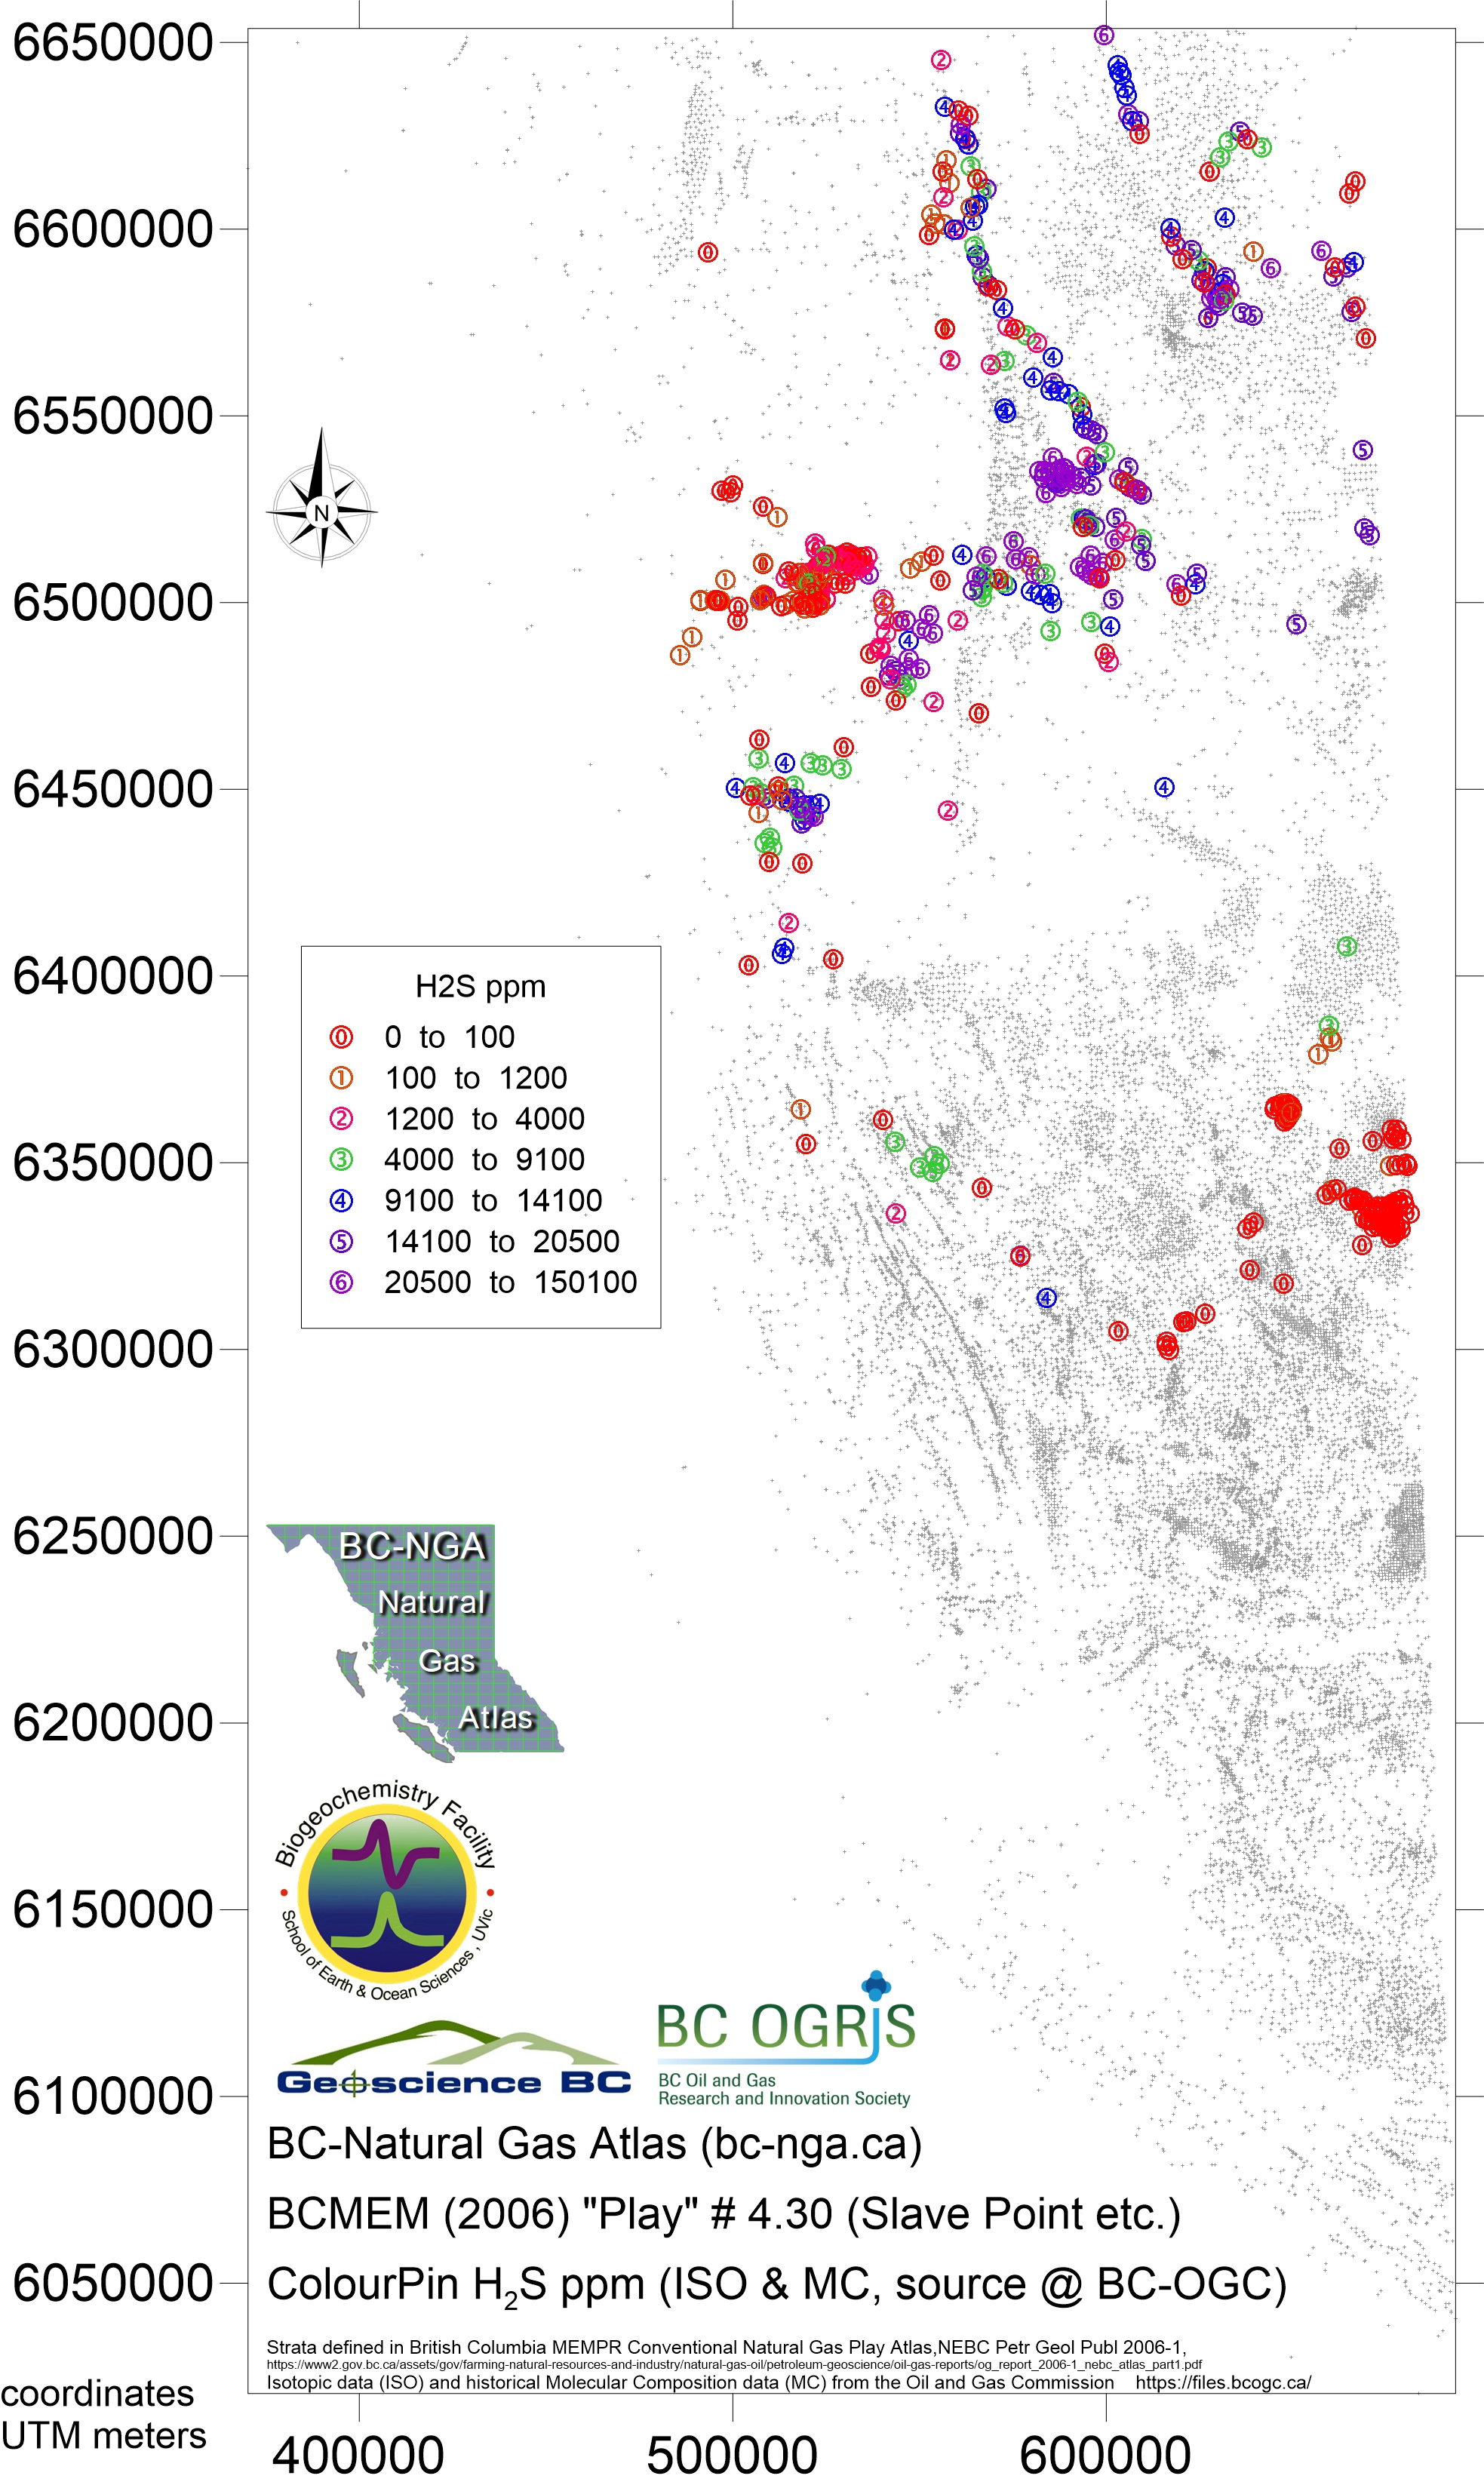
- Map332 Nov 2018 play 4.30 Slave/Pine/Keg eqv H2S ppm
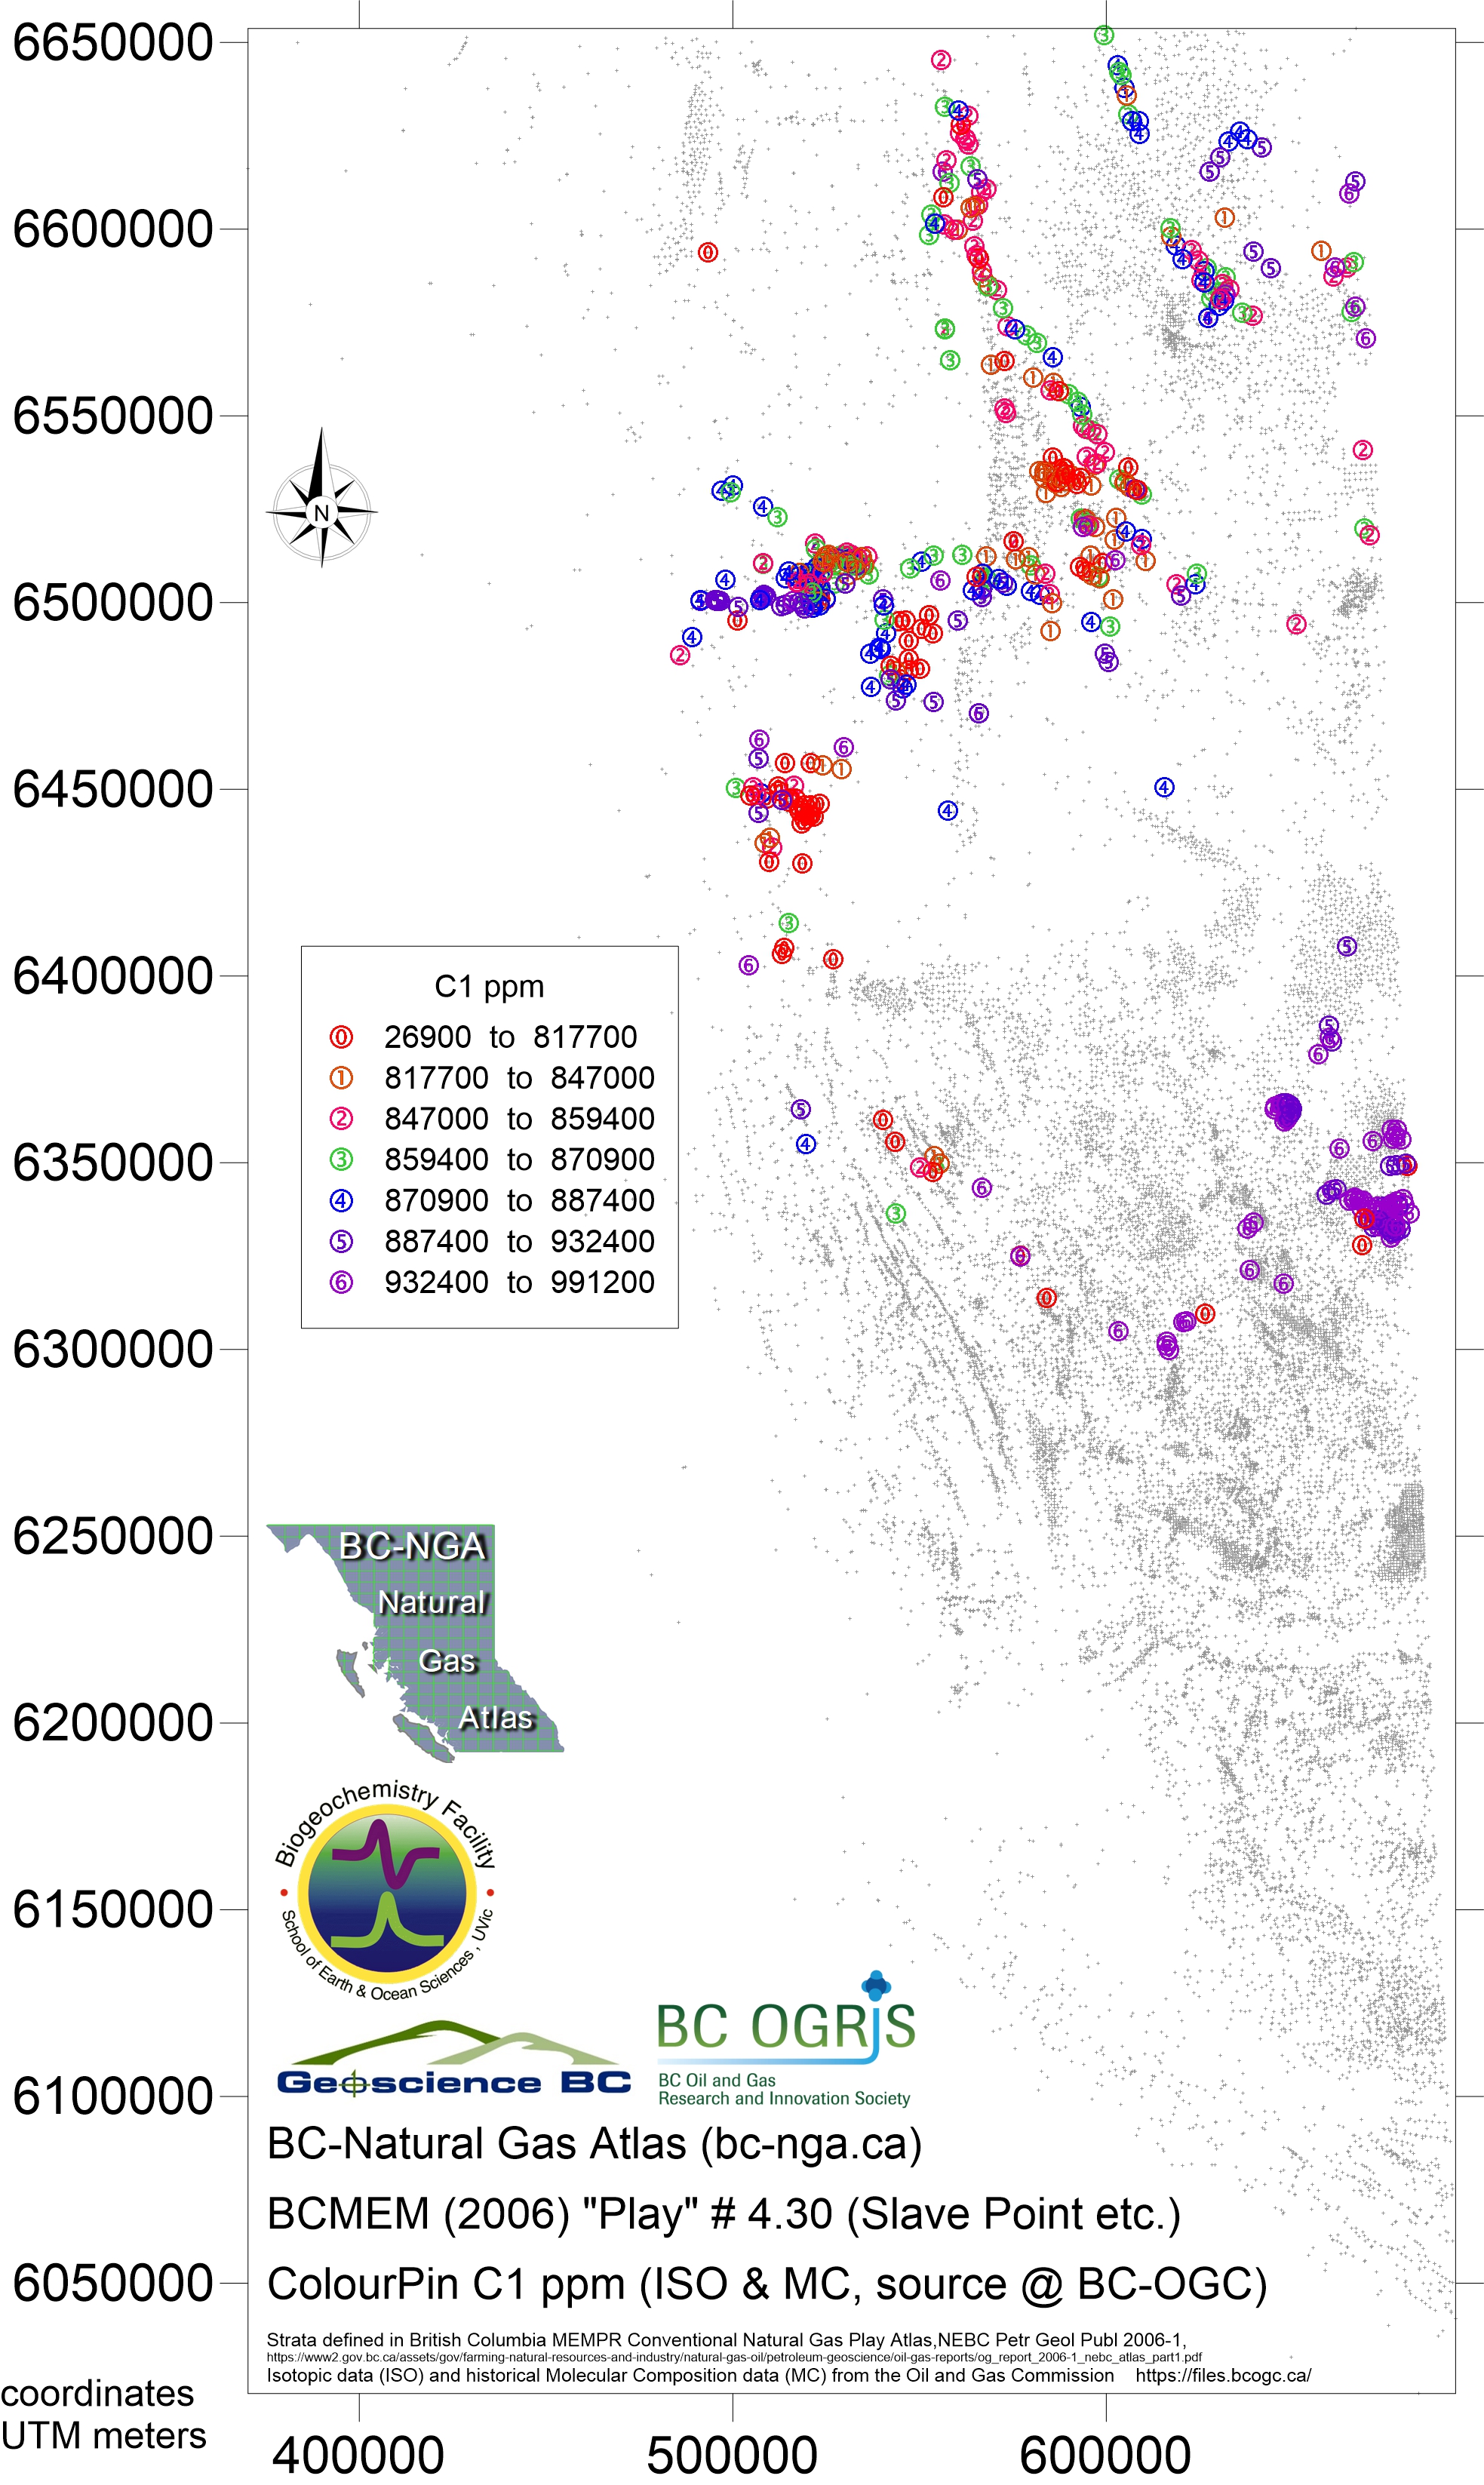
- Map333 Nov 2018 play 4.30 Slave/Pine/Keg eqv CH4 ppm
- Map334 Nov 2018 play 4.30 Slave/Pine/Keg eqv C2H6 ppm
- Map335 Nov 2018 play 4.30 Slave/Pine/Keg eqv C3H8 ppm
- Map336 Nov 2018 play 4.30 Slave/Pine/Keg eqv iC4H10 ppm
- Map337 Nov 2018 play 4.30 Slave/Pine/Keg eqv nC4H10 ppm
- Map338 Nov 2018 play 4.30 Slave/Pine/Keg eqv CO2 ppm
- Map339 Nov 2018 play 4.30 Slave/Pine/Keg eqv time series gradient Bernard ratio
- Map340 Nov 2018 play 4.30 Slave/Pine/Keg eqv time series gradient CO2
- Map341 Nov 2018 play 4.30 Slave/Pine/Keg eqv time series gradient H2S
- Map342 Nov 2018 play 4.30 Slave/Pine/Keg eqv time series start point Bernard ratio
- Map343 Nov 2018 play 4.30 Slave/Pine/Keg eqv time series start point CO2
- Map344 Nov 2018 play 4.30 Slave/Pine/Keg eqv time series start point H2S
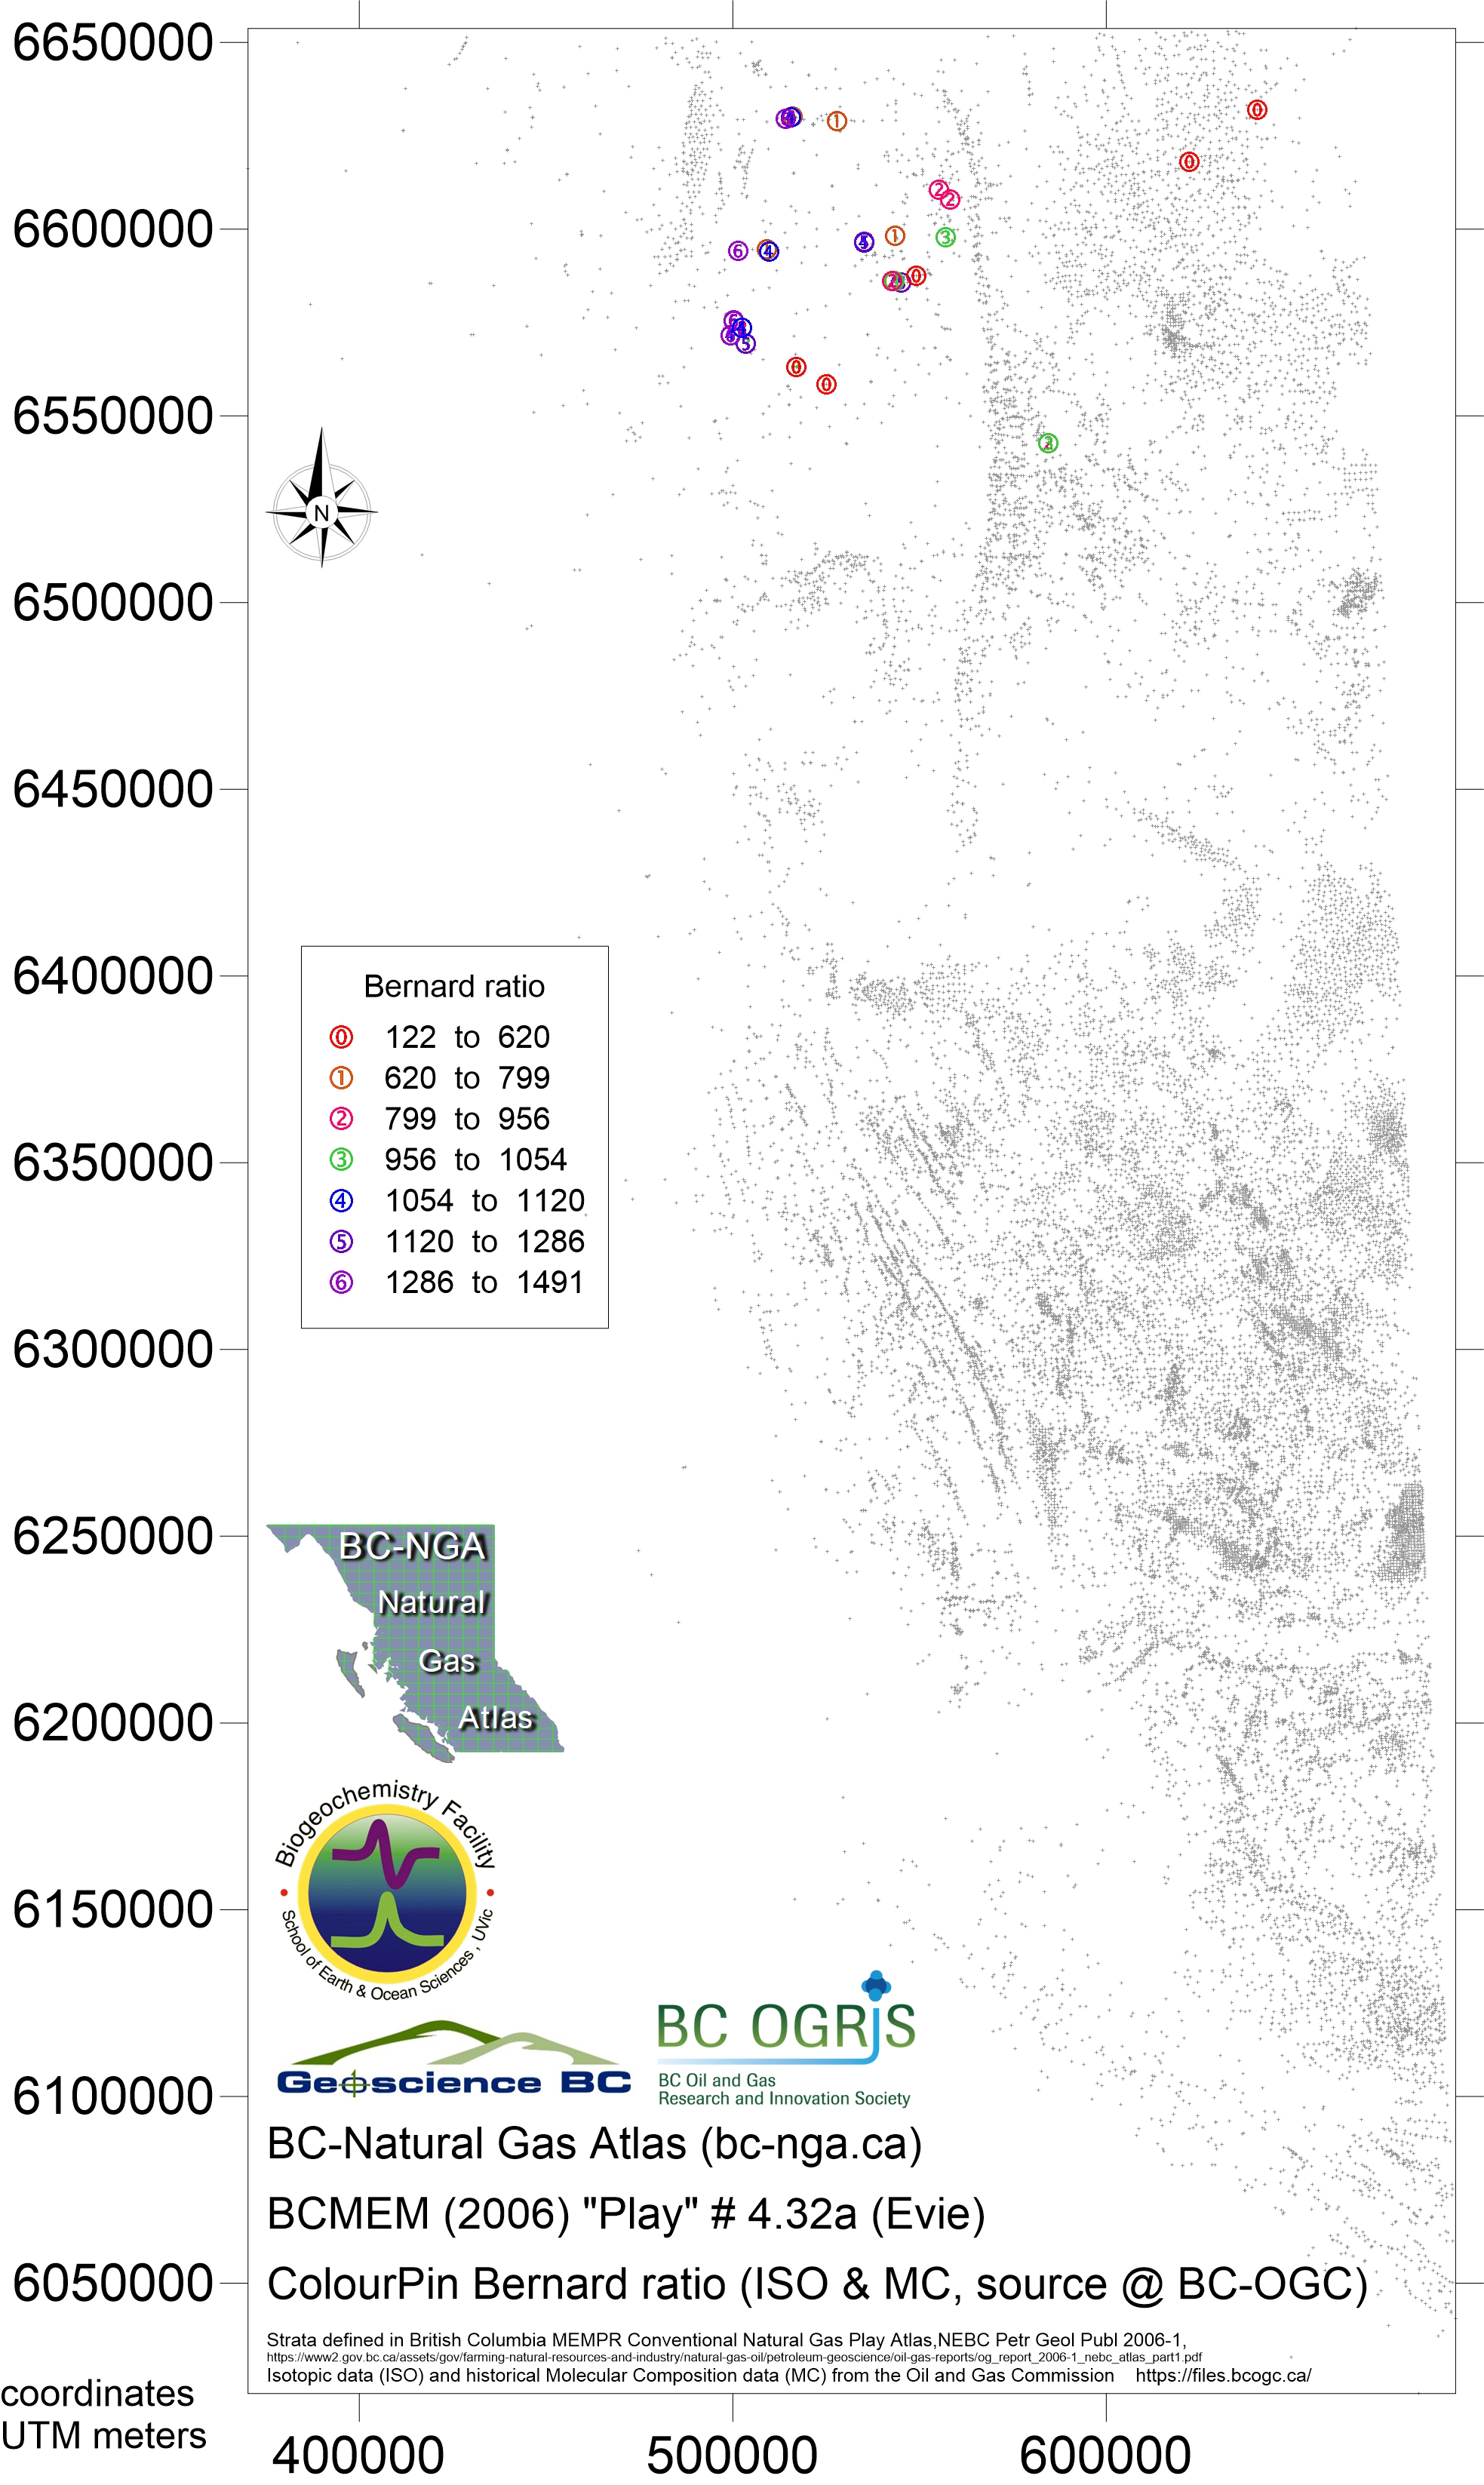
- Map345 Nov 2018 play 4.32a Evie eqv Bernard ratio
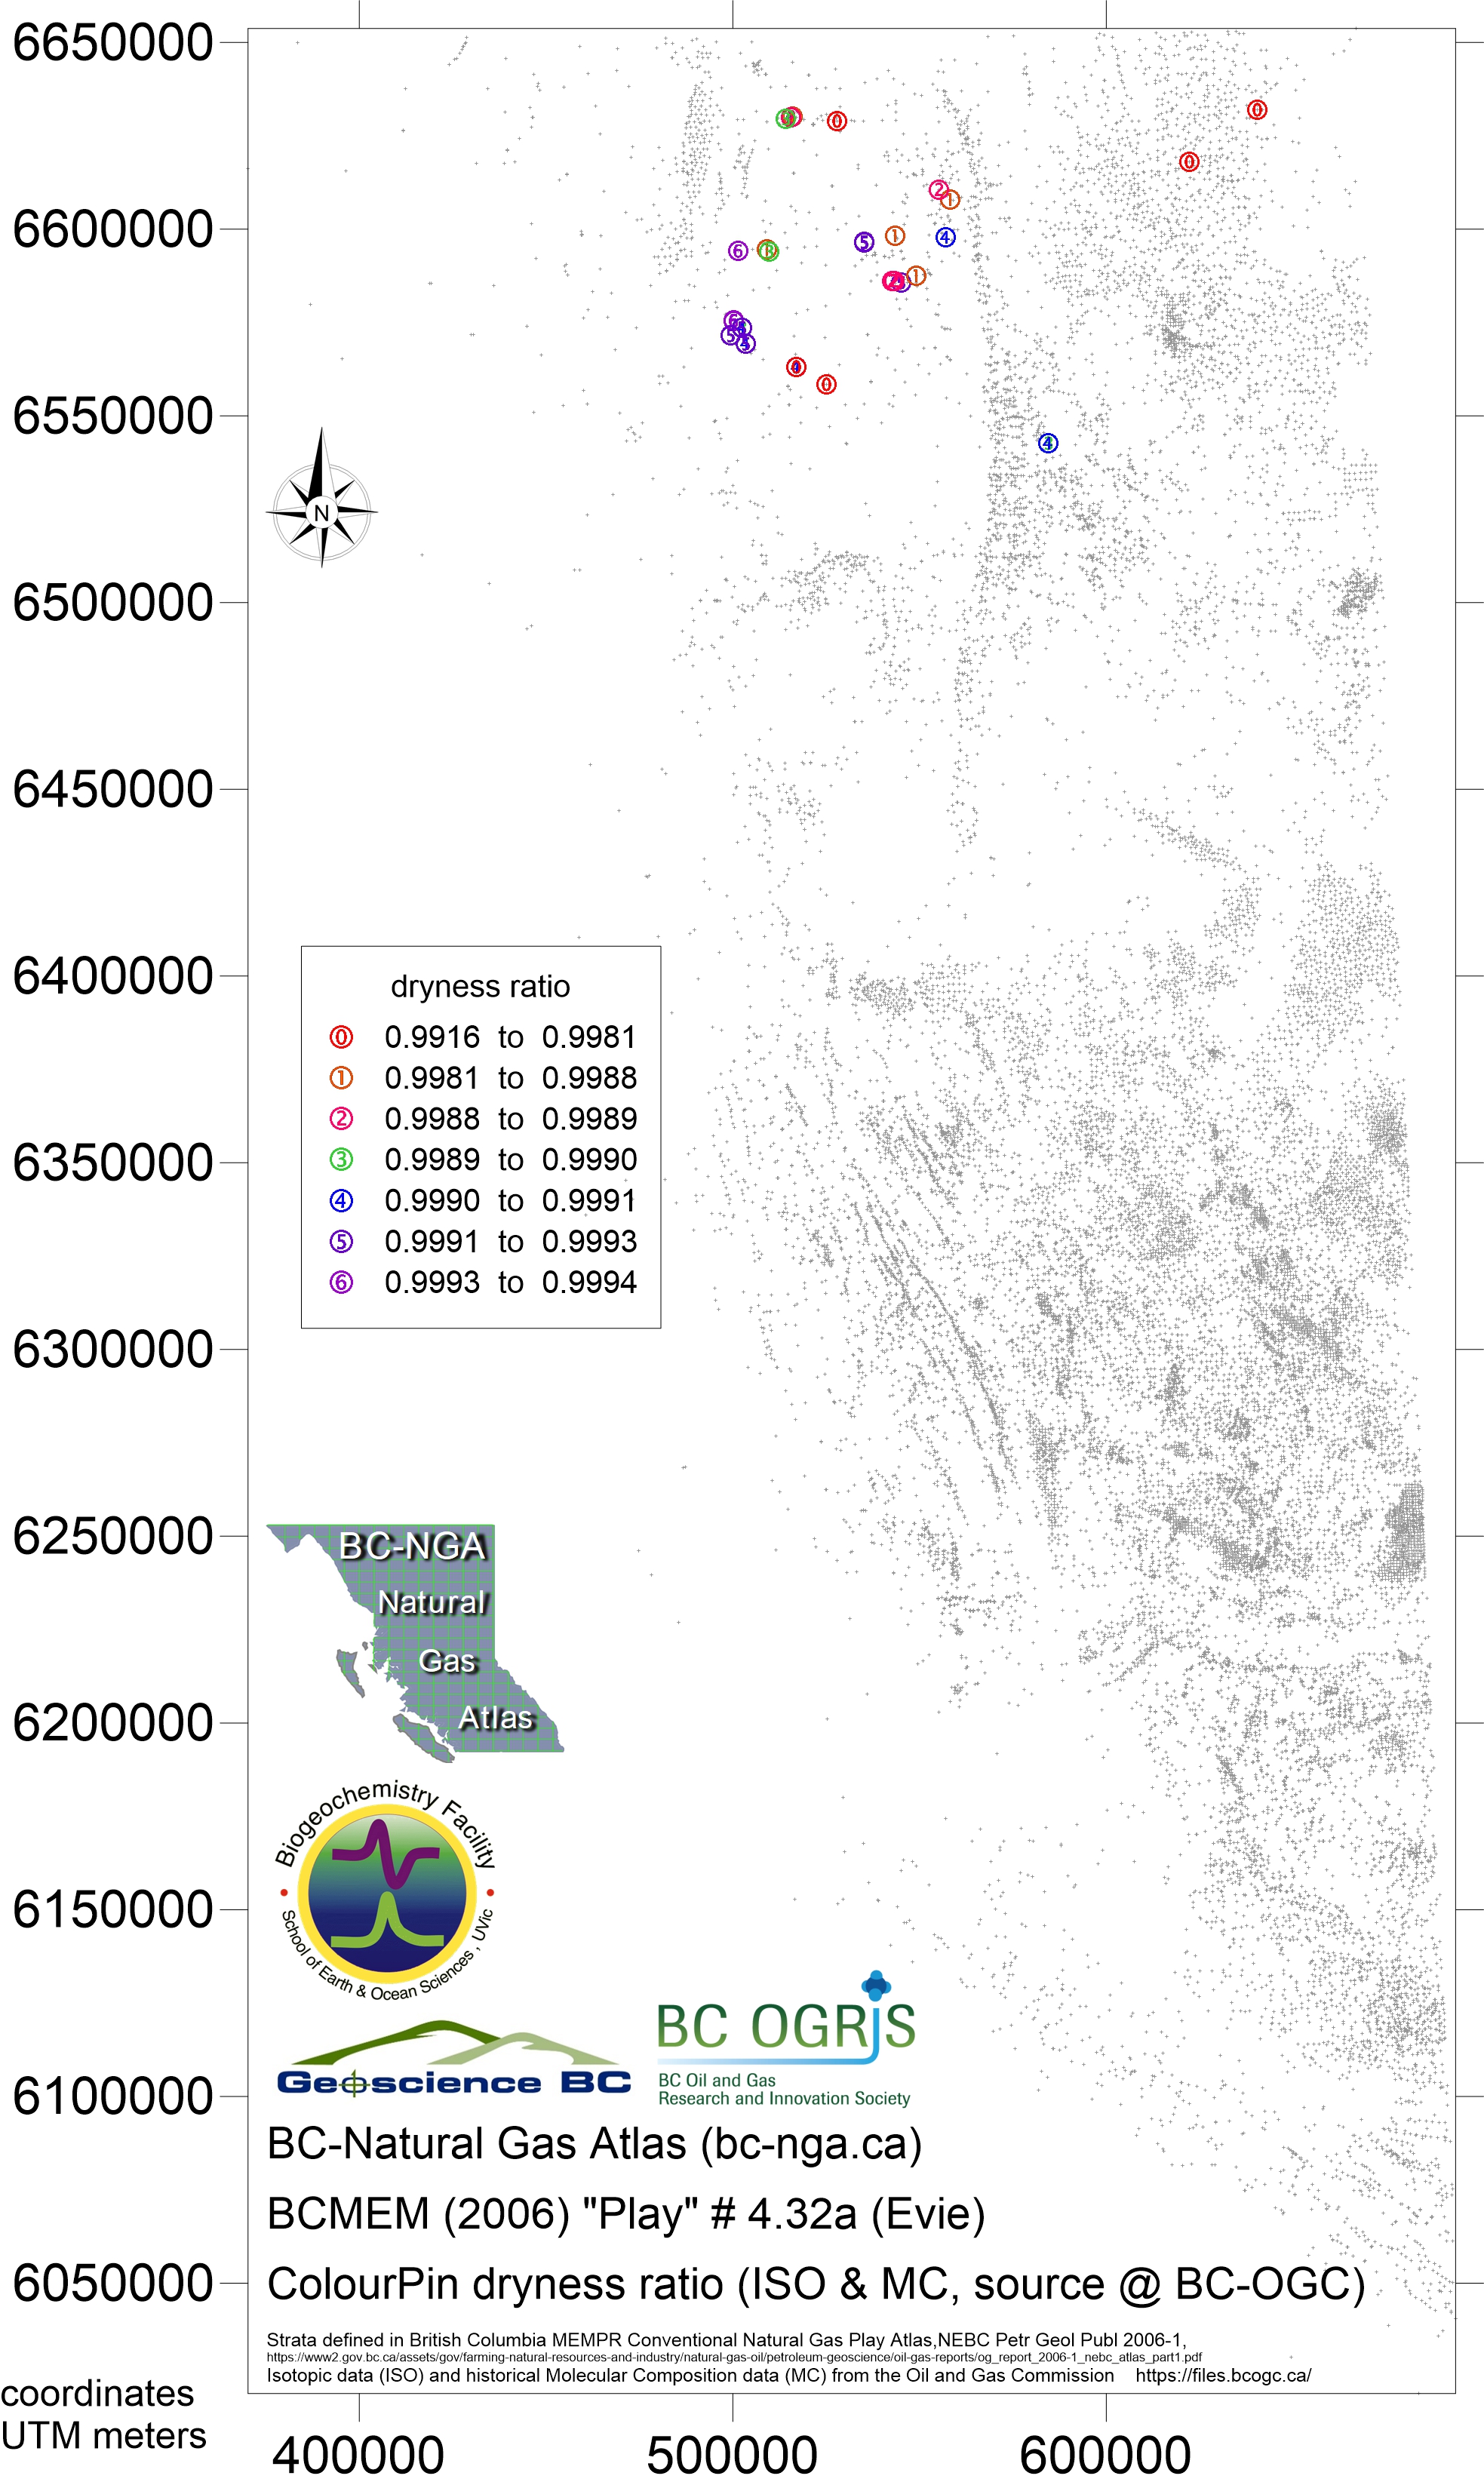
- Map346 Nov 2018 play 4.32a Evie eqv dryness ratio
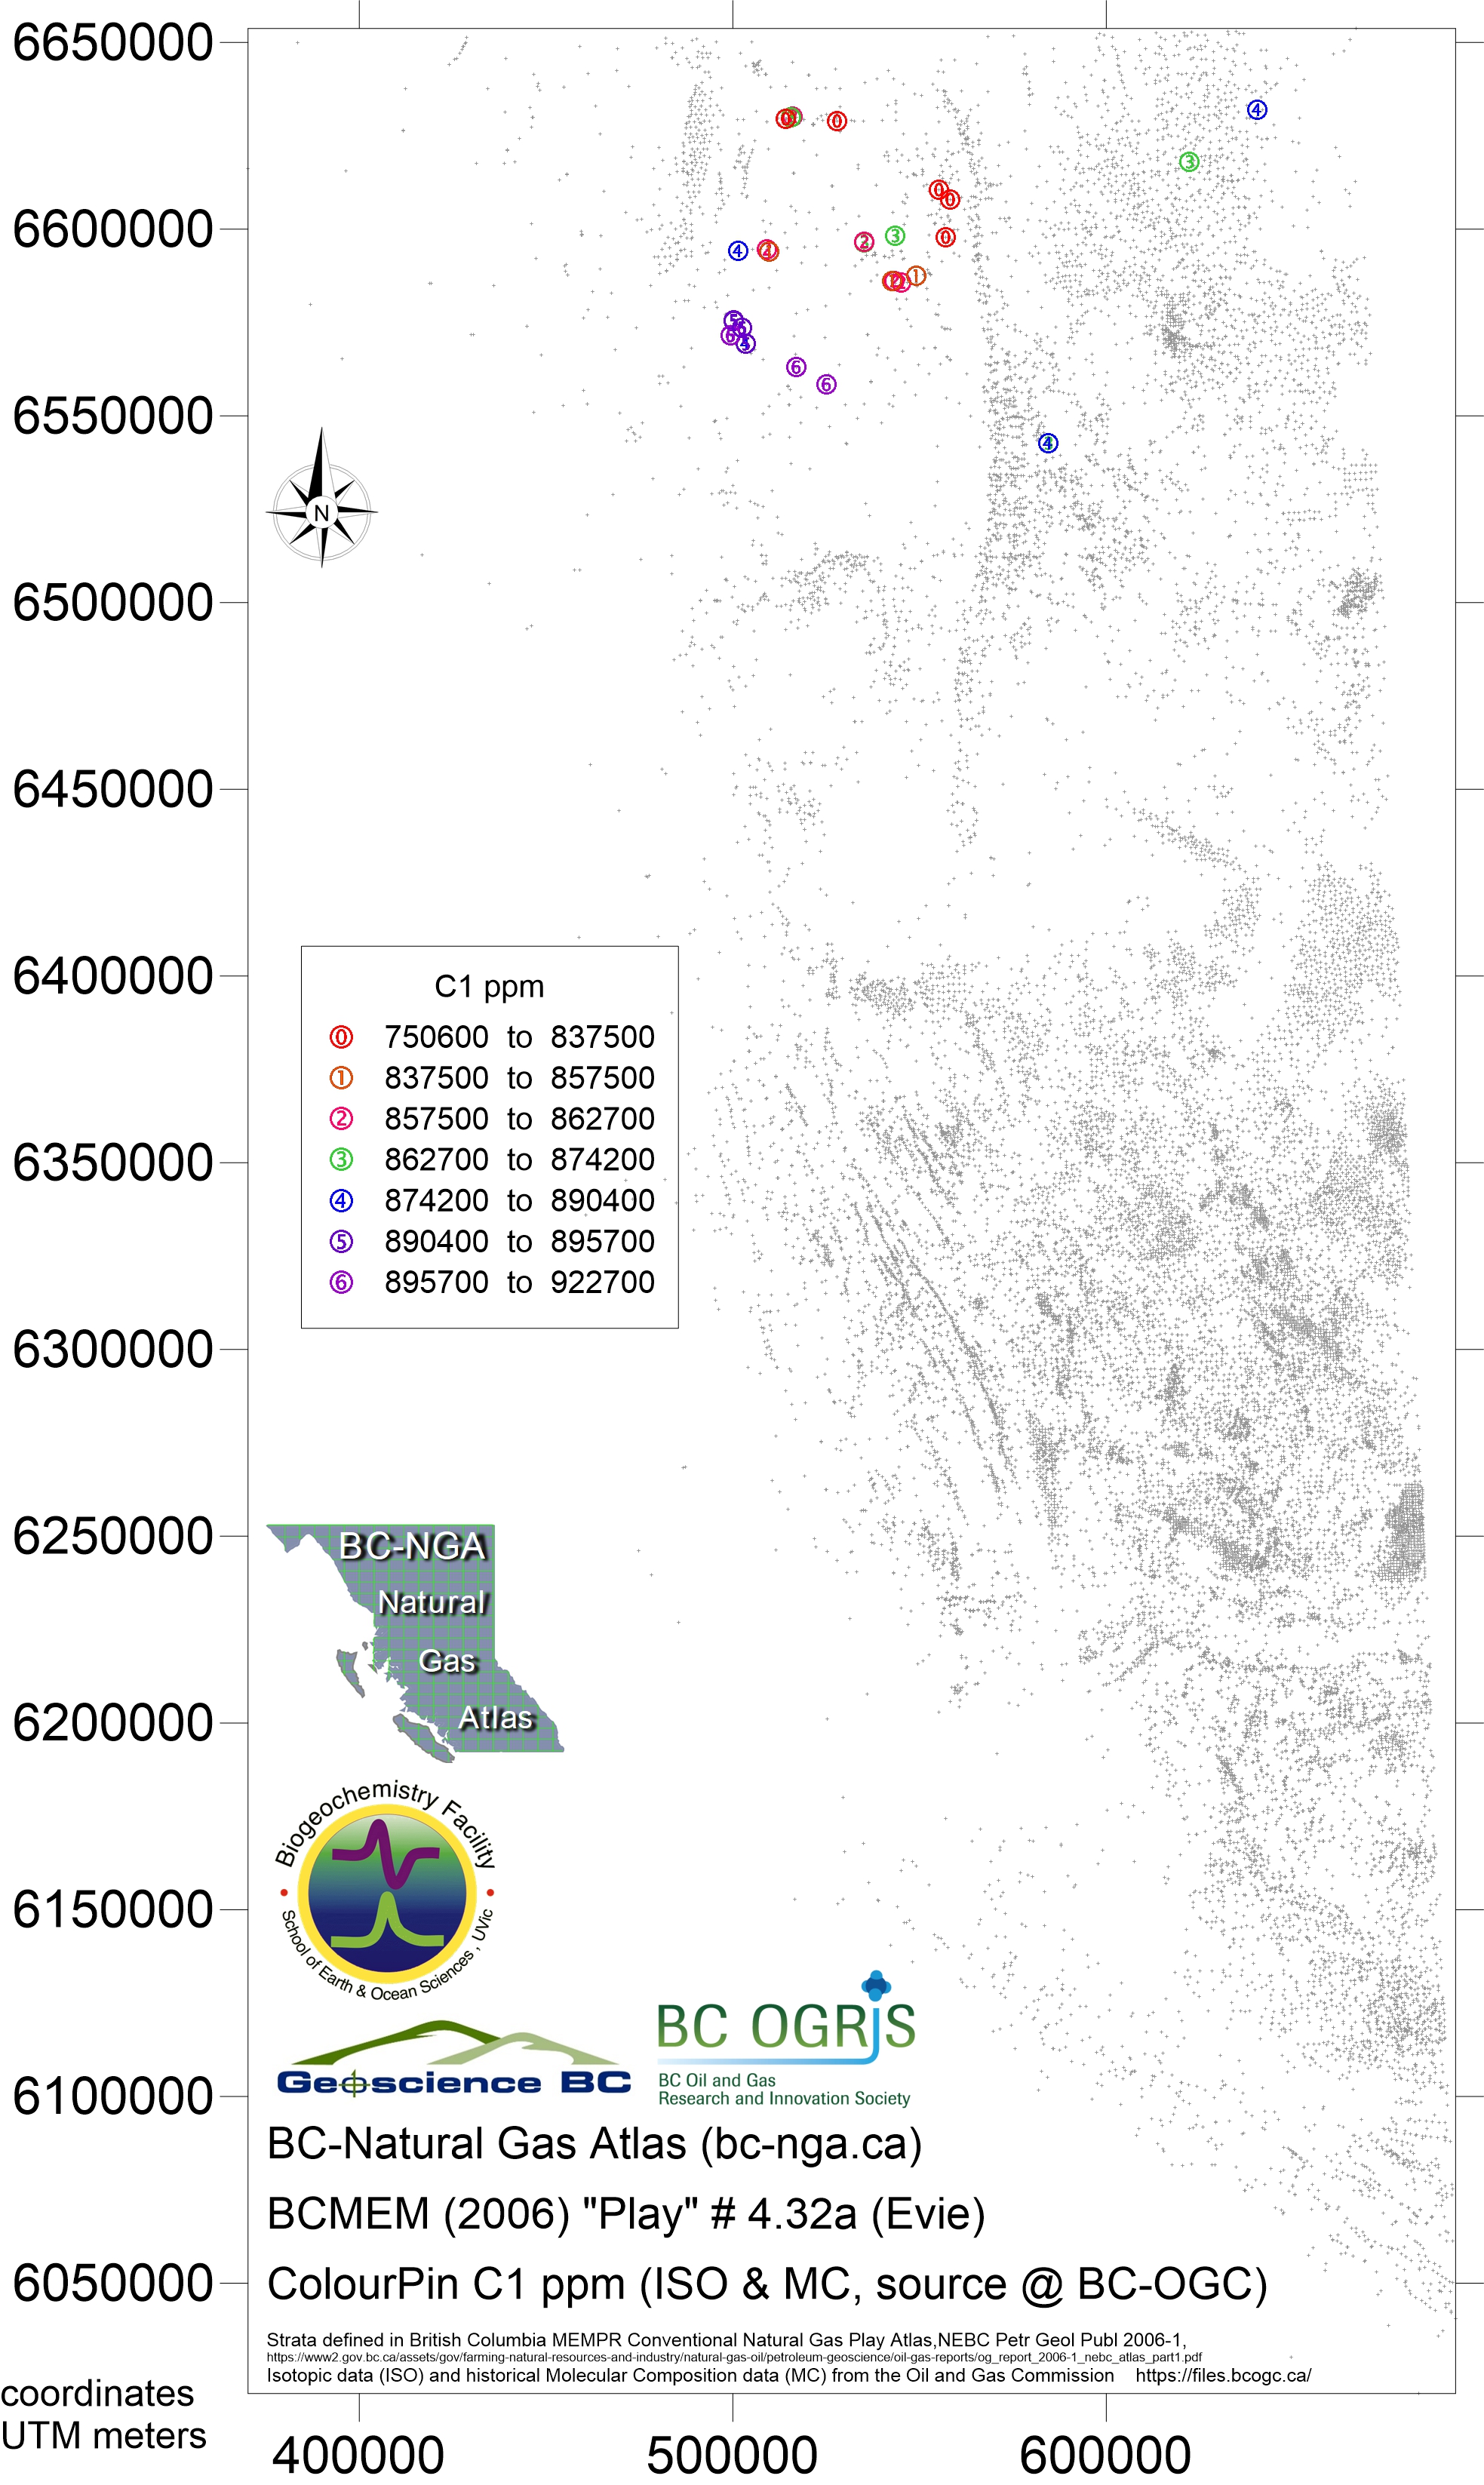
- Map347 Nov 2018 play 4.32a Evie eqv CH4 ppm
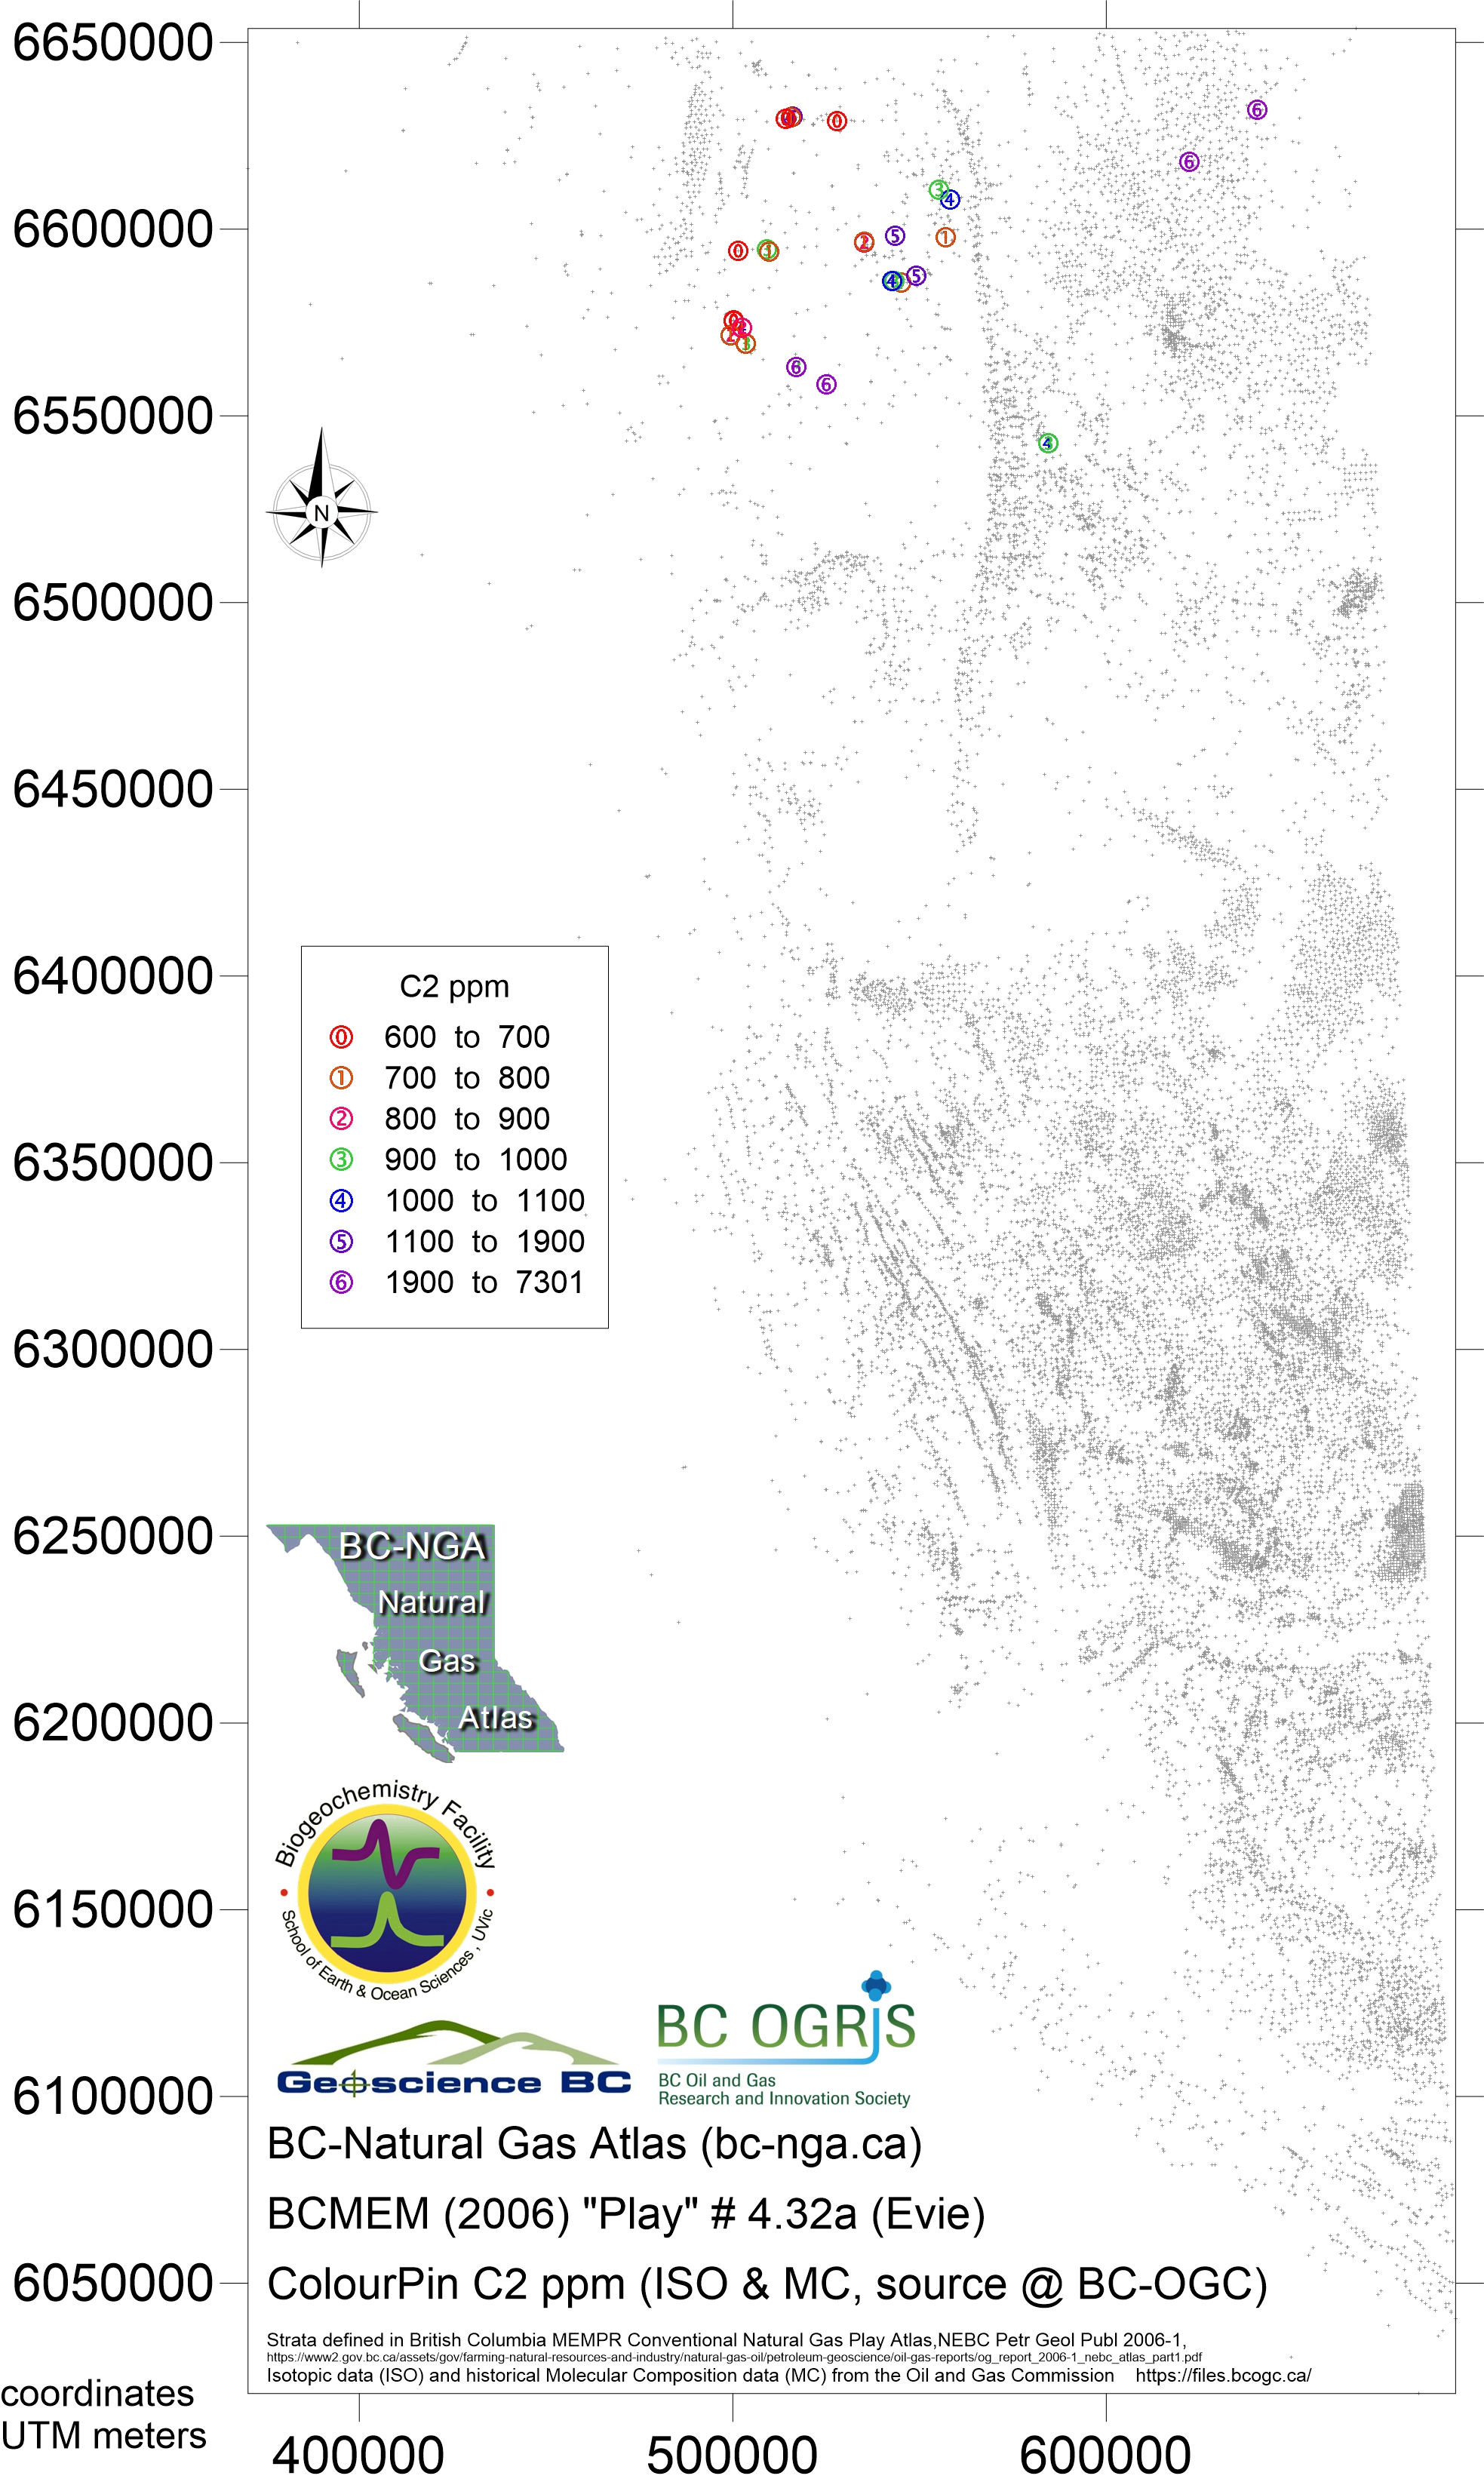
- Map348 Nov 2018 play 4.32a Evie eqv C2H6 ppm
- Map349 Nov 2018 play 4.32a Evie eqv CO2 ppm